Biodiversity conservation and environmental management in European farmlands
Doctor of Science Dissertation
Dr. Péter Batáry
University of Goettingen, Göttingen, Germany
2018
Table of contents
1. Introduction ... 5
1.1. Nature conservation in farmland ... 5
1.2. Structure of the thesis ... 6
2. Role of agri-environment schemes in nature conservation ... 9
2.1. History of agri-environment schemes in Europe ... 9
2.2. Big spending for agri-environment schemes ... 10
2.3. Ecological effectiveness of European agri-environment schemes ... 11
2.3.1. Effectiveness of schemes over time ... 12
2.3.2. Effectiveness of schemes in productive versus non-productive areas ... 13
2.4. The human factor ... 13
2.5. Future research ... 14
2.5.1. Effectiveness of schemes for enhancing ecosystem services ... 14
2.5.2. Effectiveness of schemes in agriculturally marginal areas ... 14
2.5.3. Cost-effectiveness of agri-environment schemes ... 15
2.5.4. Importance of training and advice to the effectiveness of agri-environment schemes .... 15
3. Managing species rich grasslands ... 16
3.1. Grassland versus non-grassland bird diversity in “puszta” grasslands ... 16
3.1.1. Material and methods ... 16
3.1.2. Results ... 18
3.1.3. Discussion ... 20
3.1.4. Conclusions ... 21
3.2. Effects of grassland fragmentation on insect communities ... 21
3.2.1. Material and methods ... 21
3.2.2. Results ... 23
3.2.3. Discussion ... 25
3.2.4. Conclusions ... 26
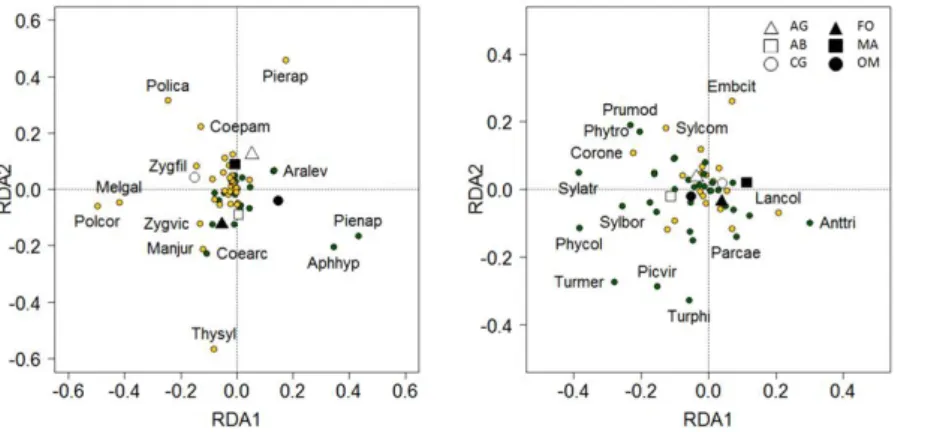
3.3. Butterfly and bird diversity in orchard meadows and calcareous grasslands ... 27
3.3.1. Material and methods ... 27
3.3.2. Results ... 29
3.3.3. Discussion ... 31
3.3.4. Conclusions ... 35
4. Impact of hedgerow-forest connectivity on biodiversity and ecosystem function ... 36
4.1. Effect of isolation of hedges from forests on birds ... 36
4.1.1. Material and methods ... 36
4.1.2. Results ... 38
4.1.3. Discussion ... 39
4.1.4. Conclusions ... 40
4.2. Effects of mass-flowering crops on pollination of hedge plants ... 41
4.2.1. Material and methods ... 41
4.2.2. Results ... 44
4.2.3. Discussion ... 45
4.2.4. Conclusions ... 47
5. Comparing effectiveness of agri-environment management in cropland and grassland ... 49
5.1. Management effects on arthropods in Hungarian grasslands and cereal fields ... 49
5.1.1. Material and methods ... 49
5.1.2. Results ... 52
5.1.3. Discussion ... 52
5.1.4. Conclusions ... 54
5.2. Responses of plants and arthropods to management in crops and grasslands ... 55
5.2.1. Material and methods ... 55
5.2.2. Results ... 57
5.2.3. Discussion ... 59
5.2.4. Conclusions ... 61
6. Landscape moderation and regional differences of biodiversity patterns ... 62
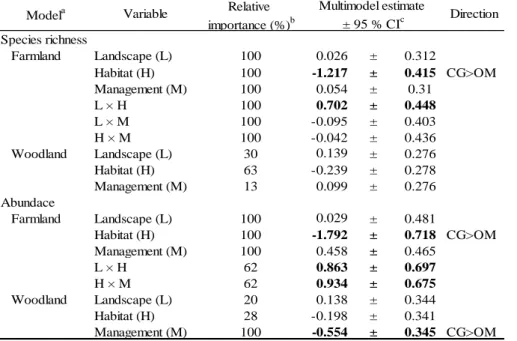
6.1. Landscape-moderated biodiversity effects of agri-environmental management ... 62
6.1.1. Material and methods ... 62
6.1.2. Results ... 65
6.1.3. Discussion ... 67
6.1.4. Conclusions ... 68
6.2. Harnessing the biodiversity value of Central and Eastern European farmland ... 69
6.2.1. Legacy of communist agriculture and its implications for farmland biodiversity ... 69
6.2.2. Agricultural habitats in Central and Eastern Europe underrepresented in literature ... 71
6.2.3. Harnessing the biodiversity value of Central and Eastern European farmland ... 72
6.2.4. Conclusions ... 73
6.3. Former iron curtain drives biodiversity-profit trade-offs in German agriculture ... 74
6.3.1. Material and methods ... 74
6.3.2. Results ... 77
6.3.3. Discussion and conclusions ... 79
7. Summary and outlook ... 80
8. Acknowledgements ... 83
9. References ... 84
1. Introduction
1.1. Nature conservation in farmland
Agricultural intensification is considered the most important driver of terrestrial biodiversity loss from local to global scale via its effects on habitat loss, habitat fragmentation and habitat conversion (Foley et al. 2011). Although in the Middle Ages even larger areas of Europe were under agriculture than today, farmland biodiversity was very high due to a traditionally extensive management.
Current European nature conservation aims at halting the on-going loss of farmland biodiversity, which has evolved during millennia of extensive management (Gaston 2010). Since the early 20th century, the development of the Haber–Bosch process for the mass production of nitrogen fertilizers, and later on the birth of pesticides, allowed more effective agricultural practices (Smil 1999). The increasing use of agrochemicals was accompanied by increasing mechanisation and gained much ground after the Second World War. This meant not only field scale intensification, but also changes at higher spatial scales, such as landscape and regional scales (Tscharntke et al.
2005a). Changes at country-wide scales happened during the beginning of the cold war, when Europe was divided into East and West. In large parts of the East the collectivisation of farms resulted in large co-operatives, where field roads, hedgerows and field margins were eliminated to merge small fields into large-scale agricultural systems within a short time period (Báldi & Batáry 2011a). Of course, this did not affect all eastern countries and regions within countries equally due to various reasons, including political or geographical differences (e.g. mountain areas). The different historical trajectories of European countries and regions led to large heterogeneity between agricultural landscapes, affecting the associated biodiversity. The “rangeland” areas in Europe, where both mechanisation and agrochemical use failed or were not possible to implement, became increasingly abandoned, especially in more economically developed areas of Europe. Therefore, farmland conservation is often confined to these remaining, often protected semi-natural areas consisting mostly of grasslands and characterized by charismatic threatened species (for example those listed in the Habitat and Bird Directives of the EU).
Implementation of agri-environment schemes (AES) is another option for farmland conservation. AES include an array of tools set up to help farmers managing their land in an environmentally-friendly way. They are important for the conservation of high nature value farmland, for the preservation of genetic diversity, for the protection of a diversity of agro- ecosystems types and for producing food with a lower environmental and ecological footprint.
Historically AES were initiated to reduce the overproduction of agriculture by supporting set-aside management in the EU during the late 1980s. Meanwhile, AES aim more at mitigating negative effects of agricultural intensification. Today, a great variety of AES exist in the 28 members of the EU, as well as Switzerland and Norway. They can be classified basically in two groups: 1.) horizontal (or broad-and-shallow) schemes in all member countries, which combine environmental protection (soil, water) with nature conservation targets, such as organic management; 2.) regional (or narrow-and-deep) schemes, which target areas with high nature value for biodiversity conservation (Kleijn & Sutherland 2003). Although the effectiveness of schemes has been questioned from a nature conservation point of view (Kleijn et al. 2001), the accumulated evidence based on a meta-analysis by Bengtsson et al. (2005) showed that AES have a generally positive effect on biodiversity. Meanwhile, it has been also recognized that landscape structure may moderate the effectiveness of AES. One idea is that the schemes are more effective in regions where source populations survive in nearby natural or semi-natural habitats (Duelli & Obrist 2003).
In contrast to this assumption, Tscharntke et al. (2005a) hypothesized that AES may be most effective for increasing species richness in simple, but not in complex landscapes, because farms in complex landscapes are likely to already have high species diversity. Furthermore, Attwood et al.
(2008) reviewed local management effects on arthropods and found arthropod richness to be significantly higher in areas of less intensive land use.
Landscape heterogeneity has been proposed as a key tool in conserving farmland biodiversity (Benton et al. 2003). This might be true for intensively managed agricultural landscapes, but
increasing landscape heterogeneity can have also a negative effect on specialist species in more near-natural and less fragmented, low-intensity agricultural landscapes (Batáry et al. 2011a). Until recently, however, most studies focusing on how management intensity affects biodiversity considered the landscape compositional heterogeneity, such as land-use type diversity (often referred to as landscape complexity), amount of remaining semi-natural area or percentage of crop area. Thus there is a need to better integrate the role of landscape heterogeneity in studies on AES (Holzschuh et al. 2010; Concepción et al. 2012). Further, studies on semi-natural fragments embedded in the agricultural matrix often focused on the effects of size and isolation of fragments as parameters of landscape configuration, but rarely investigated these effects together with the effects of landscape composition (but see Marini et al. 2010).
In agroecological studies, especially those focusing on the effects of habitat management, such as AES, the results are often explained by spillover effects, i.e. the spread of plant propagules and animal individuals from nearby natural or semi-natural areas into the more intensively used agricultural areas. Invertebrates are known to immigrate into arable fields from adjacent natural habitats (Landis et al. 2000), but evidence of the opposite process is still rare (but see Rand et al.
2006). However, as the high productivity of arable fields during the growing season locally enhances arthropod densities, a massive and large-scale spillover of organisms from crop to non- crop areas can be expected (Tscharntke et al. 2005b). The potential impact of this spillover on adjacent natural and semi-natural habitats has largely been neglected, and is a little understood topic. Spillover of insect predators and other functionally important organisms from agricultural to natural habitats and back may be underestimated (Blitzer et al. 2012).
Not all species respond in the same way to agricultural intensification (Fuller et al. 2005;
Kleijn et al. 2006). As a recent study showed, there might be not only winners of extensification by AES, but also losers (Birkhofer et al. 2014). Such patterns might even change when we consider different spatial scales, since mobility of different species can be highly different (Dauber et al.
2005; Marini et al. 2012). Hence, AES effects depend on species traits, such as habitat or food specialisation, etc. Both local and landscape scale intensification select for traits, thereby shaping community composition and ecological functioning including ecosystem services, such as biocontrol or pollination (e.g. Batáry et al. 2013). This complexity needs to be considered when evaluating the role of environmental changes, such as habitat degradation, habitat fragmentation or landscape simplification.
This thesis is based on a collection of papers dealing with biodiversity conservation in European farmlands, often connected with measures of AES. These papers address gaps in the literature as outlined above and cover different habitat types, including extensively managed vast semi-natural grasslands in Hungary (“puszta”), intensively or extensively managed cereal fields and meadows, as well as semi-natural agricultural remnants, such as calcareous grassland fragments and hedgerows in Germany. The main management question behind this research is how biodiversity and associated ecosystem services can be maintained or improved with AES tools.
1.2. Structure of the thesis
The second chapter (Role of agri-environment schemes in nature conservation) contains one extensive synthesis paper about the European AESs, which gives a frame to the whole thesis. This chapter describes the history and heterogeneity of AESs and their economic performance. It contains two stand-alone meta-analyses about effectiveness of schemes over time, respectively, of schemes in productive versus non-productive areas. Additionally it emphasizes the importance of human factor, such as training of farmers. Finally, it shows future research directions.
The third chapter (Managing species rich grasslands) contains three case studies. The first paper comes from an EU project, where extensively and intensively grazed semi-natural pastures in Hungary were compared from a biodiversity point of view. It deals with the patterns of species richness and territory numbers of breeding grassland and non-grassland birds. The second paper focuses on leafhopper communities of calcareous grassland fragments in Germany by studying the effects of fragment size, their connectivity and matrix composition. The third paper deals with
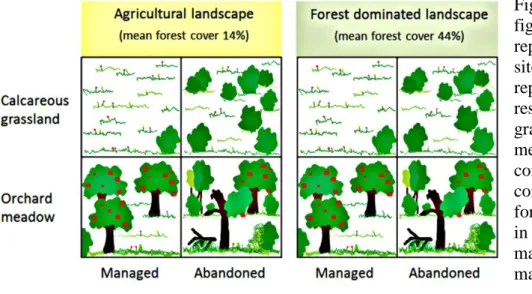
butterfly and bird diversity in orchard meadows and calcareous grasslands in contrasting landscape context (agricultural or forest-dominated) differing in management (regularly managed or abandoned management). There are several further closely related own papers not detailed in the thesis, e.g.: Batáry et al. 2007. Diversity and Distributions; Batáry et al. 2007. Basic and Applied Ecology; Batáry et al. 2008. Biological Conservation; Báldi et al. 2013. Agriculture, Ecosystems and Environment; Kormann et al. 2015. Diversity and Distributions; Sutcliffe et al. 2015.
Biodiversity and Conservation; Rösch et al. 2015. Oecologia; Madeira et al. 2016. Agriculture, Ecosystems and Environment.
The fourth chapter (Impact of hedgerow-forest connectivity on biodiversity and ecosystem function) contains two papers focusing on birds, arthropods and pollination in hedgerows. The first paper compares biodiversity patters of farmland vs. woodland birds in hedges isolated from forest, hedges connected to forest and forest edges. The second paper examines the impact of oilseed rape on the pollination of wild plants and bee abundance during and after oilseed-rape bloom, including effects on crop–noncrop spillover at landscape and adjacent field scales. There are four further closely related own papers not detailed in the thesis: Ludwig et al. 2012. Acta Oecologica; Fischer et al. 2013. Journal of Insect Conservation; Haenke et al. 2014. Journal of Applied Ecology;
Schlinkert et al. 2016. Wildlife Biology.
The fifth chapter (Comparing effectiveness of agri-environment management in cropland and grassland) contains two papers focusing on effects of agri-environment management on biodiversity in cropland and grassland. In the first paper the relative effect of management and landscape structure of arthropod communities of alkali lowland plains in Hungary is compared, using the results of two studies with similar sampling effort and study design. The second paper uses a double nested design with paired organic and conventional meadows and organic and conventional wheat fields, and investigates the effects of management, landscape composition and edge effect on plants and arthropods. There is one further closely related own paper not detailed in the thesis: Batáry et al. 2010. Biological Conservation.
The sixth chapter (Landscape moderation and regional differences of biodiversity patterns) contains three papers on large-scale features, such as region and landscape structure, influencing the biodiversity patterns in farmland. The first paper synthesizes the landscape moderation effects on agri-environmental management using a modern quantitative meta-analysis. The second paper deals with differences in farmland biodiversity and nature conservation in Eastern and Western Europe.
The third paper addresses the ecological and economic effectiveness of organic management in two contrasting German regions, i.e. in the small-scale agriculture of Western Germany and the large- scale agriculture of Eastern Germany along the former Iron Curtain. There are couple of further closely related own multiscale papers not detailed in the thesis, e.g.: Kleijn et al. 2009. Proceedings of the Royal Society B; Batáry et al. 2010. Agriculture, Ecosystems and Environment; Tscharntke et al. 2012. Biological Reviews; Marja et al. 2014. Biological Conservation; Liu et al. 2014.
Landscape Ecology; Gonthier et al. 2014. Proceedings of the Royal Society B; Clough et al. 2014.
Ecology Letters; Emmerson et al. 2016. Advances in Ecological Research; Lichtenberg et al. 2017.
Global Change Biology; Bosem Baillod et al. 2015. Journal of Applied Ecology; Rossetti et al.
2017. Ecology Letters; Happe et al. 2018. Agriculture, Ecosystems and Environment; Fischer et al.
2018. Journal of Applied Ecology; Hass et al. 2018. Proceedings of the Royal Society B.
The seventh chapter summarises the findings of the previous chapters and outlines new research avenues.
The thesis consists of three synthesis papers and eight primary research papers listed chronologically bellow:
Batáry, P., Báldi, A. & Erdős, S. 2007. Grassland versus non-grassland bird abundance and diversity in managed grasslands: local, landscape and regional scale effects. Biodiversity and Conservation 16: 871–881. [IF2007: 1,421]
Batáry, P., Kovács, A. & Báldi, A. 2008. Management effects on carabid beetles and spiders in Central Hungarian grasslands and cereal fields. Community Ecology 9: 247–254. [IF2008: 0,898]
Batáry, P., Báldi, A., Kleijn, D. & Tscharntke, T. 2011. Landscape-moderated biodiversity effects of agri-environmental management – a meta-analysis. Proceedings of the Royal Society B- Biological Sciences 278: 1894–1902. [IF2011: 5,415; Web of Science highly cited (top 1%)]
Batáry, P., Holzschuh, A., Orci, K.M., Samu, F. & Tscharntke, T. 2012. Responses of plant, insect and spider biodiversity to local and landscape scale management intensity in cereal crops and grasslands. Agriculture, Ecosystems and Environment 146: 130–136. [IF2012: 2,859]
Batáry, P., Kovács-Hostyánszki, A., Fischer, C., Tscharntke, T. & Holzschuh, A. 2012. Contrasting effect of isolation of hedges from forests on farmland vs. woodland birds. Community Ecology 13:
155–161. [IF2012: 1,623]
Kovács-Hostyánszki, A., Haenke, S., Batáry, P., Jauker, B., Báldi, A., Tscharntke, T. &
Holzschuh, A. 2013. Contrasting effects of mass-flowering crops on bee pollination of hedge plants at different spatial and temporal scales. Ecological Applications 23: 1938–1946. [IF2013: 4,126]
Rösch, V., Tscharntke, T., Scherber, C. & Batáry, P. 2013. Landscape composition, connectivity and fragment size drive effects of grassland fragmentation on insect communities. Journal of Applied Ecology 50: 387–394. [IF2013: 4,754]
Batáry, P., Dicks, L.V., Kleijn, D. & Sutherland, W.J. 2015. The role of agri-environment schemes in conservation and environmental management. Conservation Biology 29: 1006–1016. [IF2015: 4,267; Web of Science highly cited (top 1%)]
Sutcliffe, L.M.E., Batáry, P., Kormann, U., Báldi, A., Dicks, L.V., Herzon, I., Kleijn, D., Tryjanowski, P., Apostolova, I., Arlettaz, R., Aunins, A., Aviron, S., Baležentiene, L., Fischer, C., Halada, L., Hartel, T., Helm, A., Hristov, I., Jelaska, S.D., Kaligaric, M., Kamp, J., Klimek, S., Koorberg, P., Kostiuková, J., Kovács-Hostyánszki, A., Kuemmerle, T., Leuschner, C., Lindborg, R., Loos, J., Maccherini, S., Marja, R., Máthé, O., Paulini, I., Proença, V., Rey-Benayas, J., Sans, F.X., Seifert, C., Stalenga, J., Timaeus, J., Török, P., van Swaay, C., Viik, E. & Tscharntke, T.
2015. Harnessing the biodiversity value of Central and Eastern European farmland. Diversity and Distributions 21: 722–730. [IF2015: 4,566]
Batáry, P., Gallé, R., Riesch, F., Fischer, C., Dormann, C.F., Mußhoff, O., Császár, P., Fusaro, S., Gayer, C., Happe, A.-K., Kurucz, K., Molnár, D., Rösch, V., Wietzke, A. & Tscharntke, T. 2017.
The former iron curtain still drives biodiversity-profit trade-offs in German agriculture. Nature Ecology & Evolution 1: 1279–1284.
Ernst, L.M., Tscharntke, T. & Batáry, P. 2017. Grassland management in agricultural vs. forested landscapes drives butterfly and bird diversity. Biological Conservation 216: 51–59. [IF2016: 4,022]
Technical note: the thesis is based on the above eleven selected papers. Most of them contain supplementary materials, which are often very extensive. In order to keep the thesis relatively concise, the supplementary materials are not presented in the thesis, but are cited. In case of interest, all supplementary materials, including also those not cited in the thesis, but only presented in the original papers, are available electronically on this website: https://sites.google.com/site/pbatary/dsc
2. Role of agri-environment schemes in nature conservation
For this synthesis study we reviewed the history, current use and effectiveness of AES as a conservation tool in Europe. We considered the conceptual framework that has been developed to interpret the ecological findings and the implications of research on the human factors that influence farmer uptake or acceptance of the schemes. We conducted two new meta-analyses to determine whether AES are becoming more effective over time and whether changing management in productive or non-productive areas benefits biodiversity. We also identified outstanding policy- relevant research questions that cannot currently be answered using formal meta-analysis, due to data deficiency. Finally, we considered what can be learned about the use and cost-effectiveness of AES from the European experience.
2.1. History of agri-environment schemes in Europe
Although some north-western European countries had agri-environment programs predating any European regulations, most European AES can be traced back to the Agricultural Structures Regulation of 1985 (European Union EU Regulation 797/85). They were conceived as a mechanism to compensate farmers for loss of income associated with appropriate, less intensive management of environmentally sensitive areas in response to the changes described above and largely driven by a few countries of the north and west (Hodge et al. 2015). In 1987 an amendment (EU Regulation 1760/87) allowed up to 50% of the cost of environmentally sensitive areas to flow from the Common Agricultural Policy, and in 1992 AES became compulsory for all EU Member States (EU Regulation 2078/92). They are one aspect of the Rural Development pillar of the Common Agricultural Policy. Each Member State designs its own schemes. Currently, a diversity of AES exists in the 28 Member States of the EU and in Switzerland and Norway, which are not Member States (Fig. 2.1a). We confined our synthesis to 30 countries rather than the entire continent.
Because they provide income for conservation, AES have become the main tool to conserve biodiversity on European farmland and are often used to fund management in protected areas or designated sites. Within the EU, AES have always been, and remain, voluntary for land managers, although in the latest reform of the Common Agricultural Policy in 2014 certain management practices designed as AES became obligatory for farmers to quality for their basic subsidy (Pe’er et al. 2014).
Agri-environment schemes are important for conserving farmland areas designated by EU countries, Switzerland, and Norway as of “high nature value” (Lomba et al. 2014) in that they preserve genetic diversity of livestock, protect a diversity of agro-ecosystems types, and produce food with a lower environmental and ecological footprint. Many schemes have clear objectives to reduce water pollution, enhance access to the countryside and protect cultural landscapes and heritage, as well as protecting biodiversity. Almost all countries have AES that support organic farmers, based on an underlying assumption that organic farming is good for the environment (Tuck et al. 2014).
The role of AES schemes has shifted over time. Their initial purpose was to protect threatened habitats or landscapes. Over time, the emphasis changed to prevention of species’ loss, especially farmland birds, across agricultural land. More recently, emphasis is shifting to the application of AES to improve and maintain ecosystem services, such as pollination and biocontrol (Ekroos et al.
2014).
Schemes can be classified as horizontal or zonal (i.e., targeted) (Kleijn & Sutherland 2003).
Horizontal schemes usually combine environmental protection with nature conservation objectives and can be applied throughout a country. They are designed to fit easily into farm management systems; they are not too demanding or directly support management farmers are doing anyway, such as organic management. Zonal schemes target areas with high nature value. They generally require bespoke management for target species or ecosystems, and farmers are often obliged to seek expert advice in developing management plans.
Fig. 2.1. (a) Countries in Europe where agri-environment schemes (AES) exists (dark gray). (b) Total realized expenditure spent on AES in 2007-2013 (dark gray) and total realized expenditure spent on AES in 2007-2013 per area under AES (light gray) (no data available for Croatia, Norway, and Switzerland). (c) Utilized agricultural area (UAA) relative to total realized expenditure on AES in 2007-2013. Data for (b) and (c) derived from European Network for Rural Development (2014).
2.2. Big spending for agri-environment schemes
Budgets for AES are substantial and for most countries usually equal or exceed the amounts of money spent on wildlife conservation through other routes. For example, in 2005 the Dutch budget for conservation in protected areas was 48.8 million €, while that for AES with biodiversity objectives was 42.1 million € (MNP 2007). In England, total expenditure on AES, including measures with non-biodiversity objectives, was 375 million €/year from 2007 to 2013 (European Network for Rural Development 2014). The total annual expenditure of the government’s nature conservation agency for England was much lower, around 250 million € in 2013-2014 (Natural England 2014). In new EU member states this difference can be larger. For example, in 2008 the Hungarian budget for nature conservation was roughly 41.0 million € (Hungarian Government 2009), while total expenditure on AES was 117.6 million € (Hungarian Ministry of Agriculture and Rural Development 2009). The European Commission spent 3.23 billion € on AES in 2012, a figure two orders of magnitude higher than the cost of managing Natura 2000 sites (Maiorano et al. 2015) that year, which was 39.6 million € (Pe’er et al. 2014).
The total amount of public expenditure on AES in each EU Member State for 2007-2013, including co-financing at national levels, is strongly correlated with the amount of agricultural land in each country (Fig. 2.1c) (Spearman rank rho = 0.83, p < 0.001), although some countries are relative outliers. Spain and France spend less than would be expected from their agricultural area, while Austria spends more. The proportion of agricultural land under the schemes varies greatly across countries, from 6 % in Denmark to 95 % in Finland. This means the intensity of spending also differs among countries, as illustrated by the amount of money spent per hectare of AES area (Fig. 2.1b); there is a tendency for more focused spending in smaller countries.
Future spending on AES is very likely to be lower in all countries, following reforms of the European Common Agricultural Policy enacted at the end of 2013 (Pe’er et al. 2014). The budget
0 500 1000 1500 2000 2500 3000 3500 4000
DE AT UK IT FR FI ES IE SE PL RO HU CZ GR PT SK BE NL DK LT SI BG EE LV LU CY MT
Total realised expenditure (millions of Euro) Euros/ha
(a) (b)
(c)
for Rural Development Programmes, of which AES are part, will be 18 % less by 2020. Moreover Member States have been given the choice to shift funds out of Rural Development to directly support farmers. In the coming years, differences among countries in AES spending will therefore increase.
2.3. Ecological effectiveness of European agri-environment schemes
Given the huge expenditure on European AES, it is important to ask whether they improve biodiversity outcomes. The first well-designed studies examining the ecological effects of AES were published in the early 2000s. Kleijn and Sutherland (2003) reviewed published peer-reviewed and grey literature on the effectiveness of AES with biodiversity targets and concluded that about half of the schemes lack positive effects on biodiversity. Successful schemes focus mainly on specific (rare) species and are often supervised by scientists or volunteers. Non-targeted schemes to enhance biodiversity usually benefit common species or have no overall impact.
Since that review there has been a wealth of published papers on the subject and a number of important Europe-wide reviews (Bengtsson et al. 2005; Batáry et al. 2011b; Scheper et al. 2013;
Tuck et al. 2014). These demonstrate that AES generally enhance biodiversity locally, usually with modest increases in species richness or abundance of common species. Studies have been mainly of intensively farmed areas; little work has been done on effectiveness of schemes in areas with more extensive agriculture (Kampmann et al. 2012).
Based on these studies a theoretical framework has been developed. The effectiveness of AES at attracting wild species is influenced by landscape structure, land-use intensity, and the ecological contrast created by AES (Kleijn et al. 2011). The hypotheses on the relationship between effectiveness and landscape structure and between effectiveness and ecological contrast have both been confirmed (Batáry et al. 2011b; Scheper et al. 2013; Hammers et al. 2015). In their meta- analysis, Batáry et al. (2011b) found that in cropland areas AES are effective in simplified but not in complex landscapes. This was further confirmed in a meta-analysis on pollinators (Scheper et al.
2013) and by Tuck et al. (2014), who showed that the positive effects of organic farming on biodiversity increased as the amount of cropland increased. However, the suggested relationship between effectiveness and land-use intensity has not been confirmed, possibly because most research has been done in countries dominated by intensive farming, such as the United Kingdom and Germany (Dicks et al. 2013a), and has not specifically incorporated an intensification gradient.
There is almost no evidence yet on whether this attraction of wild species to AES land represents a stabilization and increase of plant and animal populations or a local concentration of these populations with concurrent dilution in other nearby areas (but see Morandin & Kremen 2013).
We addressed two specific issues by merging the data sets of three recent meta-analyses on the effects of AES on species richness (Batáry et al. 2011b; Scheper et al. 2013; Tuck et al. 2014).
We imposed the following restrictions: only studies from the 28 European Member States, Norway, and Switzerland were included; studies were excluded if the number of replicates was fewer than three experimental or control areas; studies performed at plot level (i.e., within-field experiments) were excluded. This resulted in a data set with 284 observations from 103 studies (the entire data set is in Supporting Information of the original paper).
We used the unbiased standardized mean difference (Hedges’ g) as a common effect size in our analyses, originating from the above meta-analyses. Effect size was positive if species richness was higher in the AES than in the control fields. For the error estimate, we used the non-parametric variance estimates of each effect size, which is based on few assumptions and may be less constrained by the assumptions of large sample theory (Hedges & Olkin 1985). We carried out statistical analyses in the metafor package (Viechtbauer 2010) of R. Funnel plots, regressions test for funnel plot asymmetry, and calculated fail-safe numbers all showed no sign of publication bias, either in the entire data set or in the two meta-analyses presented. However, our meta-analyses shared with the three previous meta-analyses a strong geographic bias of study areas towards Northern and Western Europe. This issue was previously highlighted by Tryjanowski et al. (2011) and recently by Sutcliffe et al. (2015). They concluded that new eastern EU Member States had
adopted Western European type AES designed for intensively farmed landscapes. In the extensively farmed areas in the new member states such AES seem to be ineffective or even have negative effects on biodiversity. Therefore, there is a great need for better locally adapted AES.
2.3.1. Effectiveness of schemes over time
The regular reforms of the European Common Agricultural Policy (CAP) allow countries to use novel scientific insights and modify their agri-environmental programs to increase their efficiency.
As a result national agri-environmental programs change substantially every 7 years. Dicks et al.
(2013b) questioned whether scientific evidence was used to improve policy efficiency during the most recent CAP reform. After 25 years of AES in Europe and almost 15 years of high-quality research on their effectiveness, it is possible to ask whether the effectiveness of the schemes has improved as policy experience and scientific evidence accrued over time.
If evidence was being taken into account, findings from studies in the early 2000s, which mostly covered AES implemented in the 2000-2006 budget period or before, would be reflected in the designs of schemes in the 2007-2013 budget periods. This may be expected to result in increased effectiveness in the second budget period. To test this, we used a mixed-effects meta- regression model in which budget period was the moderator variable.
We found that schemes implemented after 2007 were not more effective than schemes implemented before 2007 (Fig. 2.2a, summary statistics is available in Supporting Information of the original paper). Although AES were effective in both periods, there was no sign of improvement in effectiveness over time.
Of course, we cannot conclude directly from this that science is not being used to improve design of the schemes. There are other possible explanations for the lack of improvement over time.
We know that biodiversity is still degrading and agricultural landscapes are still changing in Europe, and both of these could potentially decrease the effectiveness of AES as a result of the reduced pool of species available to colonize and benefit from the scheme. Alternatively, there might be a time-delay effect, meaning that the positive effect of research on AES will appear farther in the future (Weis 2001).
It is unfortunate that there is no evidence yet of AES becoming more effective over time, as such a change might have compensated to some extent for forthcoming reductions in AES budgets (Pe’er et al. 2014). Policy makers might argue that elements of AES, such as field margins left out of production, become obligatory across Europe as “compulsory greening measures” under the direct payments pillar of the Common Agricultural Policy from 2014-2020 and that this would compensate for loss of AES coverage. However, recent analyses of the compulsory greening measures show that effective elements of AES have generally not been incorporated (Dicks et al.
2013b; Pe’er et al. 2014). Rather than being obligatory, the greening measures that are similar to AES (known as ecological focus areas) apply to just over half the farmed area of Europe, due to the exemption of farms of <15 ha of arable land (Pe’er et al. 2014).
Fig. 2.2. Changes in effectiveness of agri- environment schemes over time as shown in studies published from 1984 to 2006 compared with studies published from 2007 to 2009 and (b) differences in species diversity between control areas and areas in production (such as fields under organic management) and areas out of production (such as field margins and hedgerows). Shown are mean effect sizes and 95 % CI. The mean effect size is significantly different from zero, if the CIs do not overlap with zero. Numbers near symbols indicate sample size.
2.3.2. Effectiveness of schemes in productive versus non-productive areas
Agri-environment schemes can be classified according to whether they apply to non-productive areas, such as field boundaries and wildflower strips (sometimes called off-field practices, Garibaldi et al. 2014), or productive areas, such as arable crops or grasslands (sometimes called on-field practices). Schemes targeting non-productive areas include hedgerows, sown or naturally regenerated field margins, or simply taking areas of land out of production for different conservation purposes. We call these out-of-production schemes. In contrast, in-production schemes support environmentally sensitive approaches to the management of land that is used to grow crops or feed livestock. For example, the use of agrochemicals might be reduced or prohibited or certain management actions, such as mowing grassland, might be restricted. The most widespread in- production scheme is organic farming.
In our second meta-analysis, we used a mixed-effects meta-regression model with management type as a moderator variable. We found that out-of-production schemes were much more effective at enhancing species richness than in-production schemes (Fig. 2.2b, summary statistics is available in Supporting Information of the original paper). A possible explanation may be that most of the out-of-production schemes we examined evaluated measures that take agricultural land out of production, such as the establishment of wild-flower strips. The conversion of crop monocultures to semi-natural habitat results in a much larger increase in resource availability (i.e., creates a larger ecological contrast) for a wider range of species than measures such as organic farming, reducing stocking rates, or restricting fertilizer application rates that are typical for in-production schemes. Schemes promoting the establishment of wildflower strips may also be better targeted to the conservation of a given species group than in-production schemes because they often specifically address a resource that is limiting population growth or size (e.g., floral resources for flower visiting insects). Many in-production schemes do not address specific species groups; rather, they aim to enhance biodiversity in general as one of several targets, alongside improvements in other ecosystem characteristics or services.
Targeting the needs and spatial distribution of specific species groups is most likely more important than whether schemes prescribe measures on or off land that is being used for farming.
Targeted schemes tend to be more effective than untargeted schemes (Kleijn & Sutherland 2003;
Wilson et al. 2009), and better spatial targeting of in-production schemes can greatly benefit rare and declining species (Pywell et al. 2012). In many countries, there is a move toward better targeting of AES, either toward particular declining species groups or landscapes where they are likely to be effective,. As this is being incorporated into AES and implemented between now and 2020, one might expect a review similar to this one in 2025 to be able to show an increase in effectiveness of AES over time.
It is important to appreciate that species richness is just one measure of diversity, although this is the one most easily understood and used by policy makers. We think that the importance of this measure is overrated and other variables characterizing biodiversity should be applied in primary studies and analyzed (if sufficient studies are available) in meta-analyses (e.g., the meta- analysis on functional diversity by Flynn et al. 2009). An additional fundamental point is that in- production and out-of-production options typically support different communities. In-production options select for species adapted to the highly disturbed, cropped areas of fields, for example, in contrast to out-of-production options (see the example of arable weeds in Storkey et al. 2012).
2.4. The human factor
In addition to research on the ecological effectiveness of AES, there is a body of work on how to ensure that AES are palatable to farmers and therefore effective at changing farmer behavior. This is important because AES are always voluntary (but see recent CAP reform Pe’er et al. 2014).
Uptake of specific AES options is a key element of their success and does not always correlate with ecological effectiveness. For example, Hodge and Reader (2010) found that the vast majority of options taken up in the first 5 years of entry level stewardship (a horizontal scheme) in England were the straightforward field corner and grass margin options that require little change of
management or resource investment. Evaluation of synthesized evidence shows that these are not the most effective AES options for enhancing biodiversity (Dicks et al. 2013b).
Studies on motivations of farmers to take up AES or environmental management have repeatedly demonstrated that farmer attitudes are important in explaining uptake of environmental measures (e.g., Defrancesco et al. 2008; Sattler & Nagel 2010). As well as the effect of general attitude, scheme adoption is linked to utilitarian motivations, such as payment rate and ease of fit within existing farm practice (e.g., Defrancesco et al. 2008; Sutherland et al. 2010). Many authors have pointed out that AES intended to support biodiversity should be designed with farmer circumstances and attitudes in mind (e.g., Herzon and Mikk 2007; de Snoo et al. 2013), indicating a need for ecologists and social scientists to work together. Herzon and Mikk (2007) found that views of biodiversity among Finnish and Estonian farmers were largely restricted to the realm of wild nature outside the farmed environment. This implies a need to demonstrate to farmers when they can directly benefit from measures to promote functional ecological groups of biodiversity, such as pollinators, natural enemies, or soil biodiversity.
2.5. Future research
2.5.1. Effectiveness of schemes for enhancing ecosystem services
The value of ecosystem services to agriculture has been much discussed recently (e.g., Power 2010;
Kremen & Miles 2012). For some services, such as food production, pest regulation, pollination, and soil nutrient cycling, farmers themselves are direct beneficiaries because their yields and input requirements are directly affected. Other services, such as air and water quality or enjoyment of cultural landscapes, are public goods (i.e., the main beneficiaries are outside the farm business). The role AES can and should play in maintaining ecosystem services is still under discussion. There is a clear mandate for CAP to support delivery of public goods from agriculture (European Commission 2010) but not to support actions that directly increase farm income.
The effectiveness of specific AES options at delivering ecosystem service benefits has only just started to be tested. For example, a small number of studies outside Europe have demonstrated benefits to crop pollination from wildflower strips or patches (Garibaldi et al. 2014), and there is some evidence that vegetated buffer strips can enhance water quality (Zhang et al. 2010). The combined effects of specific AES options on multiple ecosystem services are still poorly understood.
2.5.2. Effectiveness of schemes in agriculturally marginal areas
In Europe agriculturally marginal areas, where the productivity of land is limited by biophysical or socio-economic constraints, are currently home to the highest concentrations of biodiversity and host the largest populations of threatened species (Tryjanowski et al. 2011). Many of them typically occur in new central and eastern Member States (Sutcliffe et al. 2015). These areas are under pressure from agricultural intensification and abandonment. Counteracting farmland abandonment in marginal areas is an important objective of AES in many countries, yet surprisingly few studies have examined the effects of AES on marginal farmland. What limited evidence there is suggests that AES can be very effective on low-intensity farmland. Schemes effectively support threatened birds in low-input cereal steppes in Central Spain (Kleijn et al. 2006), bird richness in environmentally sensitive areas in Hungary (Kovács-Hostyánszki & Báldi 2012), and species-rich plant communities in the Swiss Alps (Kampmann et al. 2012). An illustrative study is done by Weis (2001), in the German Eiffel mountain range, where many low-productive species-rich grasslands had been abandoned or afforested since the late 1960s, but then AES were introduced in 1986 that paid farmers to reintroduce sheep grazing on abandoned grasslands. Weis (2001) compared trends in plant species richness in plots where grazing had recommenced and plots where sheep were kept out. In 1999 species richness in grazed plots had increased by 20 %, while species richness in ungrazed plots had decreased by 17 %. The population size of a range of threatened orchid species increased by 50-500 % in grazed plots. However, it took 8-10 years before the first positive effects became apparent, which may explain why this has been an unpopular research topic. Previous AES
were designed solely to maintain biodiversity (e.g. by reintroducing extensive management) and not to restore it completely (Kleijn et al. 2009), so it was cheaper to execute these schemes in marginal areas than in intensive areas. More studies are needed, however, before general conclusions can be drawn about the effectiveness of AES in agriculturally marginal areas.
2.5.3. Cost-effectiveness of agri-environment schemes
As a conservation strategy, AES focus on reducing the impact of agricultural activities on species that inhabit the agricultural landscape. They are not the only possible route to protect such species.
Another major conservation tool is protected areas, which can also be applied in agricultural landscapes. In some countries, there are protected sites managed as working farms for farmland wildlife (e.g. Moyse 2013). Little is known about the relative efficiency of these different strategies to protect farmland biodiversity.
A notable exception is the case of meadow bird conservation in the Netherlands. In 2008 21 million € was spent on AES targeting meadow bird conservation on large areas of farmland. In the same year, meadow bird conservation in the spatially much more restricted protected areas cost 4 million € (van Paassen & Teunissen 2010). Settlement densities are much higher in protected areas than on farmland with meadow bird schemes, resulting, at the national level, in slightly more meadow birds breeding in protected areas than on farmland with meadow bird schemes (PBL 2009). Furthermore, on average, meadow birds show positive trends in protected areas but negative trends on farmland with meadow bird schemes (van Egmond & de Koeijer 2006). This suggests that, for this particular species group, protected areas are much more efficient than AES. However, it might be that most protected areas in the Netherlands are too small to maintain viable meadow bird populations in the long run, especially when they are bordered by inhospitable high-intensity grasslands or built-up areas that are generally avoided by these ground-nesting birds. So the apparent higher cost-effectiveness might be an illusion, hiding an extinction debt.
The comparison in cost-effectiveness between AES and protected areas is important because both are funded with public budgets and both impact the potential for food production. Investing in one strategy does not necessarily mean there is less money available for the other strategy because the source of funds for AES has a very different underlying purpose – to support farm incomes and generate public goods from agriculture. Even so, cost-effective conservation is of interest to policy makers.
2.5.4. Importance of training and advice to the effectiveness of agri-environment schemes
There has been little research on the link between farmer training or advice and the effectiveness of AES. Farmers are trained in agricultural production and have seldom experienced specific training or education in environmental management. Yet managing land for environmental outcomes requires a different set of skills and knowledge. Zonal AES schemes usually incorporate an element of training or advice. In the UK, zonal schemes are much more beneficial to bird diversity per unit cost than simplified horizontal schemes, despite the fact that a much larger proportion of the funding goes into setting up and checking the implementation rather than directly to farmers (Armsworth et al. 2012).
Horizontal AES often do not incorporate farmer training or advice (but see Marja et al. 2014), and this could be a reason for their relatively low effectiveness. One research project in the UK demonstrated that training farmers increases their confidence and develops a more professional attitude to agri-environmental management (Lobley et al. 2013). The same project also demonstrated ecological benefits; there were more flower or seed resources and higher numbers of bees or birds on AES areas managed by trained farmers relative to untrained farmers (summarized in Dicks et al. 2013a). It has been repeatedly demonstrated that farmer field schools, common in low and middle income countries, enhance uptake of beneficial integrated pest management practices, although the schools do not seem to spread practices through the farming community beyond the attendees (Waddington et al. 2014). Results-oriented AES is another approach with potential to generate long term positive behavioural change by providing incentive for farmers to improve their skills (Burton & Schwarz 2013).
3. Managing species rich grasslands
Species rich grasslands are threatened by both intensification and abandonment since they are economically not effective enough compared to improved grasslands. Thus they heavily rely on support provided by AESs or other related nature conservation schemes. This chapter focuses on insects and birds in different grassland habitats with large extent, namely the Hungarian “puszta”
grasslands, respectively strongly fragmented ones, but likewise species rich, namely German calcareous grasslands and orchard meadows. The overarching idea connecting them is the importance of landscape scale effects, which can be in turn as important as local management action and amplify or neutralize that.
3.1. Grassland versus non-grassland bird diversity in “puszta” grasslands
In this study, our aims were to test the influence of a local factor (grazing intensity), landscape and regional effects on two ecological groups of bird species (grassland and non-grassland birds) and on the most frequent species (Skylark Alauda arvensis, Yellow wagtail Motacilla flava, and Corn bunting Miliaria calandra) of the Hungarian Great Plain. We selected extensively and intensively grazed pastures in three regions of Hungarian Great Plain (those can be categorised as solonchak alkali steppes, solonetz alkali steppes and wet meadows). In the year of the study, in 2003 were the first supports by National AES given to farmers. None of our extensively grazed fields were supported, however, all of them met the requirements of the National AES (Ángyán et al. 1999).
The three regions differ in landscape structure (from simple through intermediate to complex).
3.1.1. Material and methods
Twenty-one pairs of bird census sites were selected on grasslands with high and low grazing pressure in three distinct biogeographic regions of the Hungarian Great Plain. The three regions differ in their landscape structure, although grasslands are the most extensive land-use type (over 60%) in all regions. One of our study areas is situated in the Heves Landscape Protection Area in Eastern Hungary. This region (‘Simple’ region) has the most simple landscape structure with the largest, least fragmented grassland patches and is dominated by mosaic-complex of dry and wet alkali grasslands and marshes on solonetz soil. An other region is situated parallel to the river Danube, in the Kiskunság National Park (KNP), has an intermediate landscape structure, and contains secondary Pannonic alkali steppe vegetation on solonchak soils (‘Intermediate’ region).
The third region (also in the KNP) is more heterogeneous, has several marshy patches and woodlots in the grasslands, so it has the most complex landscape structure (‘Complex’ region). For detailed area description see Báldi et al. (2005).
We established seven pairs of 12.5 ha plots, usually square in shape, in the extensively and intensively grazed grasslands in all regions (altogether 21 pairs of fields). The extensive field and intensive field in a pair had the same soil type and groundwater level and were situated in similarly structured landscapes, therefore the effects of confounding environmental variables were diminished. Cattle density was about 0.5 cows/ha on extensive and >1 cow/ha on intensive fields.
None of the fields were fertilised, cut or re-seeded. The extensive field and intensive field in a pair had the same soil type and groundwater level and were situated in similarly structured landscapes, therefore the effects of confounding environmental variables were diminished. Some of the study fields were not exactly 12.5 ha. In these cases we cut down the hang out piece on a randomly chose side of the larger field, because of the paired study design. This made possible to compare equally sized parts of a pair.
Breeding birds were surveyed using the territory mapping approach (Bibby et al. 1992).
Altogether we made four censuses, two in April and two in May of 2003. Censuses were carried out under good weather conditions (no wind and rain), from sunrise to 9-10 a.m. The extensive and intensive fields of each pair were censused in the same morning by the same observer. The order in which sites were sampled was changed in the consecutive censuses. All observations registered by sight or sound were plotted on maps of the fields. Birds just flying through and not foraging in
flight were excluded from the analysis. Territories were then drawn around complementary observations made during the four visits. Nest sites were allocated to the site where the observation most indicative of a territory was made (e.g. singing or displaying male, actual nests). To draw a territory in the case of breeding birds, we took two observations within about 10-20 m, with exception of late migrants (e.g. Grasshopper Warbler Locustella naevia, where observations occurred only in May. In the case of territories located along the borders of study plots, we counted them, if we got at least one contact within the plot. Species whose territories are larger than the target plots (e.g. great bustard Otis tarda, raptors) or that use the plots for feeding and clearly nested outside them (e.g. some small passerines such as tree sparrow Passer montanus, white stork Ciconia ciconia and corvids) were also mapped. Two occurrences of them meant one territory independently the number of individuals and of their places on the map.
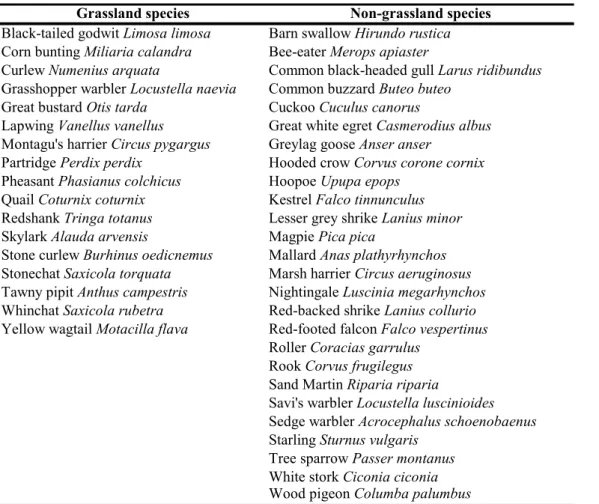
Table 3.1.1. List of grassland and non-grassland species.
We divided the species for habitat specialist and generalist, because specialist species usually react in a different way to factors than generalist species (e.g. Siriwardena et al. 1998; Magura et al.
2000; Imbeau et al. 2003; Virkkala et al. 2004). We considered those species as habitat specialists (i.e. grassland birds), which breed on the ground of grasslands, whereas the remaining was considered as habitat generalist (non-grassland birds) (Table 3.1.1). Our previous analysis on the effect of grazing intensity on birds showed that species richness might increase due to increasing grazing pressure – a rather unexpected result (Báldi et al. 2005). However, this result was based solely on the local scale (grazing effect), and we explained it with the changing landscape structure of study fields. This paper in contrast to the earlier one is based on territories of grassland and non- grassland bird species and not on occurrences of all bird species, uses a pair-wise statistical design and a multi-scale approach, thus more comprehensive.
We used aerial photographs (Institute of Geodesy, Cartography and Remote Sensing; Air project 2000; 0.5 m/pixel resolution) from the study fields to digitise land-use types. First we searched the middle point of the 12.5 ha field and around this centre we used a buffer of 500 m
Grassland species Non-grassland species
Black-tailed godwit Limosa limosa Barn swallow Hirundo rustica Corn bunting Miliaria calandra Bee-eater Merops apiaster
Curlew Numenius arquata Common black-headed gull Larus ridibundus Grasshopper warbler Locustella naevia Common buzzard Buteo buteo
Great bustard Otis tarda Cuckoo Cuculus canorus
Lapwing Vanellus vanellus Great white egret Casmerodius albus Montagu's harrier Circus pygargus Greylag goose Anser anser
Partridge Perdix perdix Hooded crow Corvus corone cornix Pheasant Phasianus colchicus Hoopoe Upupa epops
Quail Coturnix coturnix Kestrel Falco tinnunculus Redshank Tringa totanus Lesser grey shrike Lanius minor Skylark Alauda arvensis Magpie Pica pica
Stone curlew Burhinus oedicnemus Mallard Anas plathyrhynchos Stonechat Saxicola torquata Marsh harrier Circus aeruginosus Tawny pipit Anthus campestris Nightingale Luscinia megarhynchos Whinchat Saxicola rubetra Red-backed shrike Lanius collurio Yellow wagtail Motacilla flava Red-footed falcon Falco vespertinus
Roller Coracias garrulus Rook Corvus frugilegus Sand Martin Riparia riparia
Savi's warbler Locustella luscinioides Sedge warbler Acrocephalus schoenobaenus Starling Sturnus vulgaris
Tree sparrow Passer montanus White stork Ciconia ciconia Wood pigeon Columba palumbus
radius. We digitised the following land-use types: 1) grasslands; 2) arable fields; 3) forests; 4) built- up areas; 5) marshes, reeds and bogs and 6) ditches, streams and lakes. Area percentages, mean areas and patch densities were measured for land-use types within the buffer. Further we also measured the total length of boundaries within buffers. All fields were situated only on grasslands and did not contain boundaries inside at all.
We analysed the local effect (extensive or intensive grazing regime), the effect of landscape and region and the interaction between management and landscape on the species number and on the abundance of grassland and non-grassland bird species in linear mixed models with the Restricted Maximum Likelihood method. To control for confounding effects of region on landscape influences (regions were selected based on their landscape structure, but differed also in soil type and vegetation structure), we built models with and without landscape factors. As landscape variable the total length of all boundaries was used, which reflects well the landscape complexity of the three regions (mean of total length of all boundaries within 500 m buffer areas in ‘Simple’
region: 4.74 km; in ‘Intermediate’ region: 6.25 km; in ‘Complex’ region: 8.53 km). The cause, why this variable was used is that the amount of boundaries or edges is one of the most important factors determining the nest success of ground nesting birds (Batáry & Báldi 2004). This landscape variable correlates with most other important landscape metrics – e.g. positively with total patch density (r42 = 0.895, p = 0.001), negatively with area and percent of grassland (r42 = –0.810, p = 0.001 and r42 = –0.475, p = 0.001) and positively with habitat diversity (r42 = 0.454, p = 0.003).
Models contained only management, landscape, region and interaction between management and landscape as fixed factors and pair as random factor. Further we used the same models for the most abundant species, namely for Skylark, Yellow wagtail and Corn bunting as well. In the case of two latter species, data of one region was not included in the models, because both species occurred nearly only in two regions (for Yellow wagtail the ‘Intermediate’ region, for Corn bunting the
‘Simple’ region was not included into the models).
Table 3.1.2. Linear mixed models on the effects of management (intensive vs. extensive grazing [M]), of landscape (total length of boundaries in surrounding landscape [L]) and of region [R] on bird communities and species of Hungarian grasslands. Model 1 contains management and region, whereas in model 2 landscape and management × landscape interaction were included.
3.1.2. Results
Overall 748 bird territories belonging to 43 species were recorded at the 42 study sites. Intensively and extensively grazed fields had nearly the same species richness (13 grassland and 22 non- grassland species on intensively grazed grasslands, while 14 grassland and 22 non-grassland species on extensively grazed grasslands).
Investigating management (extensive vs. intensive grazing) and regional effects on species richness, we showed both effects on grassland birds, but no effect on non-grassland birds (Table 3.1.2). The species richness of grassland birds was significantly higher on extensively grazed fields, and the ‘Intermediate’ region proved to be the most species rich. When we included landscape (total length of boundaries) in the models, no effect was found either on grassland or non-grassland birds (Table 3.1.2).
F p F p F p F p F p F p
Species richness
Grassland species 6.936 0.016 4.338 0.029 0.419 0.524 0.135 0.716 2.548 0.103 0.088 0.770 Non-grassland species 1.337 0.261 0.481 0.626 0.098 0.758 2.120 0.154 1.281 0.299 0.006 0.940 Territories
Grassland species 40.030 0.001 1.492 0.251 7.613 0.012 4.671 0.038 0.492 0.619 0.215 0.647 Non-grassland species 1.333 0.262 0.119 0.888 0.001 0.984 1.427 0.240 0.557 0.581 0.189 0.667
Skylark 9.033 0.007 11.354 0.001 9.734 0.005 5.088 0.030 8.154 0.003 4.534 0.045
Yellow wagtail 11.039 0.003 1.616 0.510 0.913 0.350 2.402 0.132 2.306 0.157 0.346 0.562
Corn bunting 1.174 0.294 0.325 0.616 7.499 0.014 1.937 0.178 0.044 0.840 10.470 0.005
Model 1 Model 2
M R M L R M x L
Fig. 3.1.1. (a) Mean territory number of grassland and non-grassland bird species of intensively and extensively grazed grasslands of Hungarian Great Plain (n = 42 fields); bars show 1 SE. (b) Correlation between the total length of boundaries (km) and mean territories of grassland bird species on differently managed grasslands. Dashed line indicates correlation for intensive fields, while continuous line indicates correlation for extensive fields.
Abundance of grassland species was higher on extensive than on intensive fields (Table 3.1.2;
Fig. 3.1.1a), in contrast to the abundance of non-grassland species. In the case of grassland birds, management effect was shown in both models (with and without including landscape). Further, investigating the significant landscape effect, the abundance of grassland species was negatively related to total length of boundaries (Table 3.1.2; Fig. 3.1.1b; intensive fields: r21 = –0.328, p = 0.146; extensive fields: r21 = –0.462, p = 0.035). No effect of region and no interaction effect were found on the abundance of grassland and non-grassland bird species.
Fig. 3.1.2. Mean individual number of the most abundant grassland bird species on Hungarian grasslands. Landscape complexity increases from the ‘Simple’ region to ‘Complex’ region. Filled bars indicate extensive grazing, open bars indicate intensive grazing. (a) Skylark, (b) Yellow wagtail, (c) Corn bunting.
At the species level, the effect of management was significant for the commonest species, the Skylark (in both models), which was more abundant on the extensive fields in all regions (Table 3.1.2; Fig. 3.1.2a). Additionally, Skylark abundance was also negatively related to total length of boundaries and occurred more frequently in the ‘Simple’ and ‘Intermediate’ region than in the
‘Complex’ region (Table 3.1.2; Figs 3.1.2a and 3.1.3; intensive fields: r21 = –0.456, p = 0.038;
extensive fields: r21 = –0.713, p = 0.001). The effect of management and landscape on Skylark abundance was also manifested by a significant interaction between management and landscape – Skylark abundance was more sensitive to boundary length on extensively grazed fields than intensive fields (Fig. 3.1.3). In the case of two other frequent species management effects were
Skylark
0 5 10 15 20 25 30
Simple Intermediate Complex Intensive Extensive
Yellow wagtail
0 2 4 6 8 10 12
Simple Intermediate Complex Intensive Extensive
Corn bunting
0 1 2 3 4
Simple Intermediate Complex Intensive Extensive
(a) (b) (c)
(a) (b)
0 5 10 15 20 25 30
Grassland species Non-grassland species Mean number of territories Intensive
Extensive