Small GTPases 4:2, 90–101; April/May/June 2013; © 2013 Landes Bioscience
RESEARCH PAPER
*Correspondence to: Erzsébet Ligeti; Email: ligeti@puskin.sote.hu Submitted: 10/10/12; Revised: 11/25/12; Accepted: 01/22/13 http://dx.doi.org/10.4161/sgtp.23708
Introduction
Reorganization of the actin cytoskeleton, focal adhesions, vesicle trafficking, cell movement and immunological processes such as phagocytosis or production of reactive oxygen species have fine temporal and spatial regulation by Rho family GTPases.1-3 As molecular switches, small G-proteins are able to bind GTP, which turns them to an active state. After a slow hydrolysis of the terminal phosphate of GTP they go to an inactive, GDP- bound form. These processes are regulated by 3 types of pro- teins: guanine nucleotide exchange factors (GEFs), guanine nucleotide dissociation inhibitors (GDIs) and GTPase acti- vating proteins (GAPs).4,5 GEFs facilitate the dissociation of GDP from GTPases thereby promoting the binding of GTP.6 GDIs maintain small G-proteins in the GDP-bound, inactive state and regulate their subcellular distribution.7 GAPs increase the endogenous GTPase activity of small G-proteins up to five orders of magnitude thereby inactivating them.4,8 GAPs are vital in termination of biological signals9 but there are examples where inhibition of constitutive GAP activity significantly contributes to activation processes.9,10
The Ras superfamily contains more than a hundred small G-proteins which are classified into 5 subfamilies.11 One of them is the Rho family including the well-known members Rac, Rho and Cdc42 that are regulated by about 70 potential GAPs.5,12 The common catalytic domain of Rho family GAPs is approx.
150 amino acids in length and consists of 9 α-helices. It con- tains a conserved arginine which is responsible for the catalytic
Rho family small GTPases are involved in the spatio-temporal regulation of several physiological processes. They operate as molecular switches based on their GTP- or GDP-bound state. Their GTPase activator proteins (Rho/Rac GAPs) are able to increase the GTP hydrolysis of small GTPases, which turns them to an inactive state. This regulatory step is a key element of signal termination. According to the human genome project the potential number of Rho family GAPs is approximately 70. Despite their significant role in cellular signaling our knowledge on their expression pattern is quite incomplete. In this study we tried to reveal the tissue-distribution of Rho/Rac GAPs based on expressed sequence tag (EST) database from healthy and tumor tissues and microarray experiments. Our accumulated data sets can provide important starting information for future research. However, the nomenclature of Rho family GAPs is quite heterogeneous. Therefore we collected the available names, abbreviations and aliases of human Rho/Rac GAPs in a useful nomenclature table. A phylogenetic tree and domain structure of 65 human RhoGAPs are also presented.
In silico tissue-distribution of human Rho family GTPase activating proteins
Roland Csépányi-Kömi,1 Dávid Sáfár,1 Veronika Grósz,1 Zoltán László Tarján2 and Erzsébet Ligeti1,*
1Department of Physiology; Semmelweis University; Budapest, Hungary; 2Institute for Veterinary Medical Research; Centre for Agricultural Research; Hungarian Academy of Sciences; Budapest, Hungary
Keywords: Rho family GAPs, nomenclature, expressed sequence tag, microarray, expression profile, domain structure
activity.13 Rho/Rac GAPs are also characterized by varied non- catalytic domains which suggest their complex regulation, their specific localization in molecular complexes and their specific role in signaling pathways.14 Several physiological func- tions are known to be regulated by Rho family GAPs such as embryogenesis,15,16 neural development,9,17 cytokinesis and differentiation.18,19 Lack of several Rho/Rac GAPs results in remarkable phenotype indicating their vital role in cellular regulation.9,20
The large number of Rho family GAPs raises the question of whether they show tissue-specific expression or they are characterized by overlapping tissue-distribution. The aim of the present study was to identify as many Rho family GAPs as possible and to investigate their tissue-distribution. However, GAP domain-containing proteins have very diverse nomencla- ture which makes their identification difficult. In the case of Arf family GAPs, a consensus nomenclature has been agreed,21 but no similar attempt has been made for Rho/Rac GAPs. In this study we first prepared a similar nomenclature table for 75 human Rho family GAPs containing the official names and other aliases used in previous studies and abbreviations from different databases. As additional information we pres- ent the pylogenetic tree and the domain structure of 65 human RhoGAPs. Subsequently we analyzed the tissue-distribution of 54 GAPs in healthy and in cancerous tissues based on expressed sequence tag (EST) database and finally we show the tissue- expression of 45 human Rho family GAP genes in microarray database.
RESEARCH PAPER RESEARCH PAPER
Results
Nomenclature of human Rho family GAP genes. The nomen- clature of the approximately 70 Rho/Rac GAP proteins is quite diverse. Some well-known members (ABR, BCR, p190RhoGAP) are mostly cited with their conventional names; however, the dif- ference between the original and the conventional names might lead to confusion. For this reason we generated a nomenclature table containing 75 potential Rho family GAP genes. Each GAP has several names of which only one full name and one abbrevia- tion are approved as official by the HUGO Gene Nomenclature Committee (HGNC) (Table S1, columns 1 and 2). The third column of the table contains the names and symbols, which were withdrawn by HGNC. In addition, the table shows the predicted protein length and the chromosomal localizations.
We also indicated the most commonly used identification num- bers as the RefSeq Transcript ID, the Ensembl Gene ID, and the Entrez Gene ID from NCBI, the KIAA Number and FLJ Number. The last column of the table contains the other symbols and aliases which are also found in publications (Table S1). The HGNC database contains the official names only of 67 Rho/Rac GAPs. The other 7 genes were withdrawn and the gene ID of DKFZP434A1010 was replaced. These 8 genes are only indicated using the ID from the article of Bernards.12
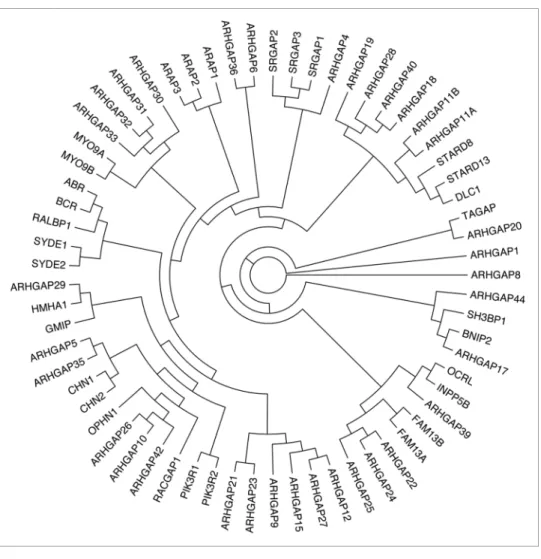
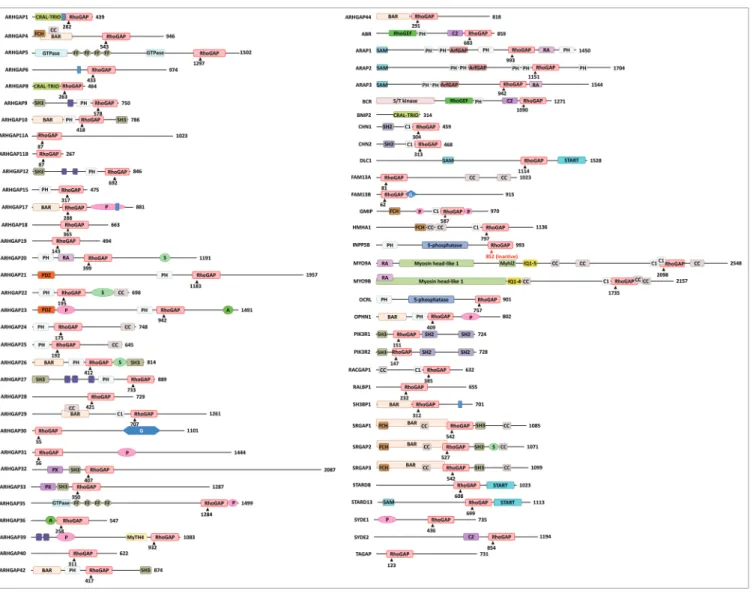
Based on the amino acid sequence of the GAP domain, we prepared a phylogenetic tree of 65 human Rho/RacGAPs (Fig. 1) and the domain structure of these 65 GAPs was drawn (Fig. 2).
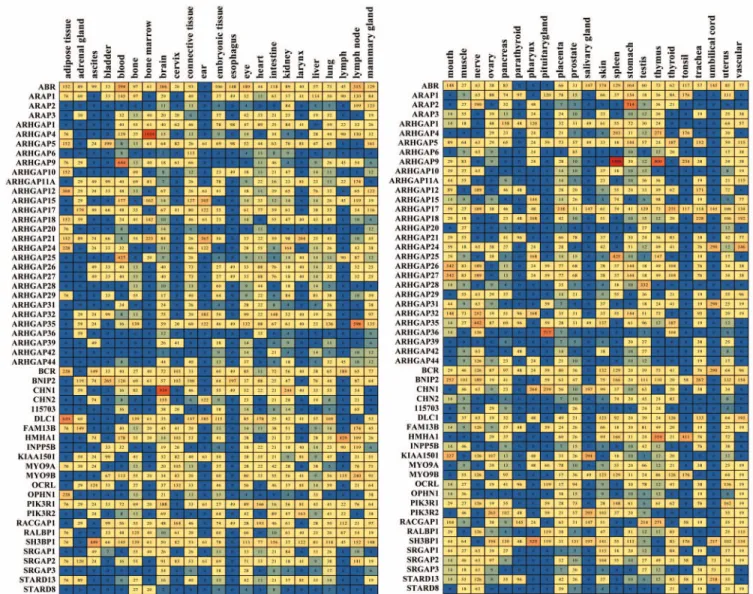
Expression profile of human Rho/Rac GAPs based on EST database. We identified 54 human Rho family GAPs in the EST database. Their frequency of appearance in the analyzed tissues is presented in a color table containing the identified GAPs and 45 different healthy tissue types (Table 1). This frequency is propor- tional to the expression levels and was symbolized with a color- coded scale from dark blue to red colors. Warm colors represent high expression frequencies and cold colors represent low mRNA levels.
Analyzing the different tissue types, it is remarkable that all investigated tissues express multiple GAPs. The largest num- ber (more than 50) of different GAPs was found in the brain, eye, kidney, lung, placenta, testis and uterus. The other tissues express Rho/Rac GAPs at a moderate or lower number; however even the lowest expression amounts to 9 different GAPs in the umbilical cord (Table 1). Interestingly, there are only few tissues that express one specific GAP at prominent frequency: on our numerical scale only 10 tissues express a GAP at a level higher than 500 TPM and the value of 1000 is reached only in two tis- sues (ARHGAP4 in bone marrow and ARHGAP9 in the spleen) (Table 1).
Investigating the individual GAPs, ABR, BCR and SH3BP1 are the most ubiquitously expressed (in 40 or more tissues). A remarkably widespread appearance was observed also in the case of ARHGAP5, ARHGAP17, BNIP2, GRLF1 and PIK3R1 that are expressed in 36 to 39 tissues. In contrast to the ubiquitous GAPs, there are several GAPs with more specific expression.
ARHGAP36 is present only in 11 of the 45 examined tissues;
however, it reaches very high level in the pituitary gland. ARAP2
was found only in 17 tissues but showed very high frequency in the stomach. HMHA1 is lymph-specific, and ARHGAP9 and ARHGAP25 were found in the blood and spleen in high fre- quency, with ARHGAP9 reaching the peak expression frequency among all investigated Rho family GAPs (Table 1).
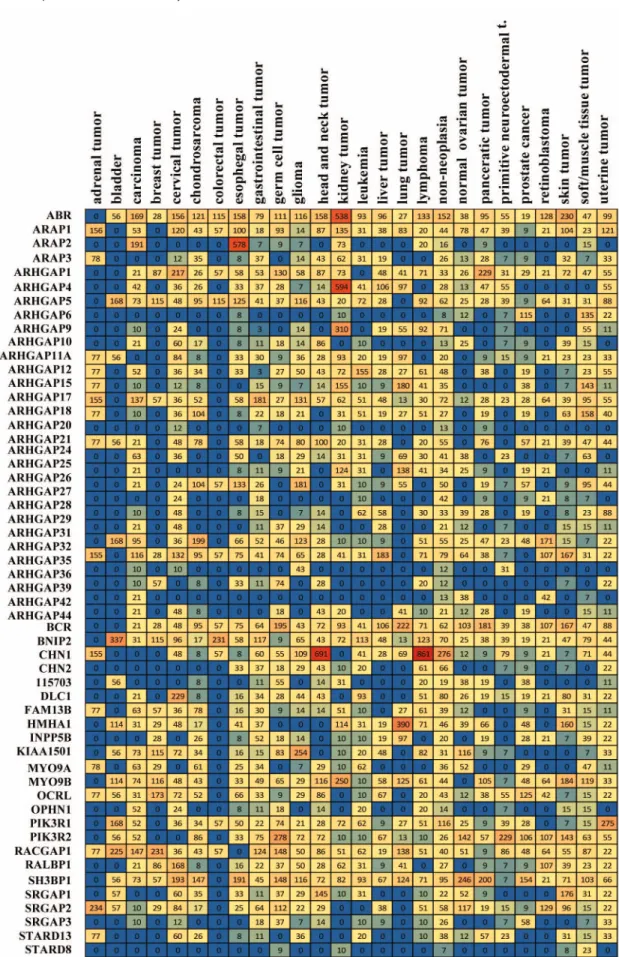
Human Rho/Rac GAPs in cancer tissues. We also investi- gated the EST-cancer database to reveal the approximate amount of human Rho family GAPs in cancer tissues. We observed that the GAP-frequency was very diverse in the 26 tumor tis- sues (Table 2). Most of the 54 investigated GAPs are widely present and are represented with high frequency. However, ARHGAP20, ARHGAP36, ARHGAP39, ARHGAP42 and STARD8 showed very low expression frequency in each tissue.
Interestingly, ARAP2 is specific for esophageal tumor (Table 2), which may be associated with its high amount in the stomach (Table 1). In contrast, ARHGAP4 and ARHGAP9 show signifi- cant expression in kidney tumor (Table 2), whereas the healthy kidney expresses these genes in low amount (Table 1). CHN1 showed extremely high frequency in head and neck tumors and in lymphomas. Investigating the different tissues we found that adrenal tumor, bladder, breast tumor and colorectal tumor con- tain the least amount of Rho family GAPs. In kidney tumor ABR, ARHGAP4, ARHGAP9 and MYO9B are the dominant GAPs. The other tumor tissues express Rho/Rac GAPs in aver- age amount (Table 2).
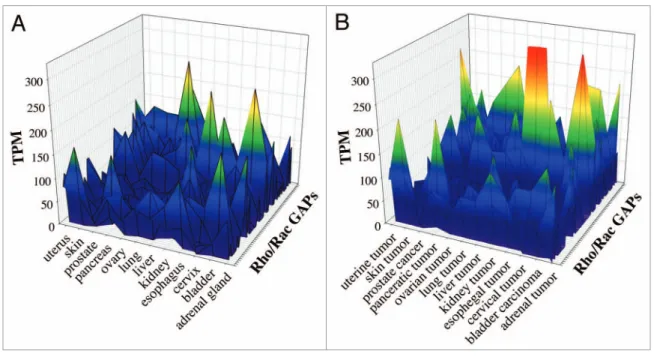
Comparative analysis of EST data from healthy and tumor tissues. We compared the data of 53 human Rho/Rac GAPs from 12 healthy and tumor tissues. We selected the tissues that were clearly equivalent in the 2 EST data sets. Color-coded scale was used to represent the expression frequency of the individual GAPs. In the EST data from healthy tissues we found 11 GAPs, which showed remarkable expression frequency (from green to red colors). The other GAPs have low expression, which is shown in blue color (Fig. 3A). In the equivalent tumor tissues we observed increased GAP frequency compared with healthy tissues (Fig. 3B). We found approximately 20 GAPs, which were characterized with marked expression frequency (green to red colors) and 3 GAPs exceeded the 250 TPM value (Fig. 3B) whereas in the healthy tissues the maximal TPM value was less than 250 (Fig. 3A).
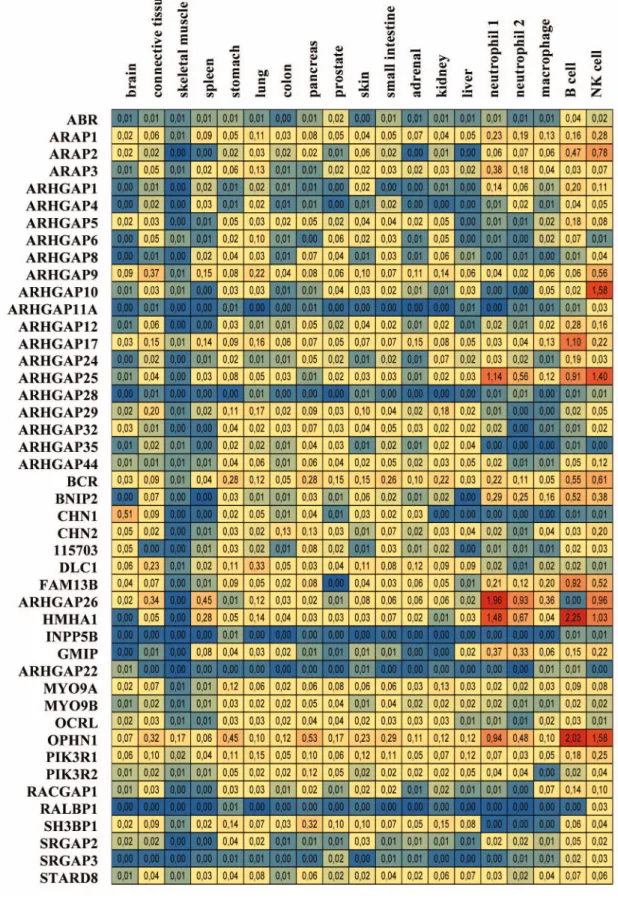
Expression profile of human Rho family GAPs based on microarray database. We identified 45 human Rho/Rac GAP genes in different public microarray databases. Their expression level (normalized to GAPDH expression) is shown in 14 healthy tissues and in 5 different leukocyte cell types (Table 3). The expression values were represented with a color code similar to the EST tables. Blue color shows the low mRNA level and red color indicates the high expression. Moderate expression levels are symbolized with intermediate colors. Evaluating the table we found, that several GAPs are present in most of the investigated tissues. BCR, ARAP1, PIK3R1, ARHGAP9 and MYO9A and B show moderate expression in all tissues and cell types. OPHN1 is also present in all tissues; however, its mRNA level is extremely high in B cells and NK cells. The widely expressed ARHGAP17 also shows dominant mRNA level in B cells. ARHGAP10, ARHGAP25, ARHGAP26 and HMHA1 are mainly present
in leukocytes; however, ARHGAP26 is not expressed in B cells.
RALBP1, ARHGAP11A, SRGAPs, ARHGAP28, ARHGAP22 and INPP5B are not present in the investigated tissues and cells (Table 3). From all investigated tissues, skeletal muscle contains the least amount of GAPs. The other tissues have variable GAP repertoire. In white blood cells, the mRNA level of leukocyte- specific GAPs is very high, but the cells express average number of different Rho/Rac family GAPs (Table 3).
We analyzed separately the two neutrophil samples (GSM90843 and GSM90844) and we observed high correla- tion between the two parallel samples. After linear regression the R square was 0.9744684774 (Fig. 4), Pearson Correlation Coefficient was 0.987 (p = 6.921E-036) and Spearman Correlation Coefficient was 0.913 (p = 0.0000002). The good correlation between the two parallel samples supports the cred- ibility of the data.
Correlation analysis of EST and microarray data. The iden- tical tissues and Rho/Rac GAPs found both in EST and micro- array data sets were collected and we calculated the correlation between the 2 different databases. We examined 41 GAPs and 12 tissues and we indicated both the Pearson and the Spearman
Correlation coefficients in Table 4. Significant correlation was found in the brain, in the spleen and in the adrenal. In the case of lung only the linear dependence was significant which was rep- resented by the Pearson correlation coefficient (Table 4). In the case of the other 9 tissues, we found no significant correlation.
Figure 5 shows the linear regression between the EST and micro- array data. We identified good relationship between the two data sets in the brain (r2 = 0.82293); however, no statistically signifi- cant linear relationship was obtained in the other tissues (Fig. 5).
Discussion
The HUGO Gene Nomenclature Committee proposes to assign only one name and one abbreviation to each gene. It is recom- mended, because it simplifies the database- and literature search.
It is worth to note that most of the computer databases (e.g., EntrezGene) search in their stored data using the HGNC nomen- clature. However, in the case of Rho family GAPs, the most com- monly used name is not always the same as the official name.
Highlighting an example, the widespread name of GRLF1 (the official name is ARHGAP35 according to HGNC) is p190A.
Figure 1. Phylogenetic tree of human Rho family GAPs. Partial protein sequences (~100 aa) of the GAP domain of 65 human Rho/Rac GAPs were aligned with ClustalW. Reconstruction of the unrooted tree was performed with distance matrix analysis on Mobyle portal in the following order:
PROTDIST (Categories model) followed by FITCH (Global rearrangements).
Searching for GRLF1 in NCBI PubMed database (www.ncbi.
nlm.nih.gov/pubmed/) results in 108 findings containing also recent articles such as the one published in 2012 February.22 In contrast, searching with the term “p190A” gives only 14 results and the article of Warren et al.22 is among the many references that do not show up. Interestingly, searching for its official name ARHGAP35 gives 69 results. This makes it indispensable to standardize the nomenclature of human Rho family GAPs. Our compiled table proposes a common nomenclature for 67 GAPs according to HGNC and provides additional helpful information for database search. We also found 8 Rho family GAPs identi- fied by A. Bernards,12 which have no official HGNC name yet (Table S1).
The large number of Rho family GAPs suggests that different tissue- and cell-types express their own GAP repertoire. This is
substantiated by the complex domain structure of the individual GAPs, which allows their specific regulation and participation in large molecular complexes. However, only scarce information is available on the tissue distribution of GAPs. To reveal the expres- sion of human Rho family GAPs in different tissues, we started to analyze EST and microarray databases (Tables 1–3). Our find- ings significantly extend the existing knowledge. For example, previous studies identified p250GAP (see ARHGAP32 in our tables), which is specific for neuronal tissues.23,24 In agreement with these data, we found the highest expression of ARHGAP32 in nerve tissue, but we also observed high expression frequency in the bladder, ear, eye, mammary gland or in the stomach (Table 1). BCR was shown to play important role in the regu- lation of synaptic Rac1 activity, in the development of the ves- tibular apparatus25,26 and in immunological processes such as the
Figure 2. Domain structure of human Rho/Rac GAPs. Abbreviations for domains are as follows: A, alanine-rich; BAR, Bin/amphiphysin/Rvs; C1, cysteine-rich phorbol ester binding; C2, calcium-dependent lipid binding; CC, coiled-coil; CRAL-TRIO, cellular retinaldehyde and TRIO domain; FCH, Fes/CIP4 homology; FF, contains two conserved phenylalanine residues; G, glutamine-rich; IQ, calmodulin-binding motif; Myhl2, myosin head-like 2;
MyTH4, myosin tail homology 4; P, proline-rich; PDZ, protein binding site; PH, pleckstrin homology; PX, Phox homology; RA, Ras association (RalGDS/
AF-6) domain; S, serine-rich; S/T kinase, serine/threonine kinase; SAM, sterile α motif; SH2, Src Homology 2; SH3, SRC Homology; 3START, StAR-related lipid transfer; WW, two highly conserved tryptophans (in purple). Arrowheads with numbers indicate the position of the catalytic arginine residue in the RhoGAP domain. SH3-binding domain (in blue).
regulation of the activity of the phagocytic NADPH oxidase27 and controlling macrophage functions.28,29 In accordance with these reports, high expression frequency for BCR was found in the blood, in the brain, in the spleen and in the lymph node (Table 1). However, our data indicate that BCR is a ubiquitous protein present in high amount also in the adipose tissue, in the skin (Table 1) and in B and NK cells (Table 3). We pre- viously described ARHGAP25 as the regulator of phagocytosis in human neutrophils.30 In silico data suggested that this GAP is present in high amount in the blood, in the spleen (Table 1) and in hematopoietic cells (Table 3). We confirmed these data by Northern and western blot analysis. This finding helped us to reveal the physiological function of ARHGAP25.
However, comparative analysis of EST and microarray data revealed the conceptual differences between these data sets. EST indicates how many times can be detected a gene in a tissue type which means the expression frequency of the gene in the inves- tigated tissue, disregarding of the expression level.31 In contrast,
microarray data provide information on the real mRNA amount using a hybridization method. We found, that in the case of human Rho/Rac GAPs the two databases are not equivalent. We observed good correlation between EST and microarray only in the brain, in the spleen and in the adrenal. For the other tissues we found no correlation (Fig. 5; Table 4). Within one database or between similar databases data are well comparable, as dem- onstrated by the example of the two separate samples from neu- trophils (Fig. 4). However, as our data demonstrate, EST and microarray databases provide different type of information and should be regarded as complementary source of information.
Analysis of healthy and tumor tissues from EST revealed that the expression frequency of some GAPs was increased in tumor tissues (Fig. 3). The role of Rho family small G-proteins and GAPs in cancer phenotype and in tumor cell migration has been documented.32-36
Taken together, in this study we suggest the application of a common nomenclature for 67 human Rho family GAPs according
Table 1. Expression profile of human Rho family GAPs based on EST database
Expression levels are indicated with color scale, which is proportional to transcript per million values indicating by numbers. Blue, low expression; red, high expression.
Table 2. Expression profile of human Rho family GAPs based on EST tumor database
Expression levels are indicated with color scale, which is proportional to transcript per million values indicating by numbers. Blue, low expression; red, high expression.
Table 3. Expression profile of human Rho family GAPs based on EST tumor database
Expression levels are indicated with color scale. Blue, low expression; red, high expression. Numbers show the mRNA amounts normalized to GAPDH (see also Materials and Methods).
Figure 4. Correlation between two parallel neutrophil samples from microarray data. GSM90844 and GSM90843 samples were analyzed by linear regression. R square is indicated. Pearson Correlation Coefficient
= 0.987, p = 6.921E-036. Spearman Correlation Coefficient = 0.913, p = 0.0000002.
Figure 3. Comparative analysis of healthy and tumor tissues from EST database. We investigated 53 human Rho family GAPs and 12 equivalent tissues from both healthy and tumor databases. (A) shows the healthy tissues, and (B) shows the tumor tissues. The transcript per million (TPM) values are indicated with color-coded scale. Blue color correlates with the low TPM values, which show the low expression frequency of GAPs. Warm colors are proportional to higher expression frequencies.
to HGNC. In order to make data-mining easier, we collected the abbreviations, names, symbols, and other IDs used until now.
We also assembled the expression profiles of these genes accord- ing to EST database and microarray experiments, which can be helpful to identify GAPs in hitherto unknown tissue-specific function.
Materials and Methods
Nomenclature of human Rho family GAPs. The identification of the potential Rho/Rac GAPs was based on previous data12 and available public databases (Table 5). The table contain- ing the nomenclature information (Table S1) was prepared by Microsoft® Office Excel® 2007 SP2 software.
Phylogenetic analysis. The amino acid sequences of 65 human RhoGAP domains from UniProt/Swissprot (http://www.uni- prot.org) were aligned and edited applying the ClustalW program incorporated to MEGA5 software using Gonnet protein weight matrix. Distance matrix analysis was performed with Mobyle portal (mobyle.pasteur.fr/cgi-bin/portal.py) in the following order: PRODIST (Categories amino acid substitution model) followed by FITCH (Global rearrangements). Phylogenetic tree was visualized and edited by FigTree v1.3.1.
EST database search. Expressed sequence tag (EST) database is a cDNA library that contains short sequences of different genes and is used to identify gene transcripts.31 Transcript per million (TPM) values of EST provide information about the frequency of genes in different tissues and represent the approximate expres- sion levels of the investigated genes. EST profiles of 54 human Rho family GAP genes (http://www.ncbi.nlm.nih.gov/unigene)
were searched and analyzed. TPM values were sorted by body sites and by health state (healthy vs. tumor tissues) and were sum- marized in color-scaled tables. The initial point of the scale bar, which was labeled with blue color, is the minimum TPM value of the table. The maximum value of the table that summarizes data of healthy tissues is 1498 whereas the maximum TPM value for tumor tissues is 861. These were set as the end points of the scale bars and labeled with red. The intermediate TPM values were
experiments GDS1209 (http://www.ncbi.nlm.nih.gov/sites/
GDSbrowser?acc=GDS1209)37,38 and GSE3982 (http://www.
ncbi.nlm.nih.gov/geo/query/acc.cgi?acc=GSE3982)39 were performed with Affymetrix Human Genome U133A array and were obtained from PubMed GEO DataSets database (http://www.ncbi.nlm.nih.gov/gds). Two separate experiments labeled with the intermediate colors. Tables and scale bars were
prepared using Microsoft® Office Excel® 2007 SP2 software.
Microarray database search. Compared with EST, micro- array database contains individual experiments prepared with DNA chip array technique and gives information about the real expression levels of the investigated genes. The analyzed
Figure 5. Correaltion between EST and microarray data. We analyzed 12 equivalent tissue types and 41 GAPs from both databases. R square calculated with linear regression is indicated. Correlation coefficients and p values are found in Table 4.
microarray data was prepared by Microsoft® Office Excel® 2007 SP2 software.
Statistical analysis. Correlation analysis was performed with SigmaPlot 11.0 software. Correlation coefficients and p values were calculated using the Pearson Product Moment Correlation
Table 5. Sources of abbreviations and aliases of human Rho/Rac GAPs
Original source (abbreviation) Link
Approved symbol HUGO Gene Nomencature Committee (HGNC) http://www.genenames.org/
Approved name HUGO Gene Nomencature Committee (HGNC) http://www.genenames.org/
Previous symbols HUGO Gene Nomencature Committee (HGNC) http://www.genenames.org/
Sequence lenght (amino acids) UniProt Protein Knowledgebase (UniProt KB) http://www.uniprot.org/
Chromosomal location HUGO Gene Nomencature Committee (HGNC) http://www.genenames.org/
RefSeq Transcript ID National Center for Biotechnology Information (NCBI) http://www.ncbi.nlm.nih.gov/gene/
Ensembl Gene ID Ensembl Genome Browser http://www.ensembl.org/index.html
Entrez Gene ID National Center for Biotechnology Information (NCBI) http://www.ncbi.nlm.nih.gov/gene
KIAA Number Kazusa cDNA Sequencing Project http://www.ihop-net.org/UniPub/iHOP/
FLJ Number NEDO Human cDNA Sequencing Project http://www.ihop-net.org/UniPub/iHOP/
Other aliases Information Hyperlinked Over Proteins (iHOP) HUGO Gene Nomenclature Committee (HGNC), GeneCards
http://www.ihop-net.org/UniPub/iHOP/
http:// www.genenames.org/
Table 4. Correlation between EST and microarray data
Tissue type Parameters calculated Pearson product moment correlation Spearman rank order correlation
brain correlation coefficient 0.907 0.44
p value 3.04E-16 0.00414
spleen correlation coefficient 0.438 0.426
p value 0.00417 0.0057
kidney correlation coefficient -0.0309 0.0221
p value 0.848 0.89
liver correlation coefficient 0.216 0.192
p value 0.176 0.227
lung correlation coefficient 0.365 0.123
p value 0.0188 0.44
intestine correlation coefficient 0.0828 0.225
p value 0.607 0.156
muscle correlation coefficient 0.0543 0.237
p value 0.736 0.135
stomach correlation coefficient -0.108 0.0212
p value 0.501 0.894
pancreas correlation coefficient 0.202 0.339
p value 0.205 0.0306
prostate correlation coefficient 0.302 0.411
p value 0.0551 0.0079
skin correlation coefficient 0.071 0.166
p value 0.659 0.297
adrenal correlation coefficient 0.373 0.327
p value 0.0163 0.0369
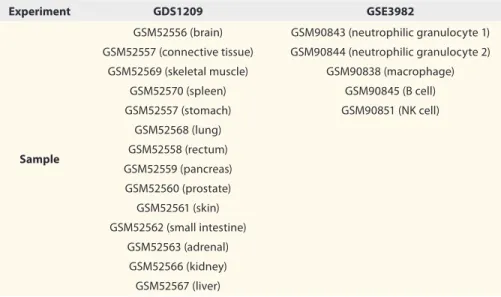
containing inter alia two different neutrophil samples were ana- lyzed. The experiment and sample IDs are presented in Table 6.
The expression levels were normalized to GAPDH. We used the color scale bar described above. The initial point was 0 (blue) and the end point was 2.2488 (red). The table containing the
Supplemental Materials Supplemental material may be downloaded here:
http://www.landesbioscience.com/journals/smallgtpases/
article/23708 and Spearman Rank Order Correlation.
We analyzed only those tissues and GAPs which were found in both evaluated data sets.
Disclosure of Conflicts of Interest No potential conflicts of interest were disclosed.
Acknowledgments
The authors are indebted to Dr N.
Gyöngyösi for help in statistical analysis.
In silico work performed in the authors’
laboratory was supported by grants from the Hungarian Research Fund (OTKA K81277 and K75084) and TÁMOP (grant 4.2.2/B10/1-2010-0013 and 4.2.4.A/1- 11-1-2012-0001). RC-K designed and performed part of the in silico work and
prepared writing of the manuscript; DS and VG performed the majority of the experiments; ZLT prepared the phylogenetic tree reconstruction; EL supervised, coordinated and financed the work and had a major role in writing the manuscript.
Table 6. The analyzed samples of microarray experiments
Experiment GDS1209 GSE3982
Sample
GSM52556 (brain) GSM52557 (connective tissue)
GSM52569 (skeletal muscle) GSM52570 (spleen) GSM52557 (stomach)
GSM52568 (lung) GSM52558 (rectum) GSM52559 (pancreas) GSM52560 (prostate)
GSM52561 (skin) GSM52562 (small intestine)
GSM52563 (adrenal) GSM52566 (kidney) GSM52567 (liver)
GSM90843 (neutrophilic granulocyte 1) GSM90844 (neutrophilic granulocyte 2)
GSM90838 (macrophage) GSM90845 (B cell) GSM90851 (NK cell)
References
1. Hall A. Rho GTPases and the actin cytoskeleton.
Science 1998; 279:509-14; PMID:9438836; http://
dx.doi.org/10.1126/science.279.5350.509
2. Ridley AJ. Rho GTPases and actin dynamics in mem- brane protrusions and vesicle trafficking. Trends Cell Biol 2006; 16:522-9; PMID:16949823; http://dx.doi.
org/10.1016/j.tcb.2006.08.006
3. Bokoch GM. Regulation of innate immunity by Rho GTPases. Trends Cell Biol 2005; 15:163-71;
PMID:15752980; http://dx.doi.org/10.1016/j.
tcb.2005.01.002
4. Boguski MS, McCormick F. Proteins regulat- ing Ras and its relatives. Nature 1993; 366:643-54;
PMID:8259209; http://dx.doi.org/10.1038/366643a0 5. Tcherkezian J, Lamarche-Vane N. Current knowl- edge of the large RhoGAP family of proteins. Biol Cell 2007; 99:67-86; PMID:17222083; http://dx.doi.
org/10.1042/BC20060086
6. Cerione RA, Zheng Y. The Dbl family of oncogenes.
Curr Opin Cell Biol 1996; 8:216-22; PMID:8791419;
http://dx.doi.org/10.1016/S0955-0674(96)80068-8 7. Olofsson B. Rho guanine dissociation inhibitors:
pivotal molecules in cellular signalling. Cell Signal 1999; 11:545-54; PMID:10433515; http://dx.doi.
org/10.1016/S0898-6568(98)00063-1
8. Scheffzek K, Ahmadian MR, Wittinghofer A. GTPase- activating proteins: helping hands to complement an active site. Trends Biochem Sci 1998; 23:257-62;
PMID:9697416; http://dx.doi.org/10.1016/S0968- 0004(98)01224-9
9. Ligeti E, Welti S, Scheffzek K. Inhibition and ter- mination of physiological responses by GTPase activating proteins. Physiol Rev 2012; 92:237-72;
PMID:22298657; http://dx.doi.org/10.1152/phys- rev.00045.2010
10. Sano H, Kane S, Sano E, Mîinea CP, Asara JM, Lane WS, et al. Insulin-stimulated phosphorylation of a Rab GTPase-activating protein regulates GLUT4 translocation. J Biol Chem 2003; 278:14599-602;
PMID:12637568; http://dx.doi.org/10.1074/jbc.
C300063200
11. Exton JH. Small GTPases minireview series. J Biol Chem 1998; 273:19923; PMID:9685324; http://
dx.doi.org/10.1074/jbc.273.32.19923
12. Bernards A. GAPs galore! A survey of putative Ras superfamily GTPase activating proteins in man and Drosophila. Biochim Biophys Acta 2003; 1603:47-82;
PMID:12618308
13. Nassar N, Hoffman GR, Manor D, Clardy JC, Cerione RA. Structures of Cdc42 bound to the active and cata- lytically compromised forms of Cdc42GAP. Nat Struct Biol 1998; 5:1047-52; PMID:9846874; http://dx.doi.
org/10.1038/4156
14. Moon SY, Zheng Y. Rho GTPase-activating proteins in cell regulation. Trends Cell Biol 2003; 13:13-22;
PMID:12480336; http://dx.doi.org/10.1016/S0962- 8924(02)00004-1
15. Boissel L, Houssin N, Chikh A, Rynditch A, Van Hove L, Moreau J. Recruitment of Cdc42 through the GAP domain of RLIP participates in remodeling of the actin cytoskeleton and is involved in Xenopus gastrulation.
Dev Biol 2007; 312:331-43; PMID:17950267; http://
dx.doi.org/10.1016/j.ydbio.2007.09.027
16. Kim J, Shim S, Choi SC, Han JK. A putative Xenopus Rho-GTPase activating protein (XrGAP) gene is expressed in the notochord and brain during the early embryogenesis. Gene Expr Patterns 2003; 3:219-23;
PMID:12711552; http://dx.doi.org/10.1016/S1567- 133X(02)00073-X
17. Tolias KF, Duman JG, Um K. Control of synapse development and plasticity by Rho GTPase regula- tory proteins. Prog Neurobiol 2011; 94:133-48;
PMID:21530608; http://dx.doi.org/10.1016/j.pneuro- bio.2011.04.011
18. Mishima M, Glotzer M. Cytokinesis: a logical GAP.
Curr Biol 2003; 13:R589-91; PMID:12906808; http://
dx.doi.org/10.1016/S0960-9822(03)00521-9 19. Kitamura T, Kawashima T, Minoshima Y, Tonozuka Y,
Hirose K, Nosaka T. Role of MgcRacGAP/Cyk4 as a reg- ulator of the small GTPase Rho family in cytokinesis and cell differentiation. Cell Struct Funct 2001; 26:645-51;
PMID:11942621; http://dx.doi.org/10.1247/csf.26.645 20. Csépányi-Kömi R, Lévay M, Ligeti E. Small G proteins
and their regulators in cellular signalling. Mol Cell Endocrinol 2012; 353:10-20; PMID:22108439; http://
dx.doi.org/10.1016/j.mce.2011.11.005
21. Kahn RA, Bruford E, Inoue H, Logsdon JM Jr., Nie Z, Premont RT, et al. Consensus nomenclature for the human ArfGAP domain-containing proteins.
J Cell Biol 2008; 182:1039-44; PMID:18809720;
http://dx.doi.org/10.1083/jcb.200806041
22. Warren MS, Bradley WD, Gourley SL, Lin YC, Simpson MA, Reichardt LF, et al. Integrin β1 signals through Arg to regulate postnatal dendritic arbo- rization, synapse density, and behavior. J Neurosci 2012; 32:2824-34; PMID:22357865; http://dx.doi.
org/10.1523/JNEUROSCI.3942-11.2012
23. Taniguchi S, Liu H, Nakazawa T, Yokoyama K, Tezuka T, Yamamoto T. p250GAP, a neural RhoGAP protein, is associated with and phosphorylated by Fyn. Biochem Biophys Res Commun 2003; 306:151- 5; PMID:12788081; http://dx.doi.org/10.1016/
S0006-291X(03)00923-9
24. Nakazawa T, Watabe AM, Tezuka T, Yoshida Y, Yokoyama K, Umemori H, et al. p250GAP, a novel brain-enriched GTPase-activating protein for Rho family GTPases, is involved in the N-methyl-d- aspartate receptor signaling. Mol Biol Cell 2003;
14:2921-34; PMID:12857875; http://dx.doi.
org/10.1091/mbc.E02-09-0623
25. Oh D, Han S, Seo J, Lee JR, Choi J, Groffen J, et al. Regulation of synaptic Rac1 activity, long- term potentiation maintenance, and learning and memory by BCR and ABR Rac GTPase- activating proteins. J Neurosci 2010; 30:14134- 44; PMID:20962234; http://dx.doi.org/10.1523/
JNEUROSCI.1711-10.2010
26. Kaartinen V, Nagy A, Gonzalez-Gomez I, Groffen J, Heisterkamp N. Vestibular dysgenesis in mice lacking Abr and Bcr Cdc42/RacGAPs. Dev Dyn 2002; 223:517-25; PMID:11921339; http://dx.doi.
org/10.1002/dvdy.10071
27. Voncken JW, van Schaick H, Kaartinen V, Deemer K, Coates T, Landing B, et al. Increased neutro- phil respiratory burst in bcr-null mutants. Cell 1995; 80:719-28; PMID:7889565; http://dx.doi.
org/10.1016/0092-8674(95)90350-X
28. Cunnick JM, Schmidhuber S, Chen G, Yu M, Yi SJ, Cho YJ, et al. Bcr and Abr cooperate in negatively regulating acute inflammatory responses. Mol Cell Biol 2009; 29:5742-50; PMID:19703997; http://
dx.doi.org/10.1128/MCB.00357-09
37. Detwiller KY, Fernando NT, Segal NH, Ryeom SW, D’Amore PA, Yoon SS. Analysis of hypoxia-related gene expression in sarcomas and effect of hypoxia on RNA interference of vascular endothelial cell growth factor A. Cancer Res 2005; 65:5881-9; PMID:15994966;
http://dx.doi.org/10.1158/0008-5472.CAN-04-4078 38. Yoon SS, Segal NH, Park PJ, Detwiller KY, Fernando
NT, Ryeom SW, et al. Angiogenic profile of soft tissue sarcomas based on analysis of circulating factors and microarray gene expression. J Surg Res 2006; 135:282- 90; PMID:16603191; http://dx.doi.org/10.1016/j.
jss.2006.01.023
39. Jeffrey KL, Brummer T, Rolph MS, Liu SM, Callejas NA, Grumont RJ, et al. Positive regulation of immune cell function and inflammatory responses by phos- phatase PAC-1. Nat Immunol 2006; 7:274-83;
PMID:16474395; http://dx.doi.org/10.1038/ni1310 33. Kandpal RP. Rho GTPase activating proteins in
cancer phenotypes. Curr Protein Pept Sci 2006;
7:355-65; PMID:16918449; http://dx.doi.
org/10.2174/138920306778018025
34. Sanz-Moreno V, Gadea G, Ahn J, Paterson H, Marra P, Pinner S, et al. Rac activation and inactivation control plasticity of tumor cell movement. Cell 2008; 135:510- 23; PMID:18984162; http://dx.doi.org/10.1016/j.
cell.2008.09.043
35. Yuan BZ, Zhou X, Durkin ME, Zimonjic DB, Gumundsdottir K, Eyfjord JE, et al. DLC-1 gene inhibits human breast cancer cell growth and in vivo tumorigenicity. Oncogene 2003; 22:445- 50; PMID:12545165; http://dx.doi.org/10.1038/
sj.onc.1206064
36. Yuan BZ, Jefferson AM, Baldwin KT, Thorgeirsson SS, Popescu NC, Reynolds SH. DLC-1 operates as a tumor suppressor gene in human non-small cell lung carcino- mas. Oncogene 2004; 23:1405-11; PMID:14661059;
http://dx.doi.org/10.1038/sj.onc.1207291 29. Cho YJ, Cunnick JM, Yi SJ, Kaartinen V, Groffen J,
Heisterkamp N. Abr and Bcr, two homologous Rac GTPase-activating proteins, control multiple cellular functions of murine macrophages. Mol Cell Biol 2007; 27:899-911; PMID:17116687; http://dx.doi.
org/10.1128/MCB.00756-06
30. Csépányi-Kömi R, Sirokmány G, Geiszt M, Ligeti E.
ARHGAP25, a novel Rac GTPase-activating protein, regulates phagocytosis in human neutrophilic granu- locytes. Blood 2012; 119:573-82; PMID:22096251;
http://dx.doi.org/10.1182/blood-2010-12-324053 31. Adams MD, Kelley JM, Gocayne JD, Dubnick M,
Polymeropoulos MH, Xiao H, et al. Complementary DNA sequencing: expressed sequence tags and human genome project. Science 1991; 252:1651- 6; PMID:2047873; http://dx.doi.org/10.1126/sci- ence.2047873
32. He Y, Northey JJ, Primeau M, Machado RD, Trembath R, Siegel PM, et al. CdGAP is required for trans- forming growth factor β- and Neu/ErbB-2-induced breast cancer cell motility and invasion. Oncogene 2011; 30:1032-45; PMID:21042277; http://dx.doi.
org/10.1038/onc.2010.477