A High-Resolution Method for Quantitative
Molecular Analysis of Functionally Characterized Individual Synapses
Graphical Abstract
Highlights
d Etching and antigen retrieval enhance immunoreactions in epoxy-resin-embedded tissue
d Biocytin-filled nerve cells can be visualized in epoxy-resin- embedded tissue
d Molecular composition of functionally characterized individual synapses is revealed
d Multiplexed, postembedding reactions are compatible with STED imaging
Authors
Noemi Holderith, Judit Heredi, Viktor Kis, Zoltan Nusser
Correspondence
nusser@koki.hu
In Brief
Holderith et al. present a sensitive, quantitative immunolocalization method that allows the visualization of dozens of synaptic proteins in epoxy-resin-
embedded ultrathin sections with a resolution of <40 nm. Their method is ideal for molecular characterization of individual synapses followingin vitro paired recordings, two-photon [Ca2+] or glutamate-sensor (iGluSnFR) imaging.
Holderith et al., 2020, Cell Reports32, 107968 July 28, 2020ª2020 The Author(s).
https://doi.org/10.1016/j.celrep.2020.107968
ll
Resource
A High-Resolution Method
for Quantitative Molecular Analysis
of Functionally Characterized Individual Synapses
Noemi Holderith,1Judit Heredi,1Viktor Kis,1,2and Zoltan Nusser1,3,*
1Laboratory of Cellular Neurophysiology, Institute of Experimental Medicine, Budapest 1083, Hungary
2Present address: Unicam Magyarorszag Kft, K}oszeg u. 27, Budapest 1144, Hungary
3Lead Contact
*Correspondence:nusser@koki.hu
https://doi.org/10.1016/j.celrep.2020.107968
SUMMARY
Elucidating the molecular mechanisms underlying the functional diversity of synapses requires a high-reso- lution, sensitive, diffusion-free, quantitative localization method that allows the determination of many pro- teins in functionally characterized individual synapses. Array tomography permits the quantitative analysis of single synapses but has limited sensitivity, and its application to functionally characterized synapses is challenging. Here, we aim to overcome these limitations by searching the parameter space of different fixa- tion, resin, embedding, etching, retrieval, and elution conditions. Our optimizations reveal that etching epoxy-resin-embedded ultrathin sections with Na-ethanolate and treating them with SDS dramatically in- crease the labeling efficiency of synaptic proteins. We also demonstrate that this method is ideal for the molecular characterization of individual synapses following paired recordings, two-photon [Ca
2+] or gluta- mate-sensor (iGluSnFR) imaging. This method fills a missing gap in the toolbox of molecular and cellular neuroscience, helping us to reveal how molecular heterogeneity leads to diversity in function.
INTRODUCTION
Synaptic diversity is a generally accepted concept that em- bodies the functional, structural, and molecular heterogeneity of central synapses (Atwood and Karunanithi, 2002;Chabrol et al., 2015;Dittman et al., 2000;O’Rourke et al., 2012). The morphological heterogeneity of synapses was revealed over a half a century ago (Gray, 1959). Probably still the most spectac- ular difference among central synapses is their enormous struc- tural variations: e.g., most cortical axon terminals are1mm and possess a single active zone (AZ) with few release sites (RSs) versus the calyx of Held in the auditory brainstem that can be
>8mm and form hundreds of AZs with thousands of RSs. Inter- estingly, combined functional and structural studies revealed that the overall morphology of the presynaptic axon terminal cannot be used to predict neither the quantal parameters—the number of RS (N) per AZ, the vesicle release probability (Pv), and the quantal size (q)—nor the type of short- or long-term plas- ticity (E´ltes et al., 2017;Koester and Johnston, 2005;Xu-Fried- man et al., 2001).
The most likely explanation of this is that differences in the mo- lecular composition of synapses underlie the diversity in their function. Molecular studies revealed (reviewed by S€udhof, 2012) multiple variants of key molecules essential for docking, priming, and fusion of synaptic vesicles (e.g., 3 Munc13 and 6 Munc18 variants), Ca2+sensors (4 synaptotagmins), and presyn- aptic Ca2+ channels (3 Cav subunits). Similarly, there are 14
glutamate receptor (GluR) subunits that assemble into dozens of distinct GluRs with different affinities and kinetics. The combi- natorial expression of only these pre- and postsynaptic mole- cules results in thousands of permutations, which could easily explain the observed functional diversity (Nusser, 2018).
How could we determine the molecular mechanisms underly- ing the functional diversity? A number of methods have been developed that allow the determination of gene and protein expression in brain areas, subregions, and even in individual cells (e.g.,in situhybridization, single-cell RT-PCR, single-cell RNA sequencing [RNA-seq], and proteomic analysis of synapto- somes;Fuzik et al., 2016;Gall and Pardue, 1969;Takamori et al., 2006;Wang et al., 2009). They are ideal for investigating the molecular mechanisms underlying differences in the functional properties of distinct synapse populations (e.g., cerebellar paral- lel fiber versus calyx of Held synapses). In these synapses, the pre- and postsynaptic elements belong to distinct cell clas- ses with unique gene expressions. The up- or downregulation of genes in combination with functional analysis have been successfully used to reveal the roles of many synaptic proteins (reviewed byS€udhof, 2012).
However, not only distinct synapse populations possess different functional properties. It has been demonstrated that the subunit composition of GluRs on a single postsynaptic cell can be presynaptic input dependent (Fritschy et al., 1998;
Rubio and Wenthold, 1997;Watanabe et al., 1998). The func- tional properties and molecular composition of AZs of a single
(legend on next page)
presynaptic cell could depend on the postsynaptic target cell type (Ali and Thomson, 1998; E´ltes et al., 2017; Losonczy et al., 2002; Pouille and Scanziani, 2004; Shigemoto et al., 1996;Sylwestrak and Ghosh, 2012). Furthermore, the structural and functional properties of synapses made by identical pre- and postsynaptic cell types are also widely different (e.g., synapses among cerebellar interneurons [INs]; Pulido et al., 2015; or among hippocampal CA3 pyramidal cells [PCs]; Holderith et al., 2012). In these cases, population-level analysis of the func- tional properties and molecular content of synapses are inade- quate; only individual synapse-based approaches are suitable.
What are the currently available high-resolution localization methods? The most widely used method is pre-embedding, light microscopy (LM) immunohistochemistry on thick (10–100mm) sections. This method, however, is highly nonquantitative due to the differential diffusion of immunoreagents into the depth of the tissue. Only diffusion-free methods permit quantitative com- parisons in the reaction strength of different subcellular ele- ments. Freeze-fracture replica immunolabeling (FRL;Fujimoto et al., 1996;Rash et al., 1998) has been widely used to localize transmembrane proteins at high resolution. This method is diffu- sion free, is linear, and has an exceptional sensitivity (Masugi-To- kita and Shigemoto, 2007); but, due to the random fracturing of the frozen tissue, so far none could use this method to study in- dividual, functionally characterized synapses. Post-embedding immunolocalization on thin (100 nm) resin-embedded tissue sections is also diffusion free, is quantitative, and allows the visu- alization of antigens embedded in dense protein matrices (e.g., receptors embedded in the postsynaptic density [PSD];Nusser, 1999;Ottersen and Landsend, 1997;Phend et al., 1995). Re- searchers of previous studies (Collman et al., 2015;Micheva and Bruchez, 2012;Micheva and Smith, 2007) have visualized the post-embedding reactions with fluorescent-dye-coupled secondary antibodies (sAbs), imaged them at the LM level, and
performed the reactions on serial sections for post hoc recon- struction of the volume of the tissue (method called array tomog- raphy [AT]). They also demonstrated that the Abs can be eluted after a labeling round and that the sections can be relabeled, al- lowing the visualization of dozens of molecules. Probably the major shortcoming of AT was its limited sensitivity, and its appli- cation to functionally characterized synapses was challenging (Valenzuela et al., 2016). Here, we aim to overcome these limita- tions by optimizing fixation, resin, embedding, etching, retrieval, and elution conditions. We discovered that the highest sensitivity of the reactions was achieved in ordinary epoxy-resin- embedded tissue following etching and retrieval and also demonstrate the straightforward applicability of our method to functionally characterized synapses.
RESULTS
Etching Epoxy-Resin-Embedded Ultrathin Sections Dramatically Increases Immunolabeling
We performed post-embedding immunoreactions on cerebellar sections embedded into epoxy (Durcupan) or acrylic (LR White and Lowicryl HM20) resins without OsO4treatment by using con- ventional protocols, and we visualized the reactions with fluores- cent-dye-coupled sAbs. According to published results (Micheva and Smith, 2007), we detected punctate neuropil labeling for the soluble NSF attachment proteins receptors (SNARE) complex protein SNAP25 in the cerebellar molecular layer in acrylic-resin- embedded sections, without any detectable signal on the epoxy-resin-embedded sections (Figure 1A). It has been known that the strength of immunosignals in post-embedding reactions can be increased by etching the resin with Na-ethanolate (satu- rated solution of NaOH in absolute ethanol;Lane and Europa, 1965;Matsubara et al., 1996;Nusser et al., 1998;Somogyi et al., 1985). Treating the 200-nm-thick sections with Na-ethanolate for
Figure 1. Increased Immunolabeling Efficiency in Epoxy-Resin-Embedded Tissue after Etching and Antigen Retrieval
(A and B) Post-embedding fluorescent labeling for SNAP25 on 200-nm-thin sections obtained from rat cerebellar cortex embedded into three different types of resin without (A) or with 2 min of etching with Na-ethanolate (B). All images were taken under the same illumination and detection conditions.
(C) Munc13-1 immunolabeling of the stratum radiatum in epoxy-resin-embedded mouse hippocampal CA1 area after etching and retrieval. Reactions were carried out on sections with different thicknesses.
(D) Normalized mean fluorescent signal intensity of PSD95, Munc13-1, and vGluT1 show a tight linear correlation with the section thickness. Symbols for each protein are the mean±SD from 3 reactions in 3 mice. The reaction strengths were normalized to those obtained in the 200-nm-thick sections.
(E) Immunofluorescence for vGluT1 in the stratum radiatum of the CA1 area (left image). Circular ROIs were placed over fluorescent clusters (ROI #1–#4) and over the unlabeled neuropil to determine the specific and background (bg) labeling, respectively. The reaction was followed by an elution step with 1% SDS (middle image) and a step when only the appropriate sAb (Alexa647 coupled donkey anti-rabbit) was applied (right image). All images were taken with the same acquisition settings and are shown with the same look-up table.
(F) The integrated fluorescence (background-subtracted mean) is plotted for the 1stlabeling round, the elution, and the sAb relabeling steps. When the sAb was reapplied, the mean fluorescence did not increase significantly (1.4%±0.5% versus 2.3%±1.1% of the 1stlabeling round, n = 7, p = 0.99; while both significantly differed from the 1stlabeling round, p < 0.0002, Kruskal-Wallis with Tukey honestly significant difference [HSD] post hoc test). Measurements for 7 proteins are shown, and symbols for each protein are the mean±SD from 3 reactions in 3 mice from 20–50 ROIs per reaction.
(G) Mean normalized PSD95 fluorescence is shown in 4 consecutive labeling rounds in epoxy-resin-embedded tissue obtained from 3 mice (open circles, 60, 69, and 73 ROIs in 3 reactions). The mean±SD are shown with filled circles.
(H) Same as in (G), but labeling for 4 proteins are shown (all represent the mean±SD of 3 mice; 20–73 ROIs in each reaction).
(I) The background-subtracted fluorescence of each ROI (same as in H) was calculated and normalized for the mean of each labeling round. Then, the ratio of the 2ndand 1strounds was calculated for each ROI, and the mean and the coefficient of variation (CV) was calculated of these ratios. This was repeated for the 3rdand 2ndrounds and for the 4thand 3rdrounds. The symbols represent the mean±SD from 3 reactions (3 mice).
(J) The ratios of the background-subtracted fluorescent signal for vGluT1 and PSD95 and for Munc13-1 and PSD95 were calculated across 4 labeling rounds (27–
30 ROIs in each experiment in 3 mice). Then, the ratios of the 2ndand 1st, 3rdand 2nd, and 4thand 3rdrounds were calculated. The round-to-round variability (CV) was then calculated and plotted.
Open symbols represent the CV values of the 3 reactions in 3 mice, whereas filled symbols indicate the mean±SD.
Abbreviations are as follows: ml, molecular layer; pcl, Purkinje cell layer; gcl, granular layer.
Figure 2. Multiplexed Immunolabeling in Epoxy-Resin-Embedded Tissue after Etching and Antigen Retrieval
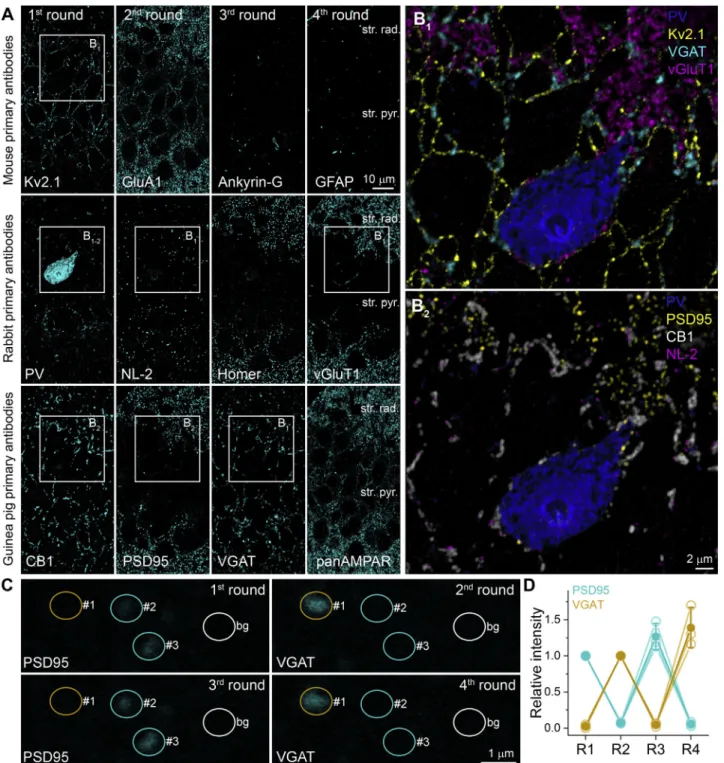
(A) Multiple immunolabeling of an epoxy-resin-embedded section of the hippocampal CA1 area of an adult rat. Four rounds of triple labeling were performed using primary Abs raised in 3 different species (top row: mouse monoclonal IgG1; middle: rabbit polyclonal; bottom: Guinea pig polyclonal Abs). Reactions within one round were visualized with Alexa488-, Cy3-, and Cy5-coupled sAbs (all reactions are pseudocolored and shown in cyan). Boxed areas are shown at higher magnifications in panels (B1and B2).
(B1) Immunolabeling for PV, Kv2.1, VGAT, and vGluT1 are present in different, nonoverlapping subcellular compartments. The vGluT1-positive terminals are only present around the PV+ IN soma but not the neighboring PC somata that are outlined by the Kv2.1 labeling. VGAT-positive terminals (cyan) surround the somata of the IN and the PCs.
(B2) Immunolabeling of PV, PSD95, CB1, and neuroligin-2 (NL-2).
(legend continued on next page)
2–5 min before the immunoreactions dramatically increased the strength of the reaction in all three resin types tested (Figure 1B).
Surprisingly, the reaction became the strongest in the epoxy- resin-embedded tissues. We also noticed that treating the etched sections with a 0.5% sodium dodecyl sulfate (SDS) solution at 80C for 60 min further increased the reaction strength. Quantita- tive analysis of the reactions revealed that etching and retrieval increased the reaction strength by 4.0±4.0, 7.5±7.8, and 497.4
±565.0 times (n = 8 proteins; SNAP25, vGluT1, synaptotagmin 2, GFAP, PSD95, parvalbumin (PV), VGAT, and Piccolo) in LR White-, Lowicryl-, and Durcupan-embedded tissues, respectively.
When we compared the reaction strength in LR White without etching to that in Durcupan with etching and retrieval, a 47.2± 72.4-fold increase was obtained (n = 8 proteins). Overall, we observed and increased reaction strength for a total of 65 proteins:
12 presynaptic molecules, 17 postsynaptic molecules, 3 calcium binding proteins, 3 neuropeptides, 8 structural proteins, 11 voltage-gated ion channels, 3 G-protein-coupled receptors, 5 transporters, and 3 cytoplasmic molecules (Key Resources Table).
The strength of the reaction also depended on the chemical fixa- tion of the tissue. We tested 1% and 4% formaldehyde (FA)-con- taining fixatives (Table S1) and noticed that some molecules preferred stronger fixations (e.g., SNAP25 and vGluT1), whereas others preferred weaker fixations (e.g., PSD95, Piccolo, and NR1) and also some others were rather insensitive to fixation strength (e.g., CB1). Because the elution and restaining and the retention of biocytin in intracellularly filled cells were more reliable in 4% FA-fixed tissue, we decided to use this chemical fixation in the rest of the study.
In post-embedding reactions, the reaction strength should not depend on the thickness of the sections (e.g., 100 or 500 nm) because epitopes are accessible for the Abs only on the surface of the thin sections (e.g., top few nm). Howev- er, if the underlying mechanism of the increase in reaction strength by etching is that Na-ethanolate removes all resins and makes all epitopes within the entire section available for the Abs, then the reaction strength should show a positive correlation with the section thickness. We tested this hypoth- esis by cutting 70-, 100-, 200-, 300-, 400-, and 500-nm-thick sections and reacted them with PSD95, vGluT1, and Munc13- 1 (Figure 1C). We then calculated the background-subtracted mean fluorescent intensities and normalized them to those of the 200-nm-thick sections. The almost perfect linear correla- tions between the actual and expected immunoreactivity for PSD95 and Munc13-1 with a slope of 1.03 and 1.02, respec- tively, demonstrate that Na-ethanolate entirely removes the epoxy resin from the sections, allowing the visualization of all epitopes within the section (Figure 1D). These results also provide evidence that the selected section thickness (within this range) is not a relevant factor when etching is performed:
i.e., when the molecular content of a synapse is determined from 5 consecutive 100-nm sections or 1 500-nm section, the result should be the same.
Multiplexed Immunoreactions in Epoxy-Resin- Embedded Ultrathin Sections
Micheva and Smith (2007) have elegantly demonstrated that multiple rounds of labeling can be performed on LR-White- embedded sections. We repeated their experiments in epoxy-resin-embedded sections and found that their elution solution (0.2 M NaOH for 20 min) consistently removed the sections from the coated histological slides. We then reduced the NaOH concentration to 0.02 M, which resulted in an incomplete removal of the immunoreagents. Increasing the temperature to 60C fully removed the immunolabeling but caused some distortion of the sections. We then tested the effectiveness of a 1% SDS solution (pH = 9) at 80C for 5 min and found that it efficiently abolishes the immunolabel- ing (Figure 1E). Quantitative analysis of 21 reactions for 7 different proteins revealed that after the elution only 1.4%± 0.5% of the signal remained. The subsequent application of the appropriate sAbs did not significantly increase the signal (2.3%±1.1%;Figure 1F), demonstrating that our elution solu- tion does not only quench the fluorescent molecules or re- move only the sAb but also removes the primary Ab as well.
Having established a reliable and effective way of removing the immunoreagents after a staining round, we repeated the labeling with new Abs in a way that the immunosignal in the new round should have had a different labeling pattern compared to the previous one (Figures 2A and 2B). We per- formed triple-labeling reactions with three primary Abs raised in different species in each labeling round and found qualita- tively distinct labeling patterns either within or among the consecutive rounds (12 proteins in total;Figures 2A and 2B).
To examine this quantitatively, we performed immunolabeling with two primary Abs (VGAT and PSD95) raised in the same species (Guinea pig) that label unique, nonoverlapping subcel- lular compartments (Figure 2C). We carried out single labeling first for PSD95 and imaged the hilar region of the hippocam- pus. Following an elution step, we immunolabeled the same section for VGAT, imaged the same area, and measured the fluorescence in regions of interest (ROIs) over excitatory syn- apses and VGAT-positive GABAergic axons. We then repeated these two steps and analyzed quantitatively the re- sults. These experiments demonstrated that the fluorescence for VGAT was virtually zero over excitatory synapses in the PSD95 labeling rounds (1stround: 2.6%±2.4% and 3rdround:
4.6%±2.5%; n = 3), and similarly, the excitatory synapses re- mained unlabeled in the VGAT labeling rounds (2nd round:
7.2%±1.1% and 4thround: 5.7%±2.9%;Figure 2D).
(C) Confocal images of a 200-nm-thick section of the mouse hilar region labeled for PSD95 (1stand 3rdrounds) and for VGAT (2ndand 4throunds; both Guinea pig primary Abs). Circular ROIs were placed over PSD95-labeled glutamatergic synapses (yellow) and over VGAT-positive axons (cyan). The nonspecific background labeling (white ROI) was measured over the unlabeled neuropil.
(D) Mean normalized integrated fluorescence values are plotted for 4 labeling rounds. Open symbols represent reactions from 3 mice, and the filled symbols are mean±SD. The fluorescence in the inhibitory axons is 2.6%±2.4% in the 1stand 4.6%±2.5% in the 3rdrounds, similar to that measured over the excitatory synapses in the 2nd(7.2%±1.1%) and 4th(5.7%±2.9%) rounds. A total of 21–28 ROIs were analyzed in each condition.
str. rad., stratum radiatum; str. pyr., stratum pyramidale.
Figure 3. Multiplexed Immunolabeling of Synaptic Proteins in Intracellularly Filled Neurons
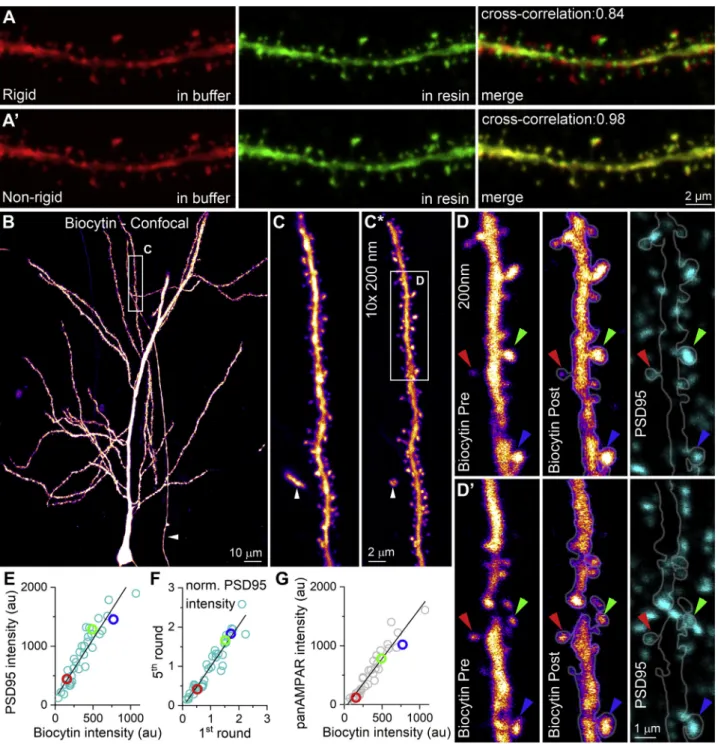
(A and A0) Maximum intensity image of a biocytin-filled CA1 PC dendrite (visualized with Cy3-conjugated streptavidin) imaged in a 60-mm-thick section in an aqueous mounting medium (Slowfade Diamond, left). The same dendrite is shown in Durcupan (middle image). Superimposition of the two images with rigid transformations shows slight distortion (top right panel). However, the perfect superimposition of the two images (right image) with nonrigid transformation demonstrates that the overall morphology of the dendrites and dendritic spines remain the same following resin embedding (bottom right panel).
(B) Maximum intensity projection of a confocal image stack of a biocytin-filled CA1 PC after dehydration and embedding in Durcupan. Arrowhead points to the main axon of an IN (oriens-lacunosum-moleculare [O-LM] cell shown inFigure 6).
(C) High-magnification image of a selected dendritic segment in the epoxy-resin-embedded thick tissue. White arrowhead points to the IN axon.
(C*) The same dendritic segment as in (C), but after resectioning into a series of 200-nm sections. Images were aligned using ‘‘HyperStackStitcher’’ (seeSTAR Methods). Boxed area is enlarged in (D) and (D0).
(D) Confocal image of the filled dendrite before (left) and after (middle) etching and antigen retrieval. Fluorescent labeling for PSD95 on the same section. Colored arrowheads indicate spines of different sizes and their quantitative results are shown in (E)–(G) (same color).
(D0) Same as (D), but the next serial section.
(legend continued on next page)
Quantitative Analysis of Multiround Immunoreactions It is crucial to understand how the absolute intensity of immuno- signal changes along the consecutive labeling rounds because if there is a marked decrease in the intensity as the labeling rounds progress, some structures could eventually become erroneously immunonegative. We performed four rounds of immunolabeling for PSD95 in CA1 area and measured the intensity of glutamater- gic synapses (Figure S1A). Quantitative analysis of the reactions disclosed very little change in the mean labeling intensity, although individual reactions showed slight increases or de- creases (Figures 1G andS1B). We repeated these experiments for three other proteins and found virtually no change in the reac- tion strength within the four rounds (2ndround: 1.03±0.09; 3rd: 1.00±0.09; 4th: 1.03±0.1;Figure 1H).
By using any immunolocalization technique, the absolute strength of the signal cannot be easily translated into a mean- ingful quantity because of the unknown labeling efficacy of the Abs. Therefore, most quantitative immunolocalization studies rely on the comparison of the immunoreactivity of distinct cellular or subcellular compartments (relative measures). If the ratio of the immunosignal between two sites reflects the ratio of the amount of molecules, one could claim that method as quantitative and linear. To investigate the reliability of our method for revealing quantitative differences in the strength of synapses, we calculated background-subtracted fluores- cent intensities for dozens of excitatory synapses and normal- ized their values to the mean intensity in that round. We then repeated this procedure for four labeling rounds and calcu- lated the ratios of the mean normalized fluorescent intensities for all ROIs between the 2ndand 1st, the 3rdand 2nd, and the 4thand 3rdrounds. The coefficient of variations (CVs) of these ratios provide an objective measure of the reliability of the la- beling along the rounds. With other words, if a synapse in the 1st round had an intensity of 50% of the mean and if it is still 50% of the mean in the 2nd round, then the method provides a reproducible result. Such a situation would be characterized with a low CV value.Figure 1I illustrates that the CV for vGluT1 and PSD95 is less than 0.15 throughout the four rounds of labeling, demonstrating that very reliable la- beling can be achieved with this method over many rounds.
For the two additional Abs tested (Homer and panAMPAR) somewhat larger (0.4–0.5) CV values were obtained. Another way of assessing the reliability of multiround labeling is to calculate the round-to-round variance in the ratios of two syn- aptic proteins. We therefore performed double-labeling reac- tions for vGluT1 and PSD95 as well as Munc13-1 and PSD95 for four rounds. We then calculated the vGluT1/
PSD95 and Munc13-1/PSD95 ratios for individual ROIs and computed their ratios between the 2nd and 1st, the 3rd and 2nd, and the 4th and 3rdrounds.Figure 1J demonstrates the small CVs, revealing again small round-to-round variations in the labeling.
Identification of Synaptic Proteins in Individual Synapses of Intracellularly Filled Neurons
We have optimized the fixation, resin-embedding, etching, anti- gen retrieval, and elution conditions to obtain a sensitive, quan- titative, diffusion-free immunolocalization method on ultrathin sections of unlabeled tissue. The golden aim in the field is to perform such a quantitative proteomic analysis in functionally characterized individual synapses. As a first step, we aimed to demonstrate that our method is compatible with widely used intracellular labeling techniques. We therefore performed whole-cell recordings from hippocampal CA1 PCs in acute slices from adult mice and filled the cells with biocytin. Following im- mersion fixation in a 4% FA-containing fixative, the biocytin was visualized with Cy3-coupled streptavidin and the cell was placed in conventional mounting medium for confocal imaging.
Figures 3A and A0 show maximum intensity projection images of a segment of a PC apical oblique dendrite. The section was then dehydrated and flat embedded in Durcupan (without OsO4) for further imaging. To our surprise, the Cy3 molecules re- tained their fluorescence in the water-free environment of the epoxy resin.Figures 3A and A0 (middle panels) show the same dendritic segment acquired from the resin-embedded section.
When we superimposed the images with rigid transformations, we observed that the dendrite and spines had the same overall morphology, but the dehydration caused some distortion (Fig- ure 3A, right). When nonrigid transformations of the images were applied, we observed a perfect superimposition of the two images (Figure 3A0, right), demonstrating that the size and shape of the spines remained unchanged.
Not only small dendritic segments could be imaged in the resin-embedded tissue but also full reconstructions of intracellu- larly filled cells were possible (Figure 3B) by acquiring confocal Z image stacks from the full depth of120-mm-thick sections. We selected an apical dendrite (Figure 3C) and re-embedded it for ultrathin sectioning. The Cy3 molecules emitted a sufficient amount of light in the 200-nm-thick sections so that the dendritic segments could be easily identified and imaged. The digital su- perimposition of 10 images of 10 consecutive 200-nm sections (Figure 3C*) allowed the full reconstruction of the dendrite previ- ously imaged in the 120-mm-thick section. On these ultrathin sections, we performed 5 rounds of labeling for 8 proteins.Fig- ure 3D shows the labeling for PSD95 of spine synapses. Large synapses are labeled intensely, whereas small ones are weak.
Two studies using EGFP-tagged PSD95 (Cane et al., 2014;
Meyer et al., 2014) demonstrated that the amount of PSD95 pro- tein is proportional to the volume of the spine head. We therefore scrutinized our method by summing the integrated biocytin fluo- rescence and that of PSD95 from consecutive sections of indi- vidual spines (n = 36). The tight positive, linear correlation be- tween these values (Figure 3E) is in agreement with the results of the above studies and provides strong evidence that our method is capable of revealing quantitative differences in the
(E) The intensity of PSD95 immunolabeling of individual spines tightly correlates (R2= 0.88, p = 5.231017Pearsons correlation, n = 36 spines) with that of biocytin, which is proportional to the volume of the spines.
(F) Normalized PSD95 immunosignal of individual spines show tight correlation between the 1stand the 5throunds (R2= 0.94, p = 4.0431018Pearsons correlation, n = 36).
(G) Same as (E), but for immunolabeling with a panAMPAR Ab (R2= 0.91, p = 4.0331019Pearsons correlation, n = 36).
protein content of central synapses. PSD95 was labeled in the 1st and relabeled in the 5thround.Figure 3F illustrates a tight, posi- tive correlation between these values, demonstrating again the reliability following the relabeling. A similar positive linear corre- lation was observed for AMPA-type GluRs (using a panAMPAR Ab;Figure 3G), consistent with the results obtained with post- embedding electron microscopy (EM) immunogold localization (Nusser et al., 1998). Similar significant positive correlations were observed for the presynaptic AZ proteins Munc13-1, Bassoon, Piccolo, and Rim 1/2 and for the PSD protein Homer, whereas the vGluT1 content of the axon terminal showed only a weak positive correlation with the spine volume (Figure S2).
Molecular Analysis of Functionally Characterized Synapses
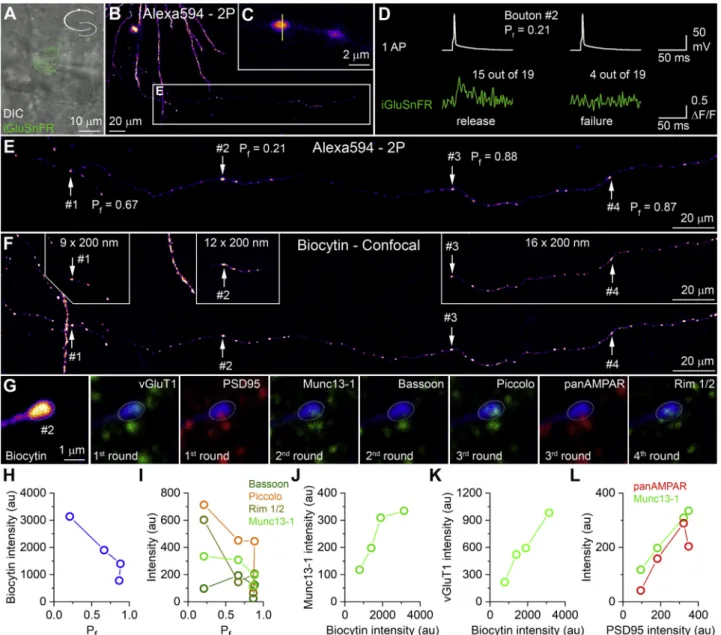
Having established that biocytin can be visualized following embedding in epoxy resin, we set up three series of experiments to demonstrate the potentials of our method: i.e., to perform mo- lecular analysis of functionally characterized individual synap- ses. First, we sparsely expressed iGluSnFR in CA1 PCs by using adeno-associated viral vectors (AAVs) expressing iGluSnFR in a Cre-dependent manner (Marvin et al., 2013) and highly diluted Cre-recombinase expressing AAVs. Whole-cell recordings were obtained from iGluSnFR-expressing PCs, and their axon collaterals were imaged using a two-photon microscope in line-scan mode (Figures 4A–4C). Somatic current-injection- evoked single action potentials (APs) either produced or failed to produce fast rising fluorescent transients in the scanned bou- tons. We calculated the failure rate (Pf) for 4 boutons where a suf- ficiently large number of repetition was achieved (Figure 4D).
Following the functional characterization, Z image stacks were acquired from the axon by using intracellularly applied Alexa594 as a fluorophore in the acute slice (Figure 4E). This was followed by chemical fixation and the visualization of biocytin with Cy3- coupled streptavidin.Figure 4F shows a maximum intensity pro- jection image of the axon segment in thick epoxy-resin- embedded section, and the insets illustrate the boutons following resectioning at 200 nm (aligned with a custom-made module of ImageJ: HyperStackStitcher). The almost perfect match of the three image sets allowed us to identify the two- photon imaged boutons in the 200-nm sections. Following etching and antigen retrieval, we performed repeated labeling for a number of pre- and postsynaptic proteins in these function- ally characterized boutons (Figures 4G andS3). Although having analyzed only 4 boutons, the quantitative analysis revealed that thePfnegatively correlates with the total fluorescence of the bio- cytin (i.e., proportional to the volume of the boutons;Figure 4H) and with Munc13-1, Rim 1/2, and Piccolo, but not with Bassoon immunosignal (Figure 4I). The integrated biocytin intensity showd a positive correlation with the Munc13-1 (Figure 4J) and vGluT1 (Figure 4K) content of the boutons. Finally, our multi- plexed immunolabeling also demonstrated that the PSD95 immunoreactivity adjacent to these boutons correlated posi- tively with the Munc13-1 content of the presynaptic AZ and the AMPA receptor content of the PSD (Figure 4L).
Next, we combinedin vitrotwo-photon [Ca2+] imaging with post hoc molecular analysis of axon terminals. CA1 PCs were whole-cell recorded in acute slices and were intracellularly filled
with a Ca2+-insensitive fluorophore (Alexa594) and a Ca2+-sensi- tive one (100mM Fluo5F) according toHolderith et al. (2012)(Fig- ure 5). Somatically evoked single APs and short trains of APs (5 AP at 40 Hz) either produced fast-rising, precisely time-locked [Ca2+] transients or failed to evoke fluorescent transients for sin- gle AP and evoked only slow-rising, small-amplitude transients for 5 APs (Figure 5B). To understand the potential molecular dif- ferences among these functionally distinct varicosities, we chemically fixed, dehydrated, and embedded the slice into Dur- cupan before resectioning at 200 nm. When we reacted the imaged boutons for vGluT1, all boutons were positive, but had variable amounts of fluorescence (Figures 5G and 5H), indicating that they were all synaptic-vesicle-containing varicosities. How- ever, the boutons in which single APs failed to evoke [Ca2+] tran- sients did not have detectable immunoreactivity either for Munc13-1 (Figures 5E and 5H) or for PSD95 (Figures 5F and 5H), demonstrating that these varicosities do not form functional synapses and the lack of AZ is consistent with the lack of voltage-gated Ca2+channels (Holderith et al., 2012).
Finally, we performed dual whole-cell recordings between synaptically connected CA1 PCs and oriens-lacunosum-molec- ulare (O-LM) INs (Figure 6). A short train of presynaptic APs evoked excitatory postsynaptic currents (EPSCs) in CA1 O-LM cells that showed marked short-term facilitation (Ali and Thom- son, 1998;Biro´ et al., 2005;Losonczy et al., 2002;Pouille and Scanziani, 2004;Sylwestrak and Ghosh, 2012). To determine the quantal parameters, we performed multiple probability fluc- tuation analysis (Biro´ et al., 2005;Silver, 2003). This analysis re- quires a large change in thePv, which we achieved by increasing the extracellular [Ca2+] to 6 mM and subsequently applying phor- bol 12,13-dibutyrate (1mM;Figures 6A–6C). Following the func- tional characterization, the slice was fixed, dehydrated, and flat embedded in Durcupan before visual inspection of the close ap- positions between the presynaptic PC axon varicosities and the postsynaptic O-LM cell dendrites (Figures 6D and 6E). The pre- synaptic axon made only one close apposition with the postsyn- aptic dendrites, indicating that this functional connection is mediated by a single synapse (Figure 6F). We could also identify this synapse following resectioning at 200 nm (Figures 6G and 6H). The synapse was oriented tangentially to the sectioning plane and was present in a single 200-nm section. The presynap- tic bouton was strongly vGluT1 immunopositive, and the opposi- tion of the labeled pre- and postsynaptic structures contained fluorescent signal for PSD95 and AMPARs as well as Bassoon, Piccolo, and Munc13-1 (Figure 6I). Our results provide evidence that a single presynaptic AZ of a hippocampal CA1 PC can have as many as 10 RSs. This single AZ contains many of the known AZ-specific molecules, the quantitative relationship of which re- mains to be determined.
Super-Resolution Analysis of Multiplexed Reactions Using STED Microscopy
One great advantage of visualizing post-embedding reactions with gold particles and examining them at the EM level is its su- perior resolution compared to conventional, diffraction-limited LM. However, super-resolution LM techniques have resolutions close to that of the size of the immunoglobulin Gs (IgGs) (Hell, 2007), practically equaling the LM and EM analysis as far as
Figure 4. Quantitative Analyses of Pre- and Postsynaptic Molecules in Synapses Characterized with iGluSnFR Imaging
(A) Superimposed differential interference contrast (DIC) and fluorescent images of a CA1 PC that expresses the glutamate sensor iGluSnFR (green). The cell was filled with Alexa594 (25mM) and biocytin (7 mM).
(B) Low-magnification two-photon image of the Alexa594 signal of the basal dendritic tree and the imaged axon collateral of the PC.
(C) High-magnification image of two boutons. Yellow line shows the path of the infrared laser beam (810 and 920 nm).
(D) Single action potentials (APs) (top row) either fail (right) or evoke (left) detectable fluorescent transients. The numbers of successes and failures and the total number of repetitions are shown.
(E) High-magnification maximum intensity projection image of a two-photon image stack of the axon. The failure rates (Pf) of the 4 imaged boutons are shown.
(F) Maximum intensity projection image of a confocal image stack showing the same axon after fixation and embedding in Durcupan (biocytin visualized with Cy3- coupled streptavidin). Three insets show the 4 boutons reconstructed from images of 200-nm-thick sections.
(G) Multiplexed immunofluorescent labeling of a functionally characterized bouton (#2) shown in (B)–(F). The biocytin signal is shown in the first image from the left with fire pseudocolor and blue in the remaining images. White oval ROI shows the position of the bouton. Presynaptic molecules are pseudocolored to green, while postsynaptic molecules are shown in red (for all 4 boutons seeFigure S3).
(H) Failure rate (Pf) of each bouton plotted against the intensity of the summed biocytin signal.
(I) The same as (H), but for Bassoon, Piccolo, Rim 1/2, and Munc13-1.
(J) Munc13-1 immunolabeling intensity shows a positive correlation with that of the biocytin.
(K) The fluorescent intensity for biocytin is plotted against vGluT1 immunolabeling intensity.
(L) PSD95 immunolabeling intensity is plotted against Munc13-1 and panAMPAR labeling.
the resolution is concerned. It was therefore our last aim to test our method for its applicability for stimulated emission depletion (STED) microscopy (Figure 7). First, we developed intracellularly filled cells with a mixture of Cy3- and Abberior635P (A635P)- coupled streptavidin. This combination allowed the visual in- spection of the cells (using Cy3 channel) and the subsequent confocal (Cy3 and A635P) and STED (A635P) imaging of the filled processes. We found that using less than half of the 3 W of the 775-nm STED laser caused no damage of the thick, resin- embedded tissue, whereas increasing the STED laser power further could damage the resin-embedded tissue. Maximum intensity projection of confocal and STED images of a CA1 PC dendrite demonstrated the superior resolution of the STED mi- croscopy, allowing the discrimination of spines from dendritic shafts (Figures 7A and 7C) and multiple closely spaced spine heads.
We also performed STED imaging of the immunoreactions in 200-nm-thick sections. First, we carried out a Munc13-1 immu- noreaction and developed it with Alexa488- and A635P-coupled sAbs. We acquired confocal images of both Alexa488 and A635P and a STED image of A635P of a presumed IN dendrite.
In the section where the longitudinally cut IN dendrite had the largest diameter, excitatory synapses are aligned in a row on both sides of the dendrite and their orientation is mainly vertical to the cutting plane (Figure 7B). Following the image acquisition, a second round of staining was performed for Munc13-1 (devel- oped with Alexa488 for alignment to the images to the previous
round) and for AMPARs (panAMPAR Ab, developed with A635P).
We reimaged the same IN dendrite and digitally superimposed the images based on the Munc13-1 images. The STED image acquisition with a five orders of magnitude higher intensity illumination power (2–3 W) compared to that of the excitation la- sers (10–100mW) caused no damage of the tissue section. We obtained strong labeling in the 2nd round, demonstrating that our multiplexed method is fully compatible with STED imaging (Figure 7B). In the diffraction-limited confocal images, the sepa- ration of the individual synapses is more problematic than the higher resolution STED images. Such high-resolution imaging also allows the visualization of inhomogeneities in the labeling for Munc13-1 and AMPARs within tangentially cut AZs and PSDs, respectively, that have diameters close to the diffraction limit (Figure 7D).
DISCUSSION
In the present study, we demonstrate the development of a multiplexed, sensitive, diffusion-free, quantitative immunolocali- zation method that is ideal for molecular analysis of functionally characterized individual synapses.
AT is based on multiplexed immunoreactions on a series of acrylic-resin-embedded sections. It was a general wisdom that immunoreactions are superior in acrylic-resin-embedded tissues compared to those obtained in the most widely used epoxy resins. Therefore, most post-embedding EM Figure 5. Quantitative Analysis of Pre- and Postsynaptic Molecules following Presynaptic [Ca2+] Measurements with Two-Photon Micro- scopy
(A) Two-photon maximum intensity projection image of a local axon collateral of a CA1 PC filled with Alexa594 (25mM), Fluo5F (100mM), and biocytin. The scanned boutons (#1–8) are indicated.
(B) Fluorescent [Ca2+] transients in individual boutons evoked by single APs (top panel) or 5 APs (at 40 Hz, bottom panel; arrows indicate APs). Note that single AP- evoked rapid-rising [Ca2+] transients were not detected in boutons #2, 3, 5, and 7.
(C) Confocal image stack of the same axon collateral as in (A) after fixing and embedding in epoxy resin.
(D) High-magnification confocal images of the boutons after resectioning at 200 nm. Bouton numbers correspond to those in (A) and (C). Images are from either single sections (middle and right panels) or maximum intensity projections of 2 consecutive sections (left panel).
(E–G) Immunolabeling for Munc13-1 (E), PSD95 (F), and vGluT1 (G). Open white ROIs indicate the position of the boutons.
(H) Normalized integrated fluorescent intensity values show that boutons with [Ca2+] transients (filled symbols, n = 4) have higher Munc13-1 and PSD95 labeling than boutons without single AP-evoked [Ca2+] transients (open symbols, n = 4), whereas all boutons contain vGluT1.
immunogold localizations of neurotransmitter receptors, struc- tural proteins, or ion channels have been performed on acrylic- resin-embedded tissue (reviewed byNusser, 1999;Ottersen and Landsend, 1997; but seePhend et al., 1995). Here, we also found that without etching the resins, only acrylic-resin- embedded tissues were suitable for localizing synaptic pro- teins, which is in agreement with the results ofCollman et al.
(2015). However, when the resins were etched with Na-ethano- late and were then treated with SDS, a dramatic increase in the strength of reactions was observed. To our surprise, the highest intensity signal was obtained in osmium-free epoxy-resin- embedded tissue (50-fold increase in Durcupan versus LR White).
Embedding tissue into Lowicryl HM20 is usually carried out at low temperatures (90C to45C) in large blocks and requires special equipment, whereas embedding into Durcupan (or other epoxy resins) is performed at room temperature without the need of any special equipment. Embedding into LR White is routinely performed in tissue blocks, and it is not used for so-called flat embedding (i.e., embedding a 60- to 100-mm-thick section be- tween a glass slide and a coverslip), which is essential for LM identification of functionally characterized synapses and their consequent EM or LM molecular analysis. AlthoughValenzuela et al. (2016)identified synapses in LR-White-embedded large tis- sue blocks, it requires the resectioning of the whole block and 3D reconstructing and inspecting the entire tissue block from Figure 6. Identification of Pre- and Postsynaptic Molecules at a Physiologically Characterized Synapse between Two Synaptically Con- nected Neurons
(A) Four APs (at 40 Hz) in a CA1 PC evoke EPSCs in a postsynaptic O-LM IN. The amplitude of the 1stEPSC and the short-term plasticity pattern depend on the extracellular [Ca2+] (2 mM: dark purple, 6 mM: purple) and the presence of phorbol 12,13-dibutyrate (PDBU: 1mM, pink). Traces are averaged from 30 consecutive traces at periods indicated in (B).
(B) Plot of peak amplitude versus stimulus number demonstrates the time course of the effect of 6 mM [Ca2+] and applying PDBU.
(C) Mean peak amplitude versus variance plot (measured for all 4 peak amplitudes in the 3 different conditions: black symbols). Fitting a parabola (red curve) to the data points allows the estimation of the number of functional release sites (N), quantal size (q), initial vesicle release probability (Pv(ini)), and maximum release probability (Pv(max)).
(D) Low-magnification maximum intensity projection of a confocal image stack of the recorded cells (one PC in str. pyramidale and 2 O-LM INs in str. oriens) embedded into epoxy resin. Arrow points to the single contact site between the PC and the IN on the left.
(E and F) Intermediate (E) and high (F) magnification views of the synaptic contact.
(G) The synapse is shown after resectioning at 200 nm. Note that only those dendritic segments are shown that were in focus in (F).
(H) Closest apposition of the biocytin filled bouton and IN dendrite is shown in a single 200-nm-thin section. White outlines help distinguishing the two profiles throughout the immunolabeled images.
(I) The same section was immunolabeled for vGluT1, PSD95, Munc13-1, Bassoon, and Piccolo and for AMPA receptors (panAMPAR Ab) in 3 labeling rounds.
Biocytin is shown with blue, and pre- and postsynaptic molecules are shown with green and red, respectively. vGluT1 immunosignal occupies most of the presynaptic bouton area, whereas the other 3 presynaptic molecules are more restricted toward the apposition of the pre- and postsynaptic structures.
Abbreviations are as follows: str. l-m, stratum lacunosum-moleculare; str. ori., stratum oriens.
thousands of sections, which necessitate special software tools.
Thus, the two key technical developments (etching with Na- ethanolate and antigen retrieval with SDS) allow the use of epoxy resins with all of their advantages but still permit the most effi- cient immunolabeling.
One of the greatest breakthrough of AT, as developed byMi- cheva and Smith (2007), is the demonstration of multiple rounds of immunolabeling (multiplexing), allowing the analysis of dozens of proteins in the same subcellular structures, such as synapses.
The multiplexed immunolabeling requires the elution of the im- munoreagents before the next round of labeling. We repeated the elution method ofMicheva et al. (2010)and found that a 0.2 M NaOH solution removed the epoxy-resin-embedded sec- tions from the glass slides. Fortunately, we found that a 1% SDS solution at 80C efficiently removes (>98%) both the primary Abs and sAbs but keeps the immunogenicity of the tissue intact, al- lowing further rounds of immunolabeling. This efficient elution step is an essential prerequisite of relabeling of the tissue in consecutive labeling rounds with new sets of Abs. Our quantita- tive analysis with 4 synaptic proteins revealed that on average there is no change in the absolute strength of the immunoreac- tions, at least for 4 labeling rounds, ensuring that false negativity in later rounds is not a concern.
An additional benefit of performing the reactions and imaging ultrathin sections is the dramatic increase in spatial resolution with which the reaction can be examined. Diffraction-limited
confocal LM has lateral and axial resolutions of 250 and 600 nm, respectively. By using 3D STED imaging, these reso- lutions can be dramatically (40-fold) reduced to 100 nm in each dimension (e.g., Abberior Expert Line system with a 3-W STED laser). The axial resolution in post-embedding reactions is defined by the thickness of the sections, which was mainly 200 nm in our reactions but can be easily reduced to 70 nm (seeFigure 1C). Thus, when imaging ultrathin sections, we do not need to use 3D but only 2D STED, which has a superior lateral resolution (30 nm) compared to its 3D variant. This re- sults in an additional 16-fold improvement in resolution compared to the 3D STED (30 330 3 70 nm versus 1003 1003100 nm) and a 600-fold improvement compared to con- ventional confocal imaging. Furthermore, imaging ultrathin sec- tions that are in direct contact with the coverslip possess all op- tical means that warrants the best theoretical resolution of LM (e.g., lack of refractive index mismatch in the thick tissue).
Indeed, we regularly achieve lateral resolutions of <35 nm in our tissue sections (Figure 7D) that is close to that (30 nm) measured with fluorescent 20-nm beads.
A major advantage of post-embedding immunoreactions on thin sections is that the immunoreagents do not have to pene- trate into the tissue and proteins in all subcellular locations can be recognized by the Abs. This is in stark contrast to the widely used pre-embedding reactions where molecules embedded into the thick protein matrix of the PSD or axon initial segments Figure 7. Super-Resolution Analysis of Epoxy-Resin-Embedded Neurons and Post-embedding Immunoreactions
(A) Maximum intensity projection image of a confocal (left) and a STED image stack (right) obtained from a 70-mm-thick resin-embedded hippocampal tissue.
Biocytin was visualized with A635P-coupled streptavidin. The white lines indicate the position of the line intensity scans shown in (C).
(B) A putative IN dendrite located in the stratum radiatum is shown for 2 rounds of immunoreactions (1st: Munc13-1, green; 2nd: AMPA receptors, red). The reactions were visualized with A635P. STED image acquisition following the 1stlabeling round does not affect the immunolabeling of the 2ndround. The white lines indicate the positions of the line scans shown in (D), (E), and (F).
(C) Line intensity profiles of the confocal and STED images along the lines indicated in (A). Note that the separation of the spine from the dendritic shaft is impossible in the confocal but clearly possible in the STED image.
(D) Intensity profile along the line indicated in (B) on the confocal and STED images over a strongly AMPA receptor immunoreactive PSD. Note that there is no detectable intensity inhomogeneity in the confocal, but there are 4 well-separated substructures in the STED image.
(E and F) Line intensity profiles across a vertically cut synapse for Munc13-1 (E) and AMPA receptors (F).
remain unreachable for immunoglobulins unless some special antigen retrieval method is applied (Fritschy et al., 1998;Lorincz and Nusser, 2008a,2008b;Watanabe et al., 1998). For example, if antigen retrieval with pepsin treatment is required, the diges- tion of the thick tissue will show a depth-dependent gradient that also precludes quantitative comparisons. Irrespective of whether antigen retrieval is used or not, diffusion into the thick tissue always imposes a gradient in the reaction strength; there- fore, the intensity difference between two subcellular compart- ments does not reflect the difference in their antigen content.
For these reasons, pre-embedding immunoreactions are clearly not quantitative. Probably the best method for comparing the protein content of two distinct membrane areas is FRL (Ma- sugi-Tokita and Shigemoto, 2007;Rash et al., 1998). Here, pro- teins are ‘‘freely’’ hanging out from the replica, as there is no diffusion barrier for the Abs, allowing them to access their target proteins with equal probability. However, because the fracturing of the tissue is random, it seems impossible to direct the frac- turing plane through a functionally characterized synapse, mak- ing this technique inadequate for a direct function and molecular content comparison. The only other diffusion-free immunolocal- ization method is post-embedding immunoreactions on ultrathin sections. Although this method is generally perceived to have lower sensitivity than FRL or the widely used pre-embedding methods, the introduction of etching and SDS treatment dramat- ically improves on this shortcoming while keeping its known advantages.
Probably the most important finding of the present work and the greatest advantage of our method is that it is ideal for per- forming molecular analysis on functionally characterized synap- ses. Here, we provided three sets of experiments as a demon- stration that we could determine the relative protein content of individual synapses after in vitro fluorescent glutamate or [Ca2+] imaging and also following paired recordings. All these de- terminations rely on our ability to visualize intracellularly filled neurons at the LM level in thick resin-embedded sections.
Finding the in vitrotwo-photon imaged bouton strings is not necessarily straightforward, but identifying all synaptic contact between a presynaptic and postsynaptic cell is clearly a formi- dable challenge. This requires a thorough visual inspection of the cells under epifluorescent illumination that lasts for hours.
An important technical point is that the fluorescence of Cy3 mol- ecules in epoxy resin is stable even after hours of constant illumi- nation, allowing consequent confocal and STED imaging. By performing quantitative immunolocalization of functionally char- acterized boutons, here, we revealed that axon varicosities, which do not possess fast-rising, precisely AP time-locked [Ca2+] transients, contain vGluT1-expressing synaptic vesicles but have undetectable presynaptic AZ molecules. Because pre- synaptic Ca2+channels are confined to the AZ, the lack of AZ fully explains the lack of large amplitude, fast rising [Ca2+] tran- sients. Furthermore, we also demonstrated usingin vitrofluores- cent glutamate sensor imaging that thePfof glutamate release from hippocampal CA1 PC axon terminals is inversely propor- tional to the amount of Munc13-1 molecule in the AZ. Finally, us- ing paired recordings and variance analysis, we provided un- equivocal evidence that a single presynaptic AZ of a CA1 PC axon terminal could contain as many as 10 functional RSs.
Post-embedding immunolocalization at single synapse reso- lution will clearly not substitute the widely used high-throughput techniques (e.g., in situhybridization, RT-PCR, RNA-seq, and proteomic analysis) that are capable of monitoring the expres- sion of thousands of genes and proteins. However, these methods do not have the resolution of a single synapse; there- fore, research addressing the molecular mechanism underlying the functional diversity of individual synapses requires a quanti- tative, multiplexed method that has the spatial resolution of a sin- gle synapse. Our currently developed methods are very unlikely to allow the quantitative analysis of the whole synaptome, but dozens of carefully selected, functionally relevant proteins can be quantitatively localized with spatial resolutions of 10s of nano- meters. Thus,in situhybridization, single-cell RNA-seq, and pro- teomic analysis of a large population of synapses paired with this multiplexed post-embedding localization technique form a tech- nical toolbox essential for understanding the molecular mecha- nisms underlying synaptic diversity.
STAR+METHODS
Detailed methods are provided in the online version of this paper and include the following:
d KEY RESOURCES TABLE
d RESOURCE AVAILABILITY B Lead Contact
B Materials Availability B Data and Code Availability
d EXPERIMENTAL MODEL AND SUBJECT DETAILS B Animals
d METHOD DETAILS B Virus injection
B Slice preparation and electrophysiological recordings B Two-photon laser scanning microscopy
B Tissue processing
B Processing of perfusion fixed tissue
B Etching the resin, retrieval and sequential immunofluo- rescent labeling
d QUANTIFICATION AND STATISTICAL ANALYSIS B Quantitative image analysis
B Statistical analyses SUPPLEMENTAL INFORMATION
Supplemental Information can be found online athttps://doi.org/10.1016/j.
celrep.2020.107968.
ACKNOWLEDGMENTS
Z.N. is the recipient of a European Research Council advanced grant (ERC-AG 787157) and a Hungarian National Brain Research Program grant (NAP2.0).
The financial support from these funding bodies is gratefully acknowledged.
We thank Do´ra Ro´nasze´ki for her excellent technical assistance.
AUTHORS CONTRIBUTIONS
N.H., V.K., and Z.N. designed the experiments; V.K. performed the initial post- embedding experiments and analyzed the data; N.H. performed thein vitro functional experiments and the post-embedding experiments on the
functionally characterized synapses; J.H. conducted post-embedding exper- iments, quantitatively analyzed the data, and performed the STED experi- ments; Z.N. wrote the manuscript.
DECLARATION OF INTERESTS
The authors declare no competing interests.
Received: February 24, 2020 Revised: May 15, 2020 Accepted: July 8, 2020 Published: July 28, 2020 REFERENCES
Ali, A.B., and Thomson, A.M. (1998). Facilitating pyramid to horizontal oriens- alveus interneurone inputs: dual intracellular recordings in slices of rat hippo- campus. J. Physiol.507, 185–199.
Atwood, H.L., and Karunanithi, S. (2002). Diversification of synaptic strength:
presynaptic elements. Nat. Rev. Neurosci.3, 497–516.
Biro´, A.A., Holderith, N.B., and Nusser, Z. (2005). Quantal size is independent of the release probability at hippocampal excitatory synapses. J. Neurosci.25, 223–232.
Cane, M., Maco, B., Knott, G., and Holtmaat, A. (2014). The relationship be- tween PSD-95 clustering and spine stability in vivo. J. Neurosci.34, 2075–
2086.
Chabrol, F.P., Arenz, A., Wiechert, M.T., Margrie, T.W., and DiGregorio, D.A.
(2015). Synaptic diversity enables temporal coding of coincident multisensory inputs in single neurons. Nat. Neurosci.18, 718–727.
Collman, F., Buchanan, J., Phend, K.D., Micheva, K.D., Weinberg, R.J., and Smith, S.J. (2015). Mapping synapses by conjugate light-electron array to- mography. J. Neurosci.35, 5792–5807.
Dittman, J.S., Kreitzer, A.C., and Regehr, W.G. (2000). Interplay between facil- itation, depression, and residual calcium at three presynaptic terminals.
J. Neurosci.20, 1374–1385.
E´ltes, T., Kirizs, T., Nusser, Z., and Holderith, N. (2017). Target Cell Type- Dependent Differences in Ca2+Channel Function Underlie Distinct Release Probabilities at Hippocampal Glutamatergic Terminals. J. Neurosci. 37, 1910–1924.
Fritschy, J.-M., Weinmann, O., Wenzel, A., and Benke, D. (1998). Synapse- specific localization of NMDA and GABA(A) receptor subunits revealed by an- tigen-retrieval immunohistochemistry. J. Comp. Neurol.390, 194–210.
Fujimoto, K., Umeda, M., and Fujimoto, T. (1996). Transmembrane phospho- lipid distribution revealed by freeze-fracture replica labeling. J. Cell Sci.109, 2453–2460.
Fuzik, J., Zeisel, A., Ma´te´, Z., Calvigioni, D., Yanagawa, Y., Szabo´, G., Linnars- son, S., and Harkany, T. (2016). Integration of electrophysiological recordings with single-cell RNA-seq data identifies neuronal subtypes. Nat. Biotechnol.
34, 175–183.
Gall, J.G., and Pardue, M.L. (1969). Formation and detection of RNA-DNA hybrid molecules in cytological preparations. Proc. Natl. Acad. Sci. USA63, 378–383.
Gray, E.G. (1959). Axo-somatic and axo-dendritic synapses of the cerebral cortex: an electron microscope study. J. Anat.93, 420–433.
Hell, S.W. (2007). Far-field optical nanoscopy. Science316, 1153–1158.
Holderith, N., Lorincz, A., Katona, G., Ro´zsa, B., Kulik, A., Watanabe, M., and Nusser, Z. (2012). Release probability of hippocampal glutamatergic terminals scales with the size of the active zone. Nat. Neurosci.15, 988–997.
Koester, H.J., and Johnston, D. (2005). Target cell-dependent normalization of transmitter release at neocortical synapses. Science308, 863–866.
Lane, B.P., and Europa, D.L. (1965). Differential staining of ultrathin sections of Epon-embedded tissues for light microscopy. J. Histochem. Cytochem.13, 579–582.
Lorincz, A., and Nusser, Z. (2008a). Cell-type-dependent molecular composi- tion of the axon initial segment. J. Neurosci.28, 14329–14340.
Lorincz, A., and Nusser, Z. (2008b). Specificity of immunoreactions: the importance of testing specificity in each method. J. Neurosci.28, 9083–
9086.
Losonczy, A., Zhang, L., Shigemoto, R., Somogyi, P., and Nusser, Z.
(2002). Cell type dependence and variability in the short-term plasticity of EPSCs in identified mouse hippocampal interneurones. J. Physiol. 542, 193–210.
Marvin, J.S., Borghuis, B.G., Tian, L., Cichon, J., Harnett, M.T., Akerboom, J., Gordus, A., Renninger, S.L., Chen, T.W., Bargmann, C.I., et al. (2013). An opti- mized fluorescent probe for visualizing glutamate neurotransmission. Nat.
Methods10, 162–170.
Masugi-Tokita, M., and Shigemoto, R. (2007). High-resolution quantitative visualization of glutamate and GABA receptors at central synapses. Curr.
Opin. Neurobiol.17, 387–393.
Matsubara, A., Laake, J.H., Davanger, S., Usami, S., and Ottersen, O.P. (1996).
Organization of AMPA receptor subunits at a glutamate synapse: a quantita- tive immunogold analysis of hair cell synapses in the rat organ of Corti.
J. Neurosci.16, 4457–4467.
Meyer, D., Bonhoeffer, T., and Scheuss, V. (2014). Balance and stability of syn- aptic structures during synaptic plasticity. Neuron82, 430–443.
Micheva, K.D., and Bruchez, M.P. (2012). The gain in brain: novel imaging techniques and multiplexed proteomic imaging of brain tissue ultrastructure.
Curr. Opin. Neurobiol.22, 94–100.
Micheva, K.D., and Smith, S.J. (2007). Array tomography: a new tool for imag- ing the molecular architecture and ultrastructure of neural circuits. Neuron55, 25–36.
Micheva, K.D., Busse, B., Weiler, N.C., O’Rourke, N., and Smith, S.J. (2010).
Single-synapse analysis of a diverse synapse population: proteomic imaging methods and markers. Neuron68, 639–653.
Nusser, Z. (1999). A new approach to estimate the number, density and vari- ability of receptors at central synapses. Eur. J. Neurosci.11, 745–752.
Nusser, Z. (2018). Creating diverse synapses from the same molecules. Curr.
Opin. Neurobiol.51, 8–15.
Nusser, Z., Roberts, J.D., Baude, A., Richards, J.G., and Somogyi, P. (1995).
Relative densities of synaptic and extrasynaptic GABAA receptors on cere- bellar granule cells as determined by a quantitative immunogold method.
J. Neurosci.15, 2948–2960.
Nusser, Z., Lujan, R., Laube, G., Roberts, J.D., Molnar, E., and Somogyi, P.
(1998). Cell type and pathway dependence of synaptic AMPA receptor number and variability in the hippocampus. Neuron21, 545–559.
O’Rourke, N.A., Weiler, N.C., Micheva, K.D., and Smith, S.J. (2012). Deep mo- lecular diversity of mammalian synapses: why it matters and how to measure it. Nat. Rev. Neurosci.13, 365–379.
Ottersen, O.P., and Landsend, A.S. (1997). Organization of glutamate recep- tors at the synapse. Eur. J. Neurosci.9, 2219–2224.
Phend, K.D., Rustioni, A., and Weinberg, R.J. (1995). An osmium-free method of epon embedment that preserves both ultrastructure and antigenicity for post-embedding immunocytochemistry. J. Histochem. Cytochem. 43, 283–292.
Pouille, F., and Scanziani, M. (2004). Routing of spike series by dynamic cir- cuits in the hippocampus. Nature429, 717–723.
Pulido, C., Trigo, F.F., Llano, I., and Marty, A. (2015). Vesicular release statis- tics and unitary postsynaptic current at single GABAergic synapses. Neuron 85, 159–172.
Rash, J.E., Yasumura, T., Hudson, C.S., Agre, P., and Nielsen, S. (1998). Direct immunogold labeling of aquaporin-4 in square arrays of astrocyte and ependy- mocyte plasma membranes in rat brain and spinal cord. Proc. Natl. Acad. Sci.
USA95, 11981–11986.
Rubio, M.E., and Wenthold, R.J. (1997). Glutamate receptors are selectively targeted to postsynaptic sites in neurons. Neuron18, 939–950.