Full Terms & Conditions of access and use can be found at
https://www.tandfonline.com/action/journalInformation?journalCode=iphb20
ISSN: 1388-0209 (Print) 1744-5116 (Online) Journal homepage: https://www.tandfonline.com/loi/iphb20
Rhodiosin and herbacetin in Rhodiola rosea preparations: additional markers for quality control?
Zoltán Péter Zomborszki, Norbert Kúsz, Dezső Csupor & Wieland Peschel
To cite this article: Zoltán Péter Zomborszki, Norbert Kúsz, Dezső Csupor & Wieland Peschel (2019) Rhodiosin and herbacetin in Rhodiola�rosea preparations: additional markers for quality control?, Pharmaceutical Biology, 57:1, 295-305, DOI: 10.1080/13880209.2019.1577460 To link to this article: https://doi.org/10.1080/13880209.2019.1577460
© 2019 The Author(s). Published by Informa UK Limited, trading as Taylor & Francis Group.
Published online: 29 Jul 2019.
Submit your article to this journal
Article views: 58
View Crossmark data
RESEARCH ARTICLE
Rhodiosin and herbacetin in Rhodiola rosea preparations: additional markers for quality control?
Zoltan Peter Zomborszkia,b, Norbert Kusza,b, Dezs}o Csupora,band Wieland Peschelc
aFaculty of Pharmacy, Department of Pharmacognosy, University of Szeged, Szeged, Hungary;bInterdisciplinary Centre for Natural Products, University of Szeged, Szeged, Hungary;cEuropean Medicines Agency, London, UK
ABSTRACT
Context: Rhodiola rosea L. (Crassulaceae) is well-known to contain flavonoids such as the herbacetin derivative rhodiosin. However, flavonoids are not typically used in quality control.
Objective:This study analyses two flavonoids ofR. rosearhizomes and roots for their potential as analyt- ical markers.
Materials and methods:Two constituents were isolated from ethanolic extracts via HPLC, identified via NMR and quantified via RP-HPLC. Presence and content variation was investigated according to extraction (solvent and repetitions), drying (temperature and duration) and sample origin (homogenously cultivated plants of different provenance, commercial samples).
Results:Rhodiosin was identified as a main flavonoid, accompanied by 10-fold lower concentrated herba- cetin. Both compounds were best extracted with 70–90% ethanol, but were also detectable in more aqueous extracts. Different drying conditions had no effect on the flavonoid content. These two flavo- noids were consistently identified in rhizome and root extracts of over 100 R. roseasamples. Rhizomes tend to contain less flavonoids, with average ratios of rosavins to flavonoids of 1.4 (rhizomes) and 0.4 (roots). Provenance differences were detected in the range (rhodiosin plus herbacetin) of 760–6300mg/mL extract corresponding to a maximum of approximately 0.5–4.2% (w/w) in the dry drug.
Conclusions: For the first time, two main flavonoids present inR. rosea were quantified systematically.
Rhodiosin and herbacetin can be detected simultaneously to phenylpropenoids or salidroside in authentic samples, influenced by the plant part examined and the plant origin. Rhodiosin and herbacetin may serve as additional marker to guarantee a consistent content ofR. roseaproducts.
ARTICLE HISTORY Received 13 June 2018 Revised 21 November 2018 Accepted 15 January 2019 KEYWORDS
HPLC; flavonoid
Introduction
Rhodiola roseaL. (Crassulaceae) is one of the well-known plants of a group of so-called adaptogens. Derived products are used for various medicinal purposes linked to stress-related acute and chronic conditions, including mental and physical perform- ance, ageing and cancer development (Chiang et al. 2015).
Pharmacopoeia-specified standardization of products currently focuses on salidroside, a phenylethanoid found in all species of the Rhodiola genus besides some other plant species, as well as on phenylpropenoids characteristic of R. rosea and typically expressed as total rosavins.
Other constituents ofRhodiola species have occasionally been suggested to potentially contribute to pharmacological activities including the aglycon of the phenylpropenoids cinnamyl alcohol (CA) (Peschel et al.2016), monoterpene glycosides such as rosir- idin (van Diermen et al.2009), gallic acid derivatives such as epi- gallocatechin-3-gallate (Chen et al. 2015) or lignans and some flavonoids including rhodiosin (1) (Zhou et al.2015).
Flavonoids are common constituents of many herbal drugs, present mainly in traditional extracts using ethanol/water mix- tures. Their reasonable stability and easy detection often make them the parameter of choice for standardization. Several
flavonoids have been isolated from Rhodiola species and have been reported previously. These include herbacetin and its glyco- sides including 3,7-dimethylherbacetin, rhodiosin (herbacetin-7- O-glucorhamnoside), rhodionin (herbacetin-7-O-a-L-rhamnopyr- anoside), rhodalgin (herbacetin-8-O-a-L-arabinopyranoside), rhodioni- din (herbacetin-7-O-a-L-rhamnopyranosyl-8-O-b-D-glucopyranoside), rhodalin (herbacetin-8-O-b-D-xylopyranoside), rhodalidin (herba- cetin-3-O-b-D-glucopyranosyl-8-O-b-D-xylopyranoside), rhodiolin (a flavolignan of herbacetin); tricin and its glycosides, as well as the gossypetin glycosides rhodiolgin (gossypetin-7-O-L-rhamno- pyranoside) and rhodiolgidin (gossypetin-7-O-a-L-mannopyrano- sil-8-O-b-D-glucopyranoside) (Kurkin et al. 1982, 1984a, 1984b;
Zapesochnaya and Kurkin1983; Zapesochnaya et al.1985).
Regarding R. rosea, the isolated flavonoids are usually glyco- sides of kaempferol, gossypetin and herbacetin (2). In total, approximately 20 flavonoids have been described from this spe- cies, including tricin, herbacetin, gossypetin and their glycosides found in leaves/flowers/aerial parts, as well as flavonolignans and herbacetin found in underground parts, i.e., in rhizome or root (Zapesochnaya and Kurkin1983; Zapesochnaya et al.1985).
While some flavonoids, e.g., herbacetin are present in several families (e.g., Asteraceae, Gnaphilieae, Linaceae, Lauraceae, Atripliceae) (Wollenweber et al. 1997; El-sayed et al. 1999;
CONTACT Wieland Peschel wieland.peschel@ema.europa.eu European Medicines Agency, 30 Churchill Place, Canary Wharf, London E14 5EU, UK; Dezs}o Csupor csupor.dezso@pharm.u-szeged.hu Faculty of Pharmacy, Department of Pharmacognosy, University of Szeged, H-6720 Szeged, E€otv€os u. 6. Hungary.
ß2019 The Author(s). Published by Informa UK Limited, trading as Taylor & Francis Group.
This is an Open Access article distributed under the terms of the Creative Commons Attribution License (http://creativecommons.org/licenses/by/4.0/), which permits unrestricted use, distribution, and reproduction in any medium, provided the original work is properly cited.
2019, VOL. 57, NO. 1, 295–305
https://doi.org/10.1080/13880209.2019.1577460
Stewens et al.1999; Fliniaux et al. 2014; Wei et al.2017) others seem to be typical for Rhodiola species. These specific com- pounds, including rhodionin and rhodiosin, possess a specific sugar moiety such as the 3-O-b-D-glucopyranosyl-L-rhamnopyra- nose residue named ‘rhodiose’ after the first isolation works in Russia in the 1980s (Kurkin et al. 1982; Zapesochnaya and Kurkin1983).
Like other flavonoids, herbacetin and derivatives showin vitro and in vivo effects that are linked to the multiple hydroxyl groups responsible for radical scavenging properties (Kwon et al.
2009; Qiao and Liu 2013) and associated with unspecific effects on membrane structures and enzyme activities related to cancer genesis and progression (Nakamura et al. 2007; Hyuga et al.
2013; Qiao et al. 2013), metabolism (Kobayashi et al.2008) and other physiological and/or pathological processes (Jeong et al.
2009; Li et al.2015,2016).
While flavonoids in R. rosea are known, their quantity was never investigated in view of more unique and interesting char- acteristic constituents such as rosavin or salidroside. Hence, typ- ical extracts for medicinal use have never been systematically studied in this regard either. In fact, flavonoids may not only contribute to some activities, but also give an additional analyt- ical option to guarantee identity, purity and consistent content of medicinal products. Therefore, our research focused on identi- fying two main peaks with flavonoid UV spectra as potentially characteristic forR. roseaextract fingerprints following indicators from our previous studies. These two substances were isolated via HPLC and their structures were determined by NMR analysis and compared with literature data. We aimed to extend and val- idate a previously described HPLC method for the quantitative analysis in order to study the influence of extraction solvent, plant part, drying process and drug origin (different plant prove- nances, marketed drugs and products) on the flavonoid content.
The overall goal of our study was to get a quantitative overview of the main flavonoids present inR. rosea in comparison to the conventional standards salidroside and rosavins.
Materials and methods Plant and reference materials
Rhizome, root and herb samples were obtained from own cultiva- tion as previously described (Peschel et al.2016, 2018). Plants ori- ginate from diverse natural habitats, and voucher specimens have been deposited at the herbarium of the Biologiezentrum der Ober€osterreichischen Landesmuseen (Linz, Austria).
Marketed commodities including four dried herbal drugs (I:
‘Rhizomata et radices Rhodiolae rosea’, 50 g cut pieces, Barnaul, Russia; II: unlabeled drug from a market stand, 40 g cut pieces, Barnaul, Russia; III: ‘Rhodiola rosea (rhizoma)’, 50 g cut pieces, Gorno-Altaisk, Russia; IV: ‘Rhodiolae radix concisus’, 500 g, Gittelde, Germany) and two products (I: Rhodiola rosea extract, 36.7 g/100 g powder in capsules, Germany); II: ‘Arctic root – Rhodiola rosea’, powder in capsules, originating from UK/sold in Szeged, Hungary) were studied. For the quantitative HPLC analysis, rhodiosin was purchased from Carbosynth (Compton, UK) and herbacetin was purchased from Phytolab (Vestenbergsgreuth, Germany).
Processing and extraction
Plants were harvested, separated into different plant parts, cut, dried, stored, powdered and extracted as previously described
(Peschel et al. 2013, 2016, 2018). Experimental variations in extraction/drying procedures or sample processing are explained below. The routine sample preparation for the quantitative ana- lysis involves the following parameters: cutting before drying (2–6 cm, maximum 1 cm thick); drying temperature: 45C; dry- ing duration: 6 days; powder particle size before extraction:
0.8–0.15 mm; extraction solvent: 70% ethanol (EtOH); drug to solvent ratio: 1:5; 5 days maceration at room temperature with shaking for 2 h at start and another 30 min at the end, followed by centrifugation.
Isolation of flavonoids
For the isolation of flavonoids, 70% EtOH extracts of rhizome/
root were combined. The isolation process was carried out using a Waters HPLC system comprising a Waters W600 pump, a W600 controller and a Waters 2487 dual channel UV detector, controlled by Empower software. A Kinetex XB-C18, (5 mm, 2504.6 mm) column was used as the stationary phase. The mobile phase consisted of water (A) and acetonitrile (B). Elution was started with 83% A/17% B (1 min), then it was changed to 72% A/28% B (10 min) and to 50% A/50% B (5 min), followed by methanol washing for 5 min and another 5 min equilibration with the starting eluent. At 12 and 13 min, two main peaks were detected with UV spectra characteristic to flavonoids (UV kmax
274, 328, 380 nm and 274, 328, 380 nm, respectively). These com- pounds were isolated by the HPLC method described above.
Samples containing remarkable amounts of these compounds were pooled, evaporated and re-dissolved to gain a solution con- taining approx. 10 mg/mL of the index compounds. Forty injec- tions (20 mL each) were carried out and the two peaks were separately collected. The purity of these two fractions was con- firmed by HPLC and the identity of the evaporated compounds was elucidated by NMR.
Identification of the isolated flavonoids
NMR spectra were recorded in methanol-d4 on a Bruker Avance 600 III spectrometer (1H: 600.13 MHz;13C: 150.9 MHz) equipped with a 5 mm cryo-TXI probe. The peaks of the residual solvent (dH 3.31; dC 49.00) were taken as reference points. Chemical shifts are expressed in parts per million, and coupling constants (J) values are reported in Hz. Data were acquired and processed with the MestReNova v6.0.2-5475 software.
Compounds 1 and2 were identified as rhodiosin and herba- cetin, respectively, based on the comparison of their 1H and 13C spectral data with those in the literature (Nawwar et al. 1984;
Jeong et al.2009).
HPLC quantitative analysis and validation
Rhodiosin (1) and herbacetin (2) were determined by external standard calibration using HPLC equipment, conditions and assay previously described, with an extension of running time and detection to 37 min (Peschel et al. 2016). Peaks were well separated and showed similar UV/VIS spectra (1: tR 35.5 min, UV kmax 274, 328, 380 nm; 2: tR 36.2 min; UV kmax 274, 328, 380 nm). As the most suitable wavelength, UV k¼254 nm was chosen for the analysis. Concentrations of 1 and 2 were deter- mined in duplicate from three samples each, and expressed in lg/mL macerate (mean ± SD, N¼3). Experimental variations (if any) are given below.
Validation
Limits of detection (LOD) and quantification (LOQ) were eval- uated by the Shimadzu# LabSolutions (version 5.82) software.
Precision was checked by repeated measurements of standards at a medium (100lg/mL) concentration on the same day (intra- assay precision) and on three different days (inter-assay preci- sion) (for R.S.D values see Table 1). Linearity was determined using six different concentrations per reference standard in the range of 6.16–308.0lg/mL for 1 and 3.44–172.0lg/mL for 2, with a linear relationship as given in Table 1. Accuracy was checked by spiking of a flavonoid-low extract with 50%, 100%
and 150% of the native amounts of1and2.
Derived parameters
Besides the absolute values of1and2(lg per mL liquid hydroe- thanol extract), we have also calculated the sum of both flavo- noids (FLAVtot) and the ratio of flavonoids to phenylpropenoid, as well as the ratio of flavonoids to phenylethanoid compounds which are usually used for the standardization ofR. rosea; these ratios served as relative parameters. Corresponding data for rosa- vins (expressed as ROStot: sum of rosavin, rosarin and rosin) and their aglycon trans-CA (PPtot: total phenylpropenoids¼total rosavins þ CA), as well as for salidroside and its aglycon (SALtot, sum of salidroside and tyrosol) were available and reported previously (Peschel et al.2016,2018).
For a comparison with literature data, we have also estimated the approximate amount of 1 and2 in the original herbal drug (% w/w in the dry drug) based on the yield of the extraction process (see below) and on the drug to solvent ratio (% w/w flavonoids in dry drug¼x mg/mL1.335 mL/g/10). For example, a tincture containing 1.0 mg/mL flavonoids approxi- mately corresponds to a maximum of 0.66% flavonoids (w/w) in the original dry drug.
Influence of solvent and extraction procedure Influence of solvent polarity
Five different extracts were prepared (N¼3) using water, EtOH 30%, 50%, 70% and 90% v/v, respectively (all of analytical grade, Molar Chemicals, HU) for three drug samples of the same prov- enance (rhizome of a 4-year-old plant, UK cultivation; rhizome and root of a 6-year-old plant, Austrian cultivation) and flavon- oid content was expressed inlg/mL (mean ± SD,N¼3).
Extraction process repetition
In order to check how efficient and exhaustive a single extraction process is, it was repeated thrice. The same three samples (two rhizome, one root) using four different extraction solvents (330% EtOH, 350% EtOH, 370% EtOH, 390% EtOH) were after the first extraction (M1) additional three times (M2–4) macerated with fresh solvent after filtering and drying
the drug sample following the first and each following extraction.
1 and 2 contents (mean ± SD of measurement in duplicate of three samples each) of all four repetitions were compared.
Influence of plant part used
From three authentic provenances (RR-I, RR-II, RR-III) and a previously identified non-authentic provenance (hybrid R-IV), three 5-year-old plants (three individual plants, each cultivated in the UK and harvested in July) were split into herb, rhizome and root, dried at 45C, ground (mesh diameter: 0.8–1.5 mm) and 5 g of each sample was finally extracted with 25.0 mL 70%
EtOH for 5 days (see above). Contents of 1 and 2 were deter- mined and expressed inlg/mL macerate (mean ± SD,N¼3).
Influence of the drying procedure
Drying temperature: Two 5-year-old plants from five randomly chosen provenances (I–V, 7-year-old plants, cultivated in Austria, harvested in July) were split into rhizome and root.
Each of the cut samples (2–6 cm, maximum 1 cm thick) were halved; one half was dried at 45C and the other one at 65C using warm air ventilation for 5 days, yielding four root and four rhizome samples at each temperature per provenance. Dry samples were ground and extracted as described above. Contents of 1 and 2 were determined and expressed in lg/mL macerate (mean ± SD of two plants, two samples each,N¼4).
Drying duration: Two 4-year-old plants from two randomly chosen provenances (VI–VII, 6-year-old plants, Austrian cultiva- tion, harvested in October) were split into rhizome and root.
Each sample was halved; one half was cut into smaller pieces (1–4 cm, maximum 0.5 cm thick) and the other half was cut into bigger pieces (3–8 cm, maximum 1.5 cm thick). All samples were split again, yielding four root and four rhizome samples for both sizes per provenance. Samples were dried at 20C at moderate air ventilation (fine-cut samples: 10 days, coarse-cut samples:
30 days). Dry samples were ground and extracted as described above. The content of 1and2 was determined and expressed in lg/mL macerate (means ± SD,N¼4).
Influence of drug origin–commodities of commerce
Four marketed herbal drug samples (drug I–IV) and two prod- ucts (prod I, II) were extracted as described above. In case of the commercial products, the powdered content of the capsules was directly used for extraction regardless of the excipients or any other possible ingredients contained. For each sample, two mac- erates were prepared and measured in duplicate.
Influence of drug origin–plants of different provenances Roots and rhizome samples from 9-year-old cultivated plants of 18 provenances (p01–p17 authenticated R. rosea, p18 an unknown species) and two wild alpine plants of unknown age
Table 1. Validation data for quantitative determination of rhodiosin (1) and herbacetin (2).
R2 Regression equation Range (mg/mL) LOD (lg/mL) LOQ (lg/mL) R.S.D.a(%,n¼6) R.S.D.b(%,n¼6)
Rhodiosin 0.9989 y¼2Eþ06x–151221 0.00616–0.308 47.02 156.72 0.28 0.41
Herbacetin 0.9958 y¼2Eþ06xþ336128 0.00344–0.172 7.60 25.35 1.38 2.47
aIntra-assay precision within one analytical run 6 injections.
bBetween-assay precision at three different days (each sample in duplicate).
(p19, p20) from the Eastern Alps were previously described and studied focusing on rosavins, CA and salidroside contents (Peschel et al. 2018). We grouped and analysed data as follows:
(a) the average of the whole sample matrix of cultivated authen- tic R. rosea from 17 provenances, (b) means (N¼3,±S.E.M.) of all provenances (N¼20) and (c) means of five provenance groups: North Western European Islands (NW; N¼4), North Eastern Europe (NE, N¼3), Alps/Pyrenees (ALP/PYR; N¼6), Southern Siberia (ALTAI,N¼4), plus the two provenances from the Eastern Alps (wild Alp). The experimental design, sampling and analysis have been described previously (Peschel et al.2018).
Statistical analysis
Nvalues for 1þ 2were calculated as means of HPLC measure- ments carried out in duplicate. All samples tested were prepared in triplicate (with few exceptions prepared in duplicate only), and results were calculated as mean ± SD per treatment/variable factor. For provenance comparison, means ± S.E.M. were calcu- lated for (I) all individual plants (N¼51), (II) three individual plants of each genotype (N¼17) and (III) five geographical region groups with divergentN. For geographical region groups, significance was tested for each compound parameter using two- way ANOVA with or without Tukey’s post-test (R-3.2.1 soft- ware) and results are indicated with different letters for those groups withp<0.05.
Results and discussion
Isolation, identification and assays of 1 and 2
The isolation procedure using a dry pooled extract (root plus rhizome) yielded 5.24 mg of 1 and 3.41 mg of 2. Preliminary identification of the compounds was carried out by comparing the UV spectra of 1 and 2 with analytical standards. Structure validation was carried out via NMR analysis using a Bruker Avance 600 III spectrometer (1H: 600.13 MHz;13C: 150.9 MHz).
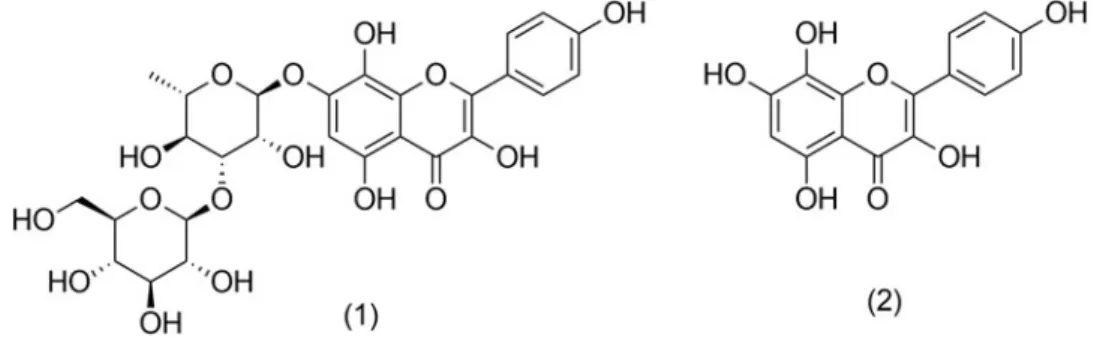
Although the presence of several other flavonoids has been reported forRhodiolaspecies previously, we focused on 1 and2 for possible quantitative analysis (Figure 1).
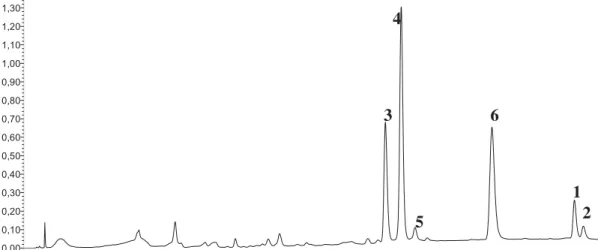
Via the extension of our previously described HPLC method (Peschel et al. 2016), 1 and 2 (tR: 35.5 36.2 min, respectively, Figure 2) could be detected baseline-separated from other peaks.
Despite a prolonged run time of the analysis, simultaneous detection to rosavins and salidroside is advantageous for a HPLC fingerprint, as well as for quantitative determination.
Regarding the assay, detection may be accomplished at several wavelengths including 254 nm (used for rosavins and CA detec- tion) and 275 nm (used for salidroside and tyrosol detection) without major differences in results despite baseline deviations.
Precision, linearity and accuracy were checked for both 254 nm and 275 nm detections (Table 1). The LOD was 47.02lg/mL and 7.60lg/mL for 1and2, respectively, with a signal to noise ratio of 3. The LOQ was 156.72lg/mL and 25.35lg/mL, respect- ively, with a signal to noise ratio of 10. Recovery rates were 84.66, 89.51 and 93.25% for1and 56.42, 64.99 and 75.54% for2 at 50, 100 and 150%, respectively.
Extraction of 1 and 2
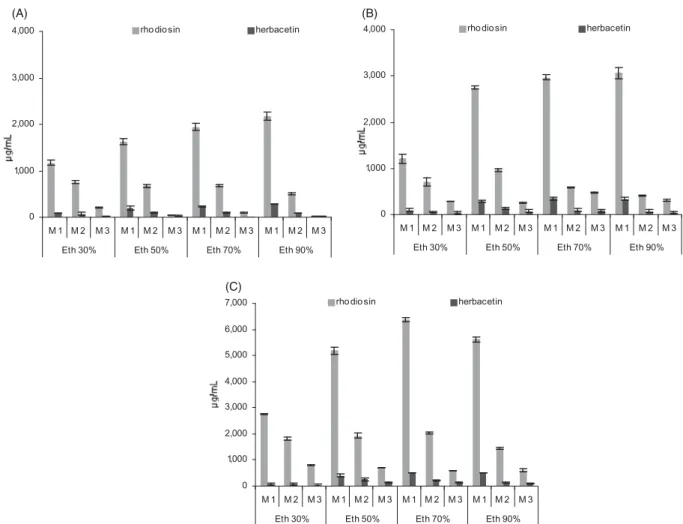
Traditional Rhodiola tinctures and dry extracts used in contem- porary products are commonly based on hydro-ethanol extrac- tion. Regarding the tested range of five solvents, the flavonoids of interest were best extracted with 70–90% EtOH, slightly less with 50% EtOH and considerably less with 30% EtOH (Figure 3). Flavonoids were still detectable in pure aqueous extracts, but were below the LOQ in our setting (not included in graph).
These findings suggest that commonly available extracts (40–70%
EtOH) should contain detectable amounts of flavonoids besides rosavins and salidroside, but these may not be optimally extracted. We used 70% EtOH for our screening, which is gener- ally used for an optimized phenylpropenoid yield as previously reported. We found a higher flavonoid content in roots than rhi- zomes independent of the extraction solvent, while phenylprope- noids were found to be less concentrated in the roots (Peschel et al.2016).
Using 70–90% EtOH, approximately 75% of the total extract- able amount was obtained in a single extraction process (5-day maceration). A nearly exhaustive extraction was reached with two follow-up macerations. A fourth repetition did not yield relevant extra amounts (<1% of total yield) and was often below the LOQ. These data indicate that for the maximum extraction of 1 and 2 from dried plant samples 70–90% EtOH and 2–3 repeated extractions may be appropriate, allowing to determine the total flavonoid content which could be suitable, e.g., for plant characterization or root/rhizome assays for pharmaceutical start- ing materials or powdered drugs directly used in commercial products. For our screening purpose, the single maceration, yielding consistently about 75% of the total flavonoid content was considered to be suitable to compare the 70% EtOH extracts of tested samples.
Flavonoid content of different plant parts
The flavonoid content of the herb was found to be rather low (<400lg/mL in the extract, corresponding to cca. 0.2% in the dry drug) compared to rhizome and root, whose extracts usually con- tained at least 1800–2400lg/mL of flavonoids (corresponding to 1.2–1.6% in dry drug) for our sample set (Figure 4). Irrespective of
Figure 1. Structure of rhodiosin (1) and herbacetin (2).
the plant part analysed, both1and2are always detected, and1is usually 5- to 10-fold concentrated compared to2.
A hybrid accession (R-IV) previously described as having deviating morphological characteristics and exceptionally low
amounts of phenylpropenoids (Peschel et al. 2013, 2016) also contained 1 and 2 in the rhizome in lower concentrations than in the authentic provenances. Consequently, testing sim- ply for the presence/absence of 1 and 2 (as a qualitative
AU
0,00 0,10 0,20 0,30 0,40 0,50 0,60 0,70 0,80 0,90 1,00 1,10 1,20 1,30
Minutes
0,00 2,00 4,00 6,00 8,00 10,00 12,00 14,00 16,00 18,00 20,00 22,00 24,00 26,00 28,00 30,00 32,00 34,00 36,00
AU
0,00 0,10 0,20 0,30 0,40 0,50 0,60 0,70 0,80 0,90 1,00
Minutes
0,00 2,00 4,00 6,00 8,00 10,00 12,00 14,00 16,00 18,00 20,00 22,00 24,00 26,00 28,00 30,00 32,00 34,00 36,00
AU
0,00 0,05 0,10 0,15 0,20 0,25 0,30 0,35 0,40 0,45 0,50 0,55 0,60 0,65
Minutes
0,00 2,00 4,00 6,00 8,00 10,00 12,00 14,00 16,00 18,00 20,00 22,00 24,00 26,00 28,00 30,00 32,00 34,00 36,00
1 3
2 4
4
6
1
5 6 5
3
1 2 2
(A)
(B)
(C)
Figure 2. HPLC chromatogram (k¼254 nm) for the simultaneous determination of 1 and 2 alongside characteristic phenylpropenoids inR. rosea(1, rhodiosin;2, her- bacetin;3, rosarin;4, rosavin;5, rosin;6, cinnamylalcohol). (A) AuthenticR. rosearhizome; (B) authenticR. rosearoot; (C) non-identifiedRhodiolaspecies root.
fingerprint) may not be suitable for identification of the spe- cies; however, when quantified, particularly low amounts of flavonoids can indicate quality issues such as admixtures of otherRhodiolaspecies. In contrast to other root/rhizome com- parisons in this study, amounts of 1 and 2 were largely equal in both plant parts, while elsewhere root extracts exhibited often more than double the amount than rhizome extracts.
Reasons for these differences are not obvious, but this phe- nomenon might be linked to a deviating cultivation site and harvest time.
Influence of the drying procedure
Different temperatures applied during drying (45 versus 65C for 5 days), as well as different drying durations according to cut size (10 days versus 30 days at room temperature) did not affect the flavonoid content (Figure 5). Contents of1and2were more influenced by plant provenance and the plant part used. The largely consistent ratios of 1 and2 also suggest that both flavo- noids are stable and are not affected by drying temperature or potential post-harvest enzymatic degradation.
0 1,000 2,000 3,000 4,000
M 1 M 2 M 3 M 1 M 2 M 3 M 1 M 2 M 3 M 1 M 2 M 3
Eth 30% Eth 50% Eth 70% Eth 90%
rho dio sin herbacetin
0 1,000 2,000 3,000 4,000
M 1 M 2 M 3 M 1 M 2 M 3 M 1 M 2 M 3 M 1 M 2 M 3
Eth 30% Eth 50% Eth 70% Eth 90%
rho dio sin herbacetin
0 1,000 2,000 3,000 4,000 5,000 6,000 7,000
M 1 M 2 M 3 M 1 M 2 M 3 M 1 M 2 M 3 M 1 M 2 M 3
Eth 30% Eth 50% Eth 70% Eth 90%
rho dio sin herbacetin
(A) (B)
(C)
Figure 3.Influence of the extraction solvent on extraction efficiency. Contents of1and2in rhizome (A, B) and root samples (C), each extracted with four different solvents and three successive macerations M1–M3 (n¼3 each, mean ± SD).
Rhizome Root Herb
0 500 1,000 1,500 2,000 2,500
RR-I RR-II RR-III R-IV rho dio sin herbacetin
0 500 1,000 1,500 2,000 2,500
RR-I RR-II RR-III R-IV rho dio sin herbacetin
0 500 1,000 1,500 2,000 2,500
RR-I RR-II RR-III R-IV rho dio sin herbacetin
Figure 4. Flavonoid concentrations in 70% EtOH extracts from rhizome, root and herb of four different provenances (N¼3 each, mean ± SD).
Flavonoid content of marketed commodities
In all samples of marketed Rhodiola drugs and products 1 and 2 were detected in very different quantities (Figure 6). For a better comparison of extract profiles, the flavonoid content is presented alongside previously determined contents of rosavins, CA and sali- droside. Three drug samples originating from Russian markets and shops containing a visibly major rhizome portion showed similar profiles. In contrast, the drug sold as Rhodiolae radix concisus had lower amounts of1 and2(less concentrated than salidroside), but most obviously it contained no phenylpropenoids. This finding confirms that ‘Rhodiolae radix’ does not equal ‘Rhodiolae roseae rhizoma et radix’, and that otherRhodiolaspecies are also marketed without specifying the exact species. Also product I (a mixture of powder and a 70% EtOH extract) was found to have a moderate flavonoid content, whereas product II showed very low amounts of 1, 2and phenylpropenoids, but a high salidroside content. In this case, it is assumed thatR. rosea is only a minor part of the active substance, while either salidroside is added or otherRhodiola spe- cies prevail despite the product being labelled asR. rosea.
Flavonoid content in homogenously cultivated plants of different provenances
On average, rhizome and root extracts of 51 simultaneously har- vested 9-year-old plants (cultivated in the Eastern Alps) from 17,
mainly European provenances contained 1800 and 3100 mg/mL flavonoids, respectively (Table 2). This means that our extraction method yielded rhizome extracts with slightly more species-char- acteristic rosavins than flavonoids, while root extracts contained more flavonoids than rosavins. Since phenylpropenoid values (ROStot þ CA) are usually higher in rhizomes than in root, as previously reported, the ratio of rosavins to flavonoids differ sub- stantially between these two plant parts (1.4 and 0.4, respect- ively). Notably, in our 70% EtOH extracts the quantities of flavonoids usually surpass those of salidroside, the common standardization parameter for allRhodiolaspecies.
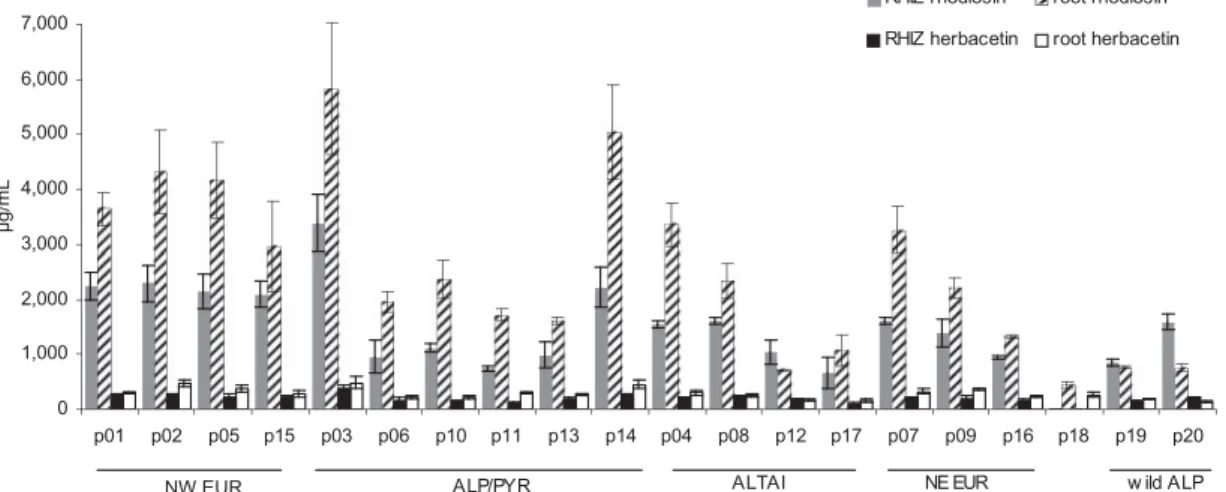
As per provenance, mean flavonoid values were in the range of 760–3800 mg/mL in rhizomes and 880–6300 mg/mL in roots (Figure 7). Thus, 1 þ 2 (with a consistent ratio of about 10:1) were detected in all cultivated provenances and in those collected from the wild. They were also found, but in lower amounts, in the root extracts of the unidentified species p18, albeit with a divergent ratio of1and2(1.6:1). Provenances with a particularly high flavonoid content in rhizome (>2000 mg/mL) or root (>3000mg/mL) or in both, originate from diverse locations such as the Pyrenees (p03), the Alps (p14), NW European Isles (p01, p02, p05) and Russia (p04, p07). Also those with a lower flavon- oid content (1000mg/mL in rhizome or2000 mg/mL in root) are from different habitats: Southern Siberia (p12, p16), Finland (p16) and all cultivated and collected plants from the Alps (p06, p10, p11, p13, p19, p20).
0 1,000 2,000 3,000 4,000
45ºC 65ºC 45ºC 65ºC 45ºC 65ºC 45ºC 65ºC 45ºC 65ºC
I II III IV V
rho dio sin herbacetin
R hizo me
0 1,000 2,000 3,000 4,000 5,000 6,000 7,000 8,000
45ºC 65ºC 45ºC 65ºC 45ºC 65ºC 45ºC 65ºC 45ºC 65ºC
I II III IV V
rho dio sin herbacetin
R o o t
0 1,000 2,000 3,000 4,000 5,000
fine cut 10d
co arse cut 30d
fine cut 10d
co arse cut 30d
fine cut 10d
co arse cut 30d
fine cut 10d
co arse cut 30d VI rhiz VII rhiz VI ro o t VII ro o t
rho dio sin herbacetin
R hizo me R o o t
(A) (B)
(C)
Figure 5. Flavonoid concentrations in rhizome and root extracts (70% EtOH) according to (AþB) drying temperature for five different provenances (I–V) and (C) dur- ation of drying for two different provenances (VI–VII) (N¼3 each, mean ± SD).
Despite such diversity found according to regional groups, the rhizomes and roots of R. rosea of NW European origin con- tained significantly more flavonoids than any of the other four groups (Figure 8). In Alpine provenances, it was generally low, but mean values were affected by two obvious high-flavonoid outliers from the Pyrenees and Swiss Alps. It suggests that prov- enance does play a role, i.e., plant genetics might influence the flavonoid content. However, the groups arbitrarily formed according to the main geographical area of origin may not be suitable alone to predict flavonoid contents. More provenances, ideally of the same age and cultivated under equal conditions, are required to confirm the trends observed here. Local variants with particularly high or low quantities of flavonoids can be assumed.
In order to understand the relevance of flavonoid quantifica- tion for analytical standardization, we compared the amounts of the two measured flavonoids with the levels of phenylpropenoids (rosavins plus aglycon CA) and salidroside (plus aglycon tyrosol) (Figure 8). For all regional groups the flavonoid content of
rhizome extracts was in a similar range as that of rosavins (PPtot/FLAVtot ratio 0.9–1.8). In root extracts, flavonoids had at least double amounts of rosavins across all cultivated geograph- ical sources with the exception of the plants collected from the wild (PPtot/FLAVtotratio 0.3–1.2).
These results emphasize the relevance of rhizome/root por- tions in a given drug. Nonetheless, the ratios of flavonoids to other compounds currently used for quality assurance are rea- sonably consistent within the whole species, and also as per genotype. Hence, the analysis of flavonoids is to certain extent an indicator for the whole phenolic spectrum. Our data suggest that a sample of underground parts containing less than 500mg/mL of 1(þ2) in a derived 70% EtOH extract (corresponding to about 0.33% in the dry drug) is unlikely to be R. rosea or of otherwise compromised quality.
The relative variation of the main characteristic constituents according to rhizome/root proportion and provenance is also an important issue to understand the possible divergent effects reported in pharmacological or clinical studies. Summarizing our
0 1,000 2,000 3,000 4,000
Drug I Drug II Drug III Drug IV P ro d I P ro d II
ROS to t CA SA L to t rho dio sin herbacetin
Figure 6.Concentrations of1and2in 70% EtOH extracts from marketed commodities (four dried herbal drugs and two products) of different origin, also showing their content in rosavins (ROStot), cinnamyl alcohol (CA) and salidroside (SALtot) (N¼2, mean ± SD).
Table 2. Content of1and2in 70% EtOH extracts from rhizomes and roots ofR. roseacultivated at 1580 m in Eastern Austria (n¼3, mean ± S.E.M., range of 51 samples across provenances p01–p17 harvested in May year 9).
Rhizome Root
Mean (±S.E.M.)
Range (min–max)
Mean (±S.E.M.)
Range (min–max) Rhodiosin (1)
(lg/mL)
1586 (±211)
159–4885 2817
(±450)
216–8606 Herbacetin (2)
(lg/mL)
211 (±20)
53–547 308
(±34)
69–862 FLAVtot(1þ2)
(lg/mL)
1797 (±230)
220–5431 3125
(±482)
285–9468 ROStot
a
(lg/mL)
1842 (±207)
530–4273 980
(±118)
361–2494 PPtotb
(lg/mL)
2189 (±239)
729–5460 1236
(±140)
390–2844 SALtot
c
(lg/mL)
547 (±123)
112–3079 332
(±75)
54–1503 ROStot/FLAVtotratio
(x:1)
1.39 (±0.25)
0.30–4.84 0.44
(±0.09)
0.10–1.54 SALtot/FLAVtotratio
(x:1)
0.41 (±0.17)
0.06–4.91 0.21
(±0.14)
0.01–4.05 Comparison to previously detected phenylpropenoids and phenylethanoids plus derived ratios.
aROStot¼rosavinþrosarinþrosin.
bPPtot¼ROStotþaglycon cinnamyl alcohol (CA).
cSALtot¼salidrosideþaglycon tyrosol.
new results for flavonoids with our previous findings (rosavins and salidroside), it becomes clear that although comparing
‘Rhodiola’ with‘Rhodiola’may often appear seemingly the same, in fact, without the specified content of all three compound classes it is not clear which main substance group biological sys- tems are mostly exposed to. In some cases prevail rosavins (e.g., 70% rhizome extract from a specific provenance of R. rosea). In other cases, flavonoids (e.g., 70% root extract from a specific provenance) or salidroside (e.g., a 30% extract from a Rhodiola species other than R. rosea) may dominate the tested drug or product and thus the pharmacological effects (Peschel et al.
2013,2016,2018).
Overall range of flavonoid content
Our results show remarkably high flavonoid values in 70–90%
EtOH extracts from rhizome and in particular, from roots of authenticR. rosea. Quantities are comparable or superior to the usual standards rosavins and salidroside, and are in the upper range of scarce previous reports. Whether similar results are obtained with different sample sets, extracts and analytical meth- ods remains to be investigated. The first report on quantitative
differences between roots (range 0.2–0.45%) and rhizomes (0.08–1.2%) of R. rosea came from cultivation tests in Finland, however, without specifying the flavonoids. The flavonoid con- tent of hairy roots was found to be three times higher than that of rhizomes, and showed a decreasing trend with increasing fer- tilization (Galambosi2006).
Later studies usually refer to ‘roots’ with assumed diverse mixtures of roots and rhizomes. Reported quantities for single flavonoids vary, as do species provenance, plant part, and extrac- tion solvent (when information is available). Data are mostly obtained in the context of isolation and identification works but not from validated quantitative analysis. Overall, 1 is typically the main finding alongside2, rhodionin and kaempferol. Reports are available on isolations of1(19 mg/g) and rhodionin (17 mg/g) from ‘root’ (80% EtOH extract) (Kwon et al. 2009), of 1 (1.7–2.5 mg/g), rhodionin (0.14–0.3 mg/g), 2 (0.51–1.5 mg/g) and kaempferol (0.78–1.5 mg/g) from ‘root’ (unspecified extract) (C.
Ma et al.2013) and later of 1(22.9 mg/g), rhodionin (13.3 mg/g), 2 (5.5 mg/g) and kaempferol (6.9 mg/g) from ‘root’ (unspecified extract) (Ma et al. 2014). Roots of R. sachalinensis were also investigated and 1 (7.13 mg/g) alongside rhodionin (3.98 mg/g), kaempferol (8.94 mg/g), afzelin (2.82 mg/g), multiflorin B
0 1,000 2,000 3,000 4,000 5,000 6,000 7,000
p01 p02 p05 p15 p03 p06 p10 p11 p13 p14 p04 p08 p12 p17 p07 p09 p16 p18 p19 p20
µg/mL
RHIZ rhodiosin root rhodiosin RHIZ herbacetin root herbacetin
NW EUR ALP/PYR ALTAI NE EUR w ild ALP
Figure 7. Concentrations of1and2in roots and rhizomes of 17 provenances ofR. roseacultivated at 1580 m in Eastern Austria (p01–p17,N¼3, mean ± S.E.M. har- vested in year 9), as well as in p18 (unknownRhodiolaspecies) and p19/p20 (R. roseaof unknown age from wild collection) used as comparators. Provenances are grouped according to the main area of origin: North Western European Islands (NW), North Eastern Europe (NE), Alps/Pyrenees (ALP/PYR), Southern Siberia (ALTAI), direct samples from the Eastern Alps (wild Alp).
0 1,000 2,000 3,000 4,000 5,000
P
µg/mL
PP SALtot FLAVtot
b
c
a a
b
b b
b c
b
c bc
a
a c
0 1,000 2,000 3,000 4,000 5,000
NW EUR ALP/PYR ALTAI NE EUR w ild ALP
µg/mL
PP SALtot FLAVto
a
b a
a b
ab a
ab c
b
b c
a a
d
NW EUR ALP/PYR ALTAI NE EUR w ild AL
(A) (B)
Figure 8. Flavonoids (FLAVtot¼1þ2), rosavins plus aglycon CA (PPtot) and salidroside plus aglycon tyrosol (SALtot) in rhizomes (A) and roots (B) ofR. rosea(cultivated at 1580 m, harvested in year 9; 70% EtOH extracts, mean ± S.E.M.) according to the main area of origin. Significance (two-way ANOVA plus Tukey’s post test) is indi- cated with different letters whenp<0.05.
(1.0 mg/g) and kaempferol-3,40-di-O-b-D-glucopyranoside (0.4 mg/g) were detected in the dry extract (80% acetone) (Choe et al. 2012). Another study reported quantities of rhodionin in the range of 0.04–5.7 mg/g (methanol/EtOAc from ‘roots and rhizomes’) in 14 Asian Rhodiola species (R. rosea not included) without information on the content of other flavonoids (Li and Zhang2008). Furthermore, overground parts ofR. rosea showed 1 and2 among 15 gossypetin, kaempferol, and quercetin glyco- sides (Petsalo et al.2006). In summary, while1 does not appear to be unique neither to the species R. rosea, nor to any of the plant parts, its general appearance and quantitative prevalence suggest that it could serve as a potential quality marker for Rhodiolae roseae rhizoma et radix. We assume that the subordi- nated aglycon herbacetin is a natural co-constituent of the plant rather than an artefact originating from drying, extraction or analytical processing. Based on our method no other flavonoids such as rhodionin or kaempferol were identified in our rhizome and root extracts ofR. rosea.
Conclusions
This is the first systematic study focusing on occurrence and amount of 1 and2 inR. rosea drugs and preparations. 1 and2 were best extracted with 70–90% EtOH, but are also detectable in more polar extracts. Variations in drying conditions did not influence the flavonoid content. We have consistently found 1 and 2 in over 100 samples of authentic R. rosea with major quantitative differences between rhizome and root, and influ- enced by plant origin despite equivalent age and growing condi- tions. To a lesser extent and in different ratios they were also found in 3 non-confirmed Rhodiola species, as well as in mar- keted commodities that are unlikely to contain R. rosea as a main source plant.
Flavonoids1and2 can be detected simultaneously to phenyl- propenoids and salidroside, often in concentrations higher than those. A gene pool of 20 provenances showed partially significant differences in the flavonoid (1 and2) content within the overall range of 760–6300mg/mL per extract, corresponding to approxi- mately 0.5–4.2% (w/w) in the dry drug (exhaustive extraction).
Ratios of rosavins to flavonoids (1 þ 2) were 0.30–4.84 (rhi- zomes) and 0.10–1.54 (roots), while ratios of salidroside to flavo- noids were found to be in the range of 0.06–4.91 (rhizomes) and 0.01–4.05 (roots).
Although the flavonoids 1 and 2 are also found in other Rhodiola species, their prevalence, their ratio to each other and to phenylpropenoids and salidrosides may be useful for quality testing. Thus, it may give an additional analytical option with an easily detectable and quantifiable marker for the specification of R. rosea products for medicinal use. Further research is needed to confirm occurrence and quantity of 1and 2, as well as other flavonoids from other data sets – potentially including other commonRhodiolaspecies.
Acknowledgements
We gratefully acknowledge the support from Stephan Lehrl (AGES, Vienna, Austria) regarding statistical analysis, Elisabeth Williamson (University Reading, UK) and Johann Wiesnegger (Linz, Austria) for the possibility of cultivation in UK and Austria, as well as Anne Starker (Berlin, Germany), Aidan Slingsby (London, UK) and Attila Horvath (Szeged, Hungary) for their valuable time dedicated to col- lection, cultivation, sampling and processing. We thank Dora Bokor, PharmD, for proofreading the manuscript.
Disclosure statement
The authors declare no conflicts of interest. The authors are solely responsible for the content and writing of the article.
Funding
This work was supported by the National Research, Development and Innovation Office [OTKA K115796], the Economic Development and Innovation Operative Programme GINOP-2.3.2- 15-2016-00012 and Janos Bolyai Research Scholarship of the Hungarian Academy of Sciences.
References
Chen L, Yu B, Zhang Y, Gao X, Zhu L, Ma T, Yang H. 2015. Bioactivity- guided fractionation of an antidiarrheal Chinese herb Rhodiola kirilowii (Regel) Maxim reveals (–)-epicatechin-3-gallate and (–)-epigallocatechin- 3-gallate as inhibitors of cystic fibrosis transmembrane conductance regu- lator. PLoS One. 10:e0119122.
Chiang HM, Chen HC, Wu CS, Wu PY, Wen KC. 2015. Rhodiolaplants:
Chemistry and biological activity. J Food Drug Anal. 23:359–369.
Choe KI, Kwon JH, Park KH, Oh MH, Kim MH, Kim HH, Cho SH, Chung EK, Ha SY, Lee MW. 2012. The antioxidant and anti-inflammatory effects of phenolic compounds isolated from the root ofRhodiola sachalinensis A. BOR. Molecules (Basel, Switzerland). 17:11484–11494.
El-sayed NH, Awaad AS, Hifnawy MS, Mabry TJ. 1999. A flavonol triglyco- side fromChenopodium murale. Phytochemistry. 51:591–593.
Fliniaux O, Corbin C, Ramsay A, Renouard S, Beejmohun V, Doussot J, Falguieres A, Ferroud C, Lamblin F, Laine E. 2014. Microwave-assisted extrac- tion of herbacetin diglucoside from flax (Linum usitatissimumL.) seed cakes and its quantification using an RP-HPLC-UV system. Molecules. 19:3025–3037.
Galambosi B. 2006. Demand and availability ofRhodiola roseaL. raw mater- ial. Wag Ur Fron. 16:223–236.
Hyuga S, Hyuga M, Yoshimura M, Amakura Y, Goda Y, Hanawa T. 2013.
Herbacetin, a constituent ofEphedrae herba, suppresses the HGF-induced motility of human breast cancer MDA-MB-231 cells by inhibiting c-Met and Akt phosphorylation. Planta Med. 79:1525–1530.
Jeong HJ, Ryu YB, Park SJ, Kim JH, Kwon HJ, Kim JH, Park KH, Rho MC, Lee WS. 2009. Neuraminidase inhibitory activities of flavonols isolated fromRhodiola rosearoots and theirin vitroanti-influenza viral activities.
Bioorg Med Chem. 17:6816–6823.
Kobayashi K, Yamada K, Murata T, Hasegawa T, Takano F, Koga K, Fushiya S, Batkhuu J, Yoshizaki F. 2008. Constituents of Rhodiola roseashowing inhibitory effect on lipase activity in mouse plasma and alimentary canal.
Planta Med. 74:1716–1719.
Kurkin VA, Zapesochnaya GG, Kljaznika G. 1982. Flavonoids of Rhodiola rosea1.1 Tricin glucosides. Khim Prir Soedin. 5:581–584.
Kurkin VA, Zapesochnaya GG, Shchavlinsky AN. 1984a. Flavonoids from the epigeal parts ofRhodiola rosea1. Khim Prir Soedin. 5:657–658.
Kurkin VA, Zapesochnaya GG, Shchavlinsky AN. 1984b. Flavonoids of Rhodiola rosearhizomes 3. Khim Prir Soedin. 3:390–391.
Kwon HJ, Ryu YB, Jeong HJ, Kim JH, Park SJ, Chang JS, Kim M, Rho MC, Lee WS. 2009. Rhodiosin, an antioxidant flavonol glycoside fromRhodiola rosea. J Korean Soc Appl Biol Chem. 52:486–492.
Li L, Sapkota M, Kim SW, Soh Y. 2015. Herbacetin inhibits inducible nitric oxide synthase via JNK and nuclear factor-jB in LPS-stimulated RAW264.7 cells. Eur J Pharmacol. 765:115–123.
Li L, Sapkota M, Kim SW, Soh Y. 2016. Herbacetin inhibits RANKL-medi- ated osteoclastogenesis in vitro and prevents inflammatory bone loss in vivo. Eur J Pharmacol. 777:17–25.
Li T, Zhang H. 2008. Identification and comparative determination of rho- dionin in traditional Tibetan medicinal plants of fourteenRhodiolaspecies by high-performance liquid chromatography-photodiode array detection and electrospray ionization-mass spectrometry. Chem Pharm Bull. 56:
807–814.
Ma C, Hu L, Fu Q, Gu X, Tao G, Wang H. 2013. Separation of four flavo- noids fromRhodiola rosea by on-line combination of sample preparation and counter-current chromatography. J Chromatogr A. 1306:12–19.
Ma S, Hu L, Ma C, Lv W, Wang H. 2014. Application and recovery of ionic liquids in the preparative separation of four flavonoids from Rhodiola roseaby on-line three-dimensional liquid chromatography. J Sep Sci. 37:
2314–2321.
Nakamura S, Li X, Matsuda H, Ninomiya K, Morikawa T, Yamaguti K, Yoshikawa M. 2007. Bioactive constituents from Chinese natural medicines.
XXVI. Chemical structures and hepatoprotective effects of constituents from roots ofRhodiola sachalinensis. Chem Pharm Bull. 55:1505–1511.
Nawwar MAM, El-Sissi HI, Barakat HH. 1984. Flavonoid constituents of Ephedra alata. Phytochemistry. 23:2937–2939.
Peschel W, Kump A, Horvath A, Csupor D. 2016. Age and harvest season affect the phenylpropenoid content in cultivated EuropeanRhodiola rosea L. Ind Crop Prod. 83:787–802.
Peschel W, Kump A, Zomborszki ZP, Pfosser M, Kainz W, Csupor D. 2018.
Phenylpropenoid content in high-altitude cultivated Rhodiola rosea L.
provenances according to plant part, harvest season and age. Ind Crop Prod. 111:446–456.
Peschel W, Prieto JM, Karkour C, Williamson EM. 2013. Effect of proven- ance, plant part and processing on extract profiles from cultivated EuropeanRhodiola roseaL. for medicinal use. Phytochemistry. 86:92–102.
Petsalo A, Jalonen J, Tolonen A. 2006. Identification of flavonoids of Rhodiola rosea by liquid chromatography–tandem mass spectrometry. J Chromatogr A. 1112:224–231.
Qiao Y, Liu X. 2013.In vitrofree radical scavenging and protein oxidation inhibitory effects of herbacetin. Food Sci. 34:106–110.
Qiao Y, Xiang Q, Yuan L, Xu L, Liu Z, Liu X. 2013. Herbacetin induces apoptosis in HepG2 cells: involvements of ROS and PI3K/Akt pathway.
Food Chem Toxicol. 51:426–433.
Rhodiola rosearoot and rhizome powder. 2015. USP herbal medicines com- pendium; p. 1–4. U.S. Pharmacopeial Convention. https://hmc.usp.org/
monographs/rhodiola-rosea-root-and-rhizome-powder-1-0.
Stewens JF, Wollenweber E, Ivancic M, Hsu VL, Sundberg S, Deinzer ML.
1999. Leaf surface flavonoids of Chrysothamnus. Phytochemistry. 51:
771–780.
van Diermen D, Marston A, Bravo J, Reist M, Carrupt PA, Hostettmann K.
2009. Monoamine oxidase inhibition by Rhodiola rosea L. roots. J Ethnopharmacol. 122:397–401.
Wei X, Li GH, Wang XL, He JX, Wang XN, Ren DM, Lou HX, Shen T.
2017. Chemical constituents from the leaves ofCinnamomum parthenoxy- lon(Jack) Meisn. (Lauraceae). Biochem Syst Ecol. 70:95–98.
Wollenweber E, D€orr M, Beyer M, Roitman JN, Puttoek CF. 1997. Rare fla- vonoids from Odixia and Ozothamnus spp. (Asteraceae, Gnaphalieae).
Zeitschrift Naturforschung C. 52:571–576.
Zapesochnaya GG, Kurkin VA, Shchavlinsky AN. 1985. Flavonoids of the epigeal part ofRhodiola rosea. II. Structures of new glycosides of herbace- tin and of gossypetin. Chem Nat Compd. 4:464–473.
Zapesochnaya GG, Kurkin VA. 1983. Flavonoids ofRhodiola rosearhizomes.
2. Flavonolignan and herbacetin glycosides. Khim Prir Soedin. 1:23–32.
Zhou JT, Li CY, Wang CH, Wang YF, Wang XD, Wang HT, Zhu Y, Jiang MM, Gao XM. 2015. Phenolic compounds from the roots of Rhodiola crenulataand their antioxidant and inducing IFN-cproduction activities.
Molecules (Basel, Switzerland). 20:13725–13739.