DOI: 10.1556/066.2019.48.2.6
INVESTIGATION OF OVERALL AND MELAMINE MIGRATION FROM MELAMINE BOWLS
H.M. MANAVa*, O. GURBUZb, D. CUMBULc, I.E. TOKATc, E. KORKMAZd and A.F. DAGDELENe aDepartment of Food Residues, National Food Reference Laboratory, Yenimahalle, 06170 Ankara, Turkey
bDepartment of Food Engineering, Faculty of Agriculture, University of Bursa Uludag, Gorukle Campus 16059, Bursa. Turkey
cDepartment of Food Additives and Residues, Central Research Institute of Food and Feed Control, Hurriyet Street 126 Osmangazi, 16036 Bursa. Turkey
dDepartment of Vegetal Products Packaging Laboratory, Central Research Institute of Food and Feed Control, Hurriyet Street: 126 Osmangazi, 16036 Bursa. Turkey
eDepartment of Food Engineering, Bursa Technical University, Faculty of Natural Sciences, Architecture and Engineering, 16310 Yildirim. Bursa
(Received: 24 May 2018; accepted: 11 October 2018)
Overall and melamine migration have been determined for 60 samples of melamine resin bowls, which were purchased in various local markets in the area of Bursa, Turkey. The samples were exposed to food simulants 3%
acetic acid, 10% ethanol aqueous solutions, and rectifi ed (refi ned) olive oil at 100 °C for 30 min, and 50% ethanol aqueous solutions at 60 °C for 30 min. The LOQ value was calculated as 3.3 mg dm–2 for overall migration and 0.126 mg kg–1 for melamine migration. Research fi ndings did not exceed the limit of overall migration level (10 mg dm–2). Also, melamine levels of all tested items found in the third assays were below the specifi c migration limit (SML) of 2.5 mg kg–1 set out in the EU 10/2011 (EU, 2011) and Turkish Food Codex 2013/34 (TFC, 2013a).
Some expensive as well as cheap products showed close migration levels. The increased cost of the item did not indicate a higher quality regarding health in this study.
Keywords: melamine, tableware, migration, HPLC
The safety of food contact materials (FCM) must be evaluated as chemicals can migrate from the materials into food. Overall migration corresponds to the total and non-volatile components that migrate from the FCM, and specifi c migration is related to a specifi c constituent. Migration must not occur in quantities that could endanger human health, bring about an unacceptable change in the composition of the food or a deterioration of its organoleptic (taste, odour, colour, and texture) characteristics (EC, 2004).
Melamine is a monomer or other starting substance used in the manufacture of certain plastic materials and articles, which get in contact with foodstuffs (EU 10/2011). It also has IUPAC name 1,3,5-triazine-2,4,6-triamine, CAS Number 108-78-1, and molecular formula C3H6N6 (NATIONAL CENTER FOR BIOTECHNOLOGY INFORMATION, 2018). Due to its strong durability, good chemical and heat resistance, and low cost, it is widely used in household and food premises (CENTREFOR FOOD SAFETY, 2012). Melamine tableware is generally sold in local markets and online shopping sites in Turkey.
Melaware articles are considered the most important source of exposure to melamine from FCM. Residual monomers can remain in the fi nished plastic item after manufacturing,
188
and their migration to the foodstuffs must comply with the current legislation (LUND &
PETERSEN, 2006). Regarding health, melamine does not exhibit systemic toxicity but can react with other substances, such as endogenous uric acid, to form crystals in the urine (FILAZI et al., 2012). The TDI for melamine has been established at 0.063 mg kg–1 body weight by FDA and 0.2 mg kg–1 body weight by WHO (FDA, 2008; WHO, 2009). The SML established by EU 10/2011 and Turkish Food Codex (TFC, 2013a) is 2.5 mg kg–1 food. The migration of melamine has been determined under various conditions, including pH and temperature, in several studies in different countries (ISHIWATA et al., 1987; BRADLEY et al., 2005; LUND &
PETERSEN, 2006; LU et al., 2009; CHIEN et al., 2011; CHIK et al., 2011; LYNCH et al., 2015;
IBARRA et al., 2016). Based on these studies, it is clear that migration happens in a measureable amount, particularly under acidic and high-temperature conditions, and also depends on contact time, presence of simulants, and price of tableware (CHIEN et al., 2011; CHIK et al., 2011). Results obtained for repeated tests can vary. Initial melamine migration may be due to the residual monomer, while subsequent migration may result from breakdown of the polymer (LYNCH et al., 2015). In this study, HPLC/DAD-UV rapid method was used to detect specifi c migration (melamine) and standard gravimetric method for overall migration levels to check the compliance with the national and EU legislations.
1. Materials and methods
1.1. Samples
Sixty samples of melamine resin bowls of 5 different brands were purchased from local markets in the area of Bursa. Migration assays were carried out using four food simulants and three repeated exposures for each bowl. Tests were performed in three times for each brand, and extracts were analysed with two injections on chromatography.
1.2. Food simulants
Aqueous solutions of 3% acetic acid (w/v), 10% ethanol (v/v) 50% ethanol (v/v) and vegetable oil were used as food simulants according to CEN EN 13130 (DD CEN/TS, 2005) and EU 10/2011. The chosen vegetable oil was rectifi ed olive oil (ROO) in this study, which was provided by Emek Oil Industry Inc.™. The oil has a fatty acid composition specifi ed in the notifi cation, which was analysed by gas chromatography and results are summarized in Table 1.
Table 1. Food simulants used in migration tests (TFC 2013/35, EU 2011)
Food simulant Abbreviation Representation Sample code in study
Ethanol 10% (v/v) Food simulant A pH>4.5 aqueous foods A Acetic acid 3% (w/v) Food simulant B pH<4.5 acidic foods B
Ethanol 50% (v/v) Food simulant D1 Fatty foods D
Vegetable oil (*) Food simulant D2 Fatty foods ROO (rectifi ed olive oil) (*)This may be any vegetable oil with a fatty acid distribution of
Table 1. Continued No of carbon atoms in fatty acid chain:
No of unsaturation 6–12 14 16 18:0 18:1 18:2 18:3
Range of fatty acid composition expressed in %
(w/w) of methyl esters by gas chromatography <1 <1 1.5–20 <7 15–85 5–70 <1.5 Results for rectifi ed olive oil in study % (w/w) <LOQ <LOQ 13.31 2.45 70.16 11.46 0.59
1.3. Chemicals and reagents
All reagents and solvents used were of analytical quality unless specifi ed otherwise. HPLC- grade acetonitrile (CH3CN, purity ≥99.9%), ethanol (C2H5OH, purity ≥99.8%), glacial acetic acid (CH3COOH, purity 100%), 2,2,4-trimethylpentane (known as isooctane, C8H18, purity
≥99.5%), and 2-propanol (known as isopropanol, C3H7OH, purity ≥99.5%) were purchased from Merck (Darmstadt, Germany). Ultrapure water was obtained from a Milli-Q water purifi cation system.
Melamine standard (C3H6N6, purity >99%) was purchased from Merck (Darmstadt, Germany). FAPAS Specifi c 1257 Migration 3% aq. acetic acid was used as certifi cated test material (T1257QC).
1.4. Preparation of stock standard and working solutions
Stock standard solution at a concentration of 1000 mg l–1 was prepared in ultrapure water and stored at 4 °C in the dark. Working solutions were diluted from the stock solution to obtain concentrations of 125, 250, 500, and 1000 μg l–1 in selected food simulants. The standard solutions for ROO assays were prepared in isopropanol/water and working solutions were prepared by using spiked olive oil samples as defi ned in DD CEN/TS (2005). The working solutions were stored in the dark at 4 °C before analysis.
1.5. Calibration curve
The calibration curve was obtained by plotting the peak area against the concentration of melamine standards in the calibration samples of food simulant. Four calibration curves were obtained for each simulant. All results were calculated using a regression line equation. The peak area, regression coeffi cient, and parameters of the calibration line were calculated from the peak, and data were processed by Chemstation.
1.6. Migration tests
Samples were washed in dishwasher with household detergent and dried with a cotton-soft cloth before starting the migration tests, because samples must be clean and free of surface contamination and simulate real conditions of use.
Migration tests were carried out by EN 1186 Part 9 (EN, 2002). Melamine bowls and glass containers (for blank samples) were fi lled with 200 ml pre-heated simulants to approximately 1 cm from the rim. Then were covered immediately with appropriately sized watch glasses and placed in the thermostatically controlled oven set at the test temperature.
A thermometer was inserted in one of the glass containers (for blank) containing simulant.
The temperature was monitored and the timer for the migration test (30 min) was started after the temperature of the simulant has reached a temperature within the permitted tolerance for
190
Migration tests were performed three times on each sample by using new simulant on each occasion. Following the exposure, the simulants in bowls were stirred for sample homogenization. Suffi cient amount of simulant was transferred to a glass vial by using a 0.45 μm fi lter and was stored in the dark at 4 °C before HPLC analysis. The remaining part was used to determine overall migration analysis by the standard gravimetric method. After the fi rst test, second and third successive migration tests were performed in the same way.
Preparation of test sample for ROO; 5±0.1 g of olive oil, obtained from the migration test, was weighed, 5 ml of isooctane was added, it was mixed, then 5 ml of isopropanol/water 10% was added. The fl ask was then placed into an ultrasonic bath for 30 min at 70 °C. The phases were allowed to separate for approximately 30 min. Approximately 2 ml of the aqueous layer of the sample was retracted, using a syringe, and fi ltered through a 0.2 μm disposable HPLC fi lter into a vial suitable for HPLC injections.
1.7. Determination of overall migration levels
Overall migration analyses were performed by the standard gravimetric method according to the relevant directives (EU 10/2011) and the EN 1186, Part 1, 9, and 14. ROO was not used for overall migration assays. The LOQ value was determined according to EURACHEM (2014) and BRATINOVA and co-workers (2009).
1.8. Instrumentation and chromatographic system for melamine migration levels
Agilent 1100 HPLC system equipped with a DAD detector was used for quantifi cation of melamine. Separations were carried out on a column fi lled with amino coated irregular silica gel 60 Å (200 mm×4.6 mm, 5 μm particle size) with an eluting solvent mixture of 75%
acetonitrile and 25% 5 mM phosphate buffer (pH 6.5±0.2) at 20 °C, and UV detection at 230 nm. The fl ow-rate was set at 1 ml min–1 and the injection volume was 20 μl. A Windows XP computer running Chemstation was used for data acquisition and processing.
Verifi cation studies have been carried out for the standard method used in melamine analysis according to TS EN ISO/IEC 17025 (2012) and SMPR (2011).
2. Results and discussion
2.1. Overall migration levels
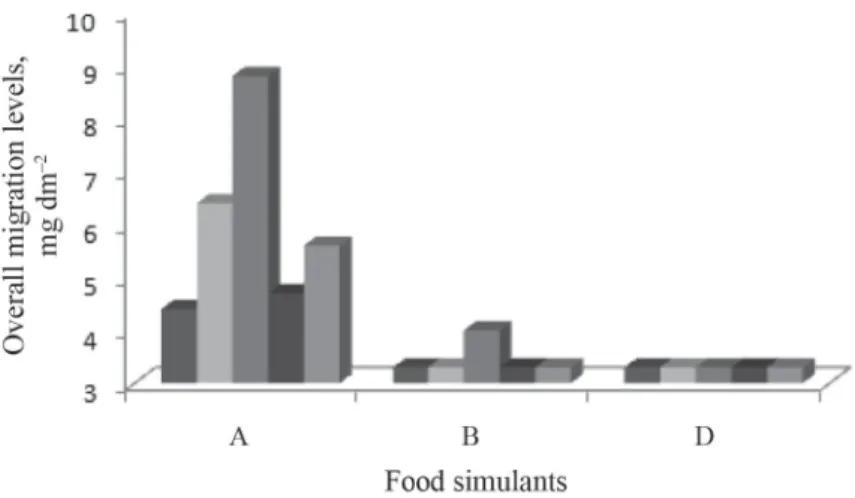
The overall migration was expressed as milligrams of residue per square decimeter of the food contact surface for each test specimen. The LOQ value was calculated as 3.3 mg dm–2. Highest values were obtained for simulant A. However, research fi ndings did not exceed the limit of 10 mg dm–2 for any of the samples at tested exposures, given in Table 2 and Figure 1.
2.2. Migration levels of melamine
Method performance was evaluated and satisfactory linearities were found for simulant A, B, and D over a range of 125–1000 μg l–1 with correlation coeffi cients of 0.996, 0.997, and 1.000, respectively. The calibration curve for ROO was in the range of 250–1000 μg l–1 with a correlation coeffi cient of 0.999. Retention time was obtained as 5.40 for simulant A, 5.08
for simulant B, 5.72 for simulant D, and 5.23 for ROO. Under laboratory conditions, the method limit of detection (LOD) and quantifi cation (LOQ) were determined as 0.038 mg kg–1 and 0.126 mg kg–1, respectively. The recovery of melamine for 3% acetic acid solution spiked with 0.5 mg kg–1 was 96.08% with the RSD (n=24) 7.9%. The repeatability RSD was 1.5%
and reproducibility RSD was 2.8% for 3% acetic acid sample at 0.5 mg kg–1 level.
Fig. 1. Overall migration levels of brands for third exposure (mg dm–2). A: 10% ethanol; B: 3% acetic acid;
D: 50% ethanol. : Brand 1; : Brand 2; : Brand 3; : Brand 4; : Brand 5
Table 2. Overall migration results (average of three measurements) (mg dm–2)
Brands Simulant A Simulant B Simulant D
Exposures
i ii iii i ii iii i ii iii
1 3.7 6.6 4.4 <LOQ <LOQ <LOQ <LOQ <LOQ <LOQ
2 6.1 7.4 6.4 <LOQ <LOQ <LOQ <LOQ <LOQ <LOQ
3 5.2 6.8 8.8 3.4 4.8 4.0 <LOQ <LOQ <LOQ
4 3.9 4.1 4.7 <LOQ <LOQ <LOQ <LOQ <LOQ <LOQ
5 5.8 8.0 5.6 <LOQ <LOQ <LOQ <LOQ <LOQ <LOQ
LOQ: 3.3 mg dm–2
The result for FAPAS test material was found as 2.92 mg kg–1, which was in the given specifi ed value range of 2.11–3.70 mg kg–1 for melamine in the certifi cate.
Migration levels of melamine bowls were evaluated according to EU 10/2011 Chapter 5, Article 17, by contact surface area and volume ratio. Surface area of the samples was measured as 2 dm2 and fi lling volume was 200 ml or grams and calculated migration levels as mg kg–1 are listed for each brand in Table 3.
192
Table 3. Melamine migration results (average of three measurements) (mg kg–1)
Brands Simulant A Simulant B Simulant D ROO
Exposures
i ii iii i ii iii i ii iii i ii iii
1 <LOQ <LOQ <LOQ 0.530 0.331 0.430 <LOQ <LOQ <LOQ ND ND ND
2 0.372 0.216 <LOQ 0.677 0.687 0.611 0.348 0.139 0.181 ND ND ND
3 <LOQ <LOQ <LOQ 1.070 0.362 0.431 <LOQ <LOQ 0.137 ND ND ND 4 <LOQ <LOQ 0.148 1.778 0.492 0.875 0.336 0.220 0.149 ND ND ND 5 <LOQ <LOQ <LOQ 3.029 1.138 1.402 0.348 0.205 0.266 ND ND ND LOQ: 0.126 mg kg–1; ND: not detected
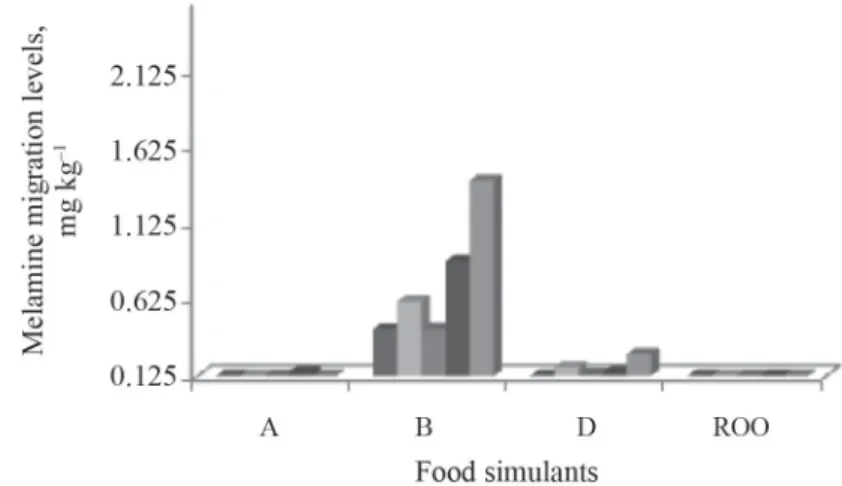
Compliance of migration results to SML is checked by the level of migration found in the third test as indicated in the TFC 2013/34 Annex 4, Section 2 (TFC, 2013a). Third exposure melamine migration levels of brands for each simulant were below the SML of 2.5 mg kg–1 (Fig. 2).
Fig. 2. Melamine migration levels of brands for third exposure (mg kg–1). A: 10% ethanol; B: 3% acetic acid; D:
50% ethanol; ROO: refi ned olive oil. : Brand 1; : Brand 2; : Brand 3; : Brand 4; : Brand 5
Simulant A represents aqueous foods with a pH value above 4.5, and results were below the SML for all samples. The migration level is expected to be low in non-acidic foods. In concordance with LYNCH and co-workers (2015), comparisons indicated that means are signifi cantly higher at pH 3 than means at other pH values, as pH 5, 7, 9, and 11.
The highest levels of melamine residues were measured for all samples for simulant B.
It indicates that low pH or high acidity is an effective parameter for melamine migration. Our study corroborates with the results of several studies, which suggested that excessive heat and acidity may directly affect melamine migration (LU et al., 2009; CHIEN et al., 2011; CHICK
et al., 2011). Migration levels were not detected for ROO tests. In agreement with BRADLEY
and co-workers (2010), migration into the olive oil was not detectable. Unlike olive oil,
results for simulant D were higher than the LOQ for four brands at the third exposure. It has already been reported that melamine is slightly soluble in water and ethanol (LIDE, 1997).
Because of the obtained low values, it can be stated that fatty foods or oil are not supporting melamine migration.
Changing trend of migration levels for repeated exposures was another point observed during the study. Residual differences between brands and repeated uses were calculated using a statistical program JMP and determined by Student’s t-and LSD-tests. Repeated assays for simulant A were not found to be different (P>0.05) among brands. The two brands did show a difference for simulant B at the fi rst exposure (P>0.05), and signifi cant differences (P>0.05) were observed between brands for simulant D at the second and third exposures.
Differences between 1st, 2nd, and 3rd exposure for the same brand were also calculated for all simulants, and results were not found to be different (P>0.05). Similarly, repeat tests of previous studies have not shown a regular and linear increase or decrease (BRADLEY et al., 2005; LUND & PETERSEN, 2006; IBARRA et al., 2016).
LUND and PETERSEN (2006) suggested, on general interpretation of the migration pattern, that the main contribution to the migration in the fi rst and second exposure periods is from residual monomers. In the following tests, the monomer migration probably comes primarily from the degradation of the polymer. About this situation, it was observed that some of the melamine bowls were deteriorated and surface roughened during repeated exposure to simulant B (acetic acid 3%) in this study. Furthermore, IBARRA and co-workers (2016) demonstrated discoloured and cracked food contact surface in some cases.
Considering the cumulative effects of food simulants on migration; simulant B was found to be more signifi cant (P<0.01) than the others for each brand. The migration ratio for all simulants is schematized in Figure 3.
Fig. 3. Simulant effects on melamine migration. A: 10% ethanol; B: 3% acetic acid; D: 50% ethanol.
: Simulant A; : Simulant B; : Simulant D
The relationship between migration and prices of melamine-ware articles were also investigated in studies. CHIEN and co-workers (2011) showed that the amount of migrated
194
levels. In contrast, in our study there was no correlation between the amount of migration and price. Despite of some expensive and cheap containers showing close values, similarly priced brands had different migration levels. High price did not indicate higher quality, and expensiveness did not mean lower safety risk in this study.
3. Conclusions
This study measured overall and melamine migration levels for fi ve brands of melamine bowls sold in Bursa, Turkey. Results were in a range of 3.4–8.8 mg dm–2 for overall migration and 0.137–1.402 mg kg–1 for specifi c migration tests. Tested samples did not exceed the relevant maximum limits evaluated by the provisions of the EU 10/2011 and TFC 2013/34.
The study confi rms fi ndings of some other studies published before that migration is directly affected by acidic and high-temperature conditions. Considering the effect of lower pH and high temperature on melamine migration, using of melamine articles with acidic and hot foods is not recommended for long years. The increased cost of the item did not indicate a higher quality regarding health in this study. However, these results represent the observed trend in a limited number of samples provided from limited regional markets. Studies with more samples from different locations are needed to draw general conclusions for the country.
*
The authors would like to thank Emek Oil Industry Inc.™ for rectifi ed olive oil supply.
This study was funded by the Republic of Turkey Ministry of Food, Agriculture and Livestock, General Directorate of Agricultural Research and Policies (Project No: TAGEM/HSGYAD/14/A05/P01/48) and the research was conducted in Central Research Institute of Food and Feed Control (16036 Bursa, Turkey).
References
BRADLEY, E.L., BOUGHTFLOWER, V., SMITH, T.L., SPECK, D.R. & CASTLE, L. (2005): Survey of the migration of melamine and formaldehyde from melamine food contact articles available on the UK market. Food Addit.
Contam., 22, 597–606.
BRADLEY, E.L., CASTLE, L., DAY, J.S., EBNER, I., EHLERT, K., ... & PFAFF, K. (2010): Comparison of the migration of melamine from melamine formaldehyde plastics (melaware) into various food simulants and foods themselves.
Food Addit. Contam., 27, 1755–1764.
BRATINOVA, S., RAFFAEL, B. & SIMONEAU, C. (2009): Guidelines for performance criteria and validation procedures of analytical methods used in controls of food contact materials, EUR 24105 EN-1. ed., JRC Scientifi c and Technical Reports.
CENTREFOR FOOD SAFETY (2012): Safety issues of baby bottles and children’s tableware. 47th Report on the risk assessment studies. Food and Environmental Hygiene Department of the Government of the Hong Kong Special Administrative Region.
CHIEN, C.Y., WU, C.F., LIU, C.C., CHEN, B.H., HUANG, S.P., ... & WU, M.T. (2011): High melamine migration in daily use melamine-made tableware. J. Hazard Mater., 188, 350–356.
CHIK, Z., HARON, D.E., AHMAD, E.D., TAHA, H. & MUSTAFA, A.M. (2011): Analysis of melamine migration from melamine food contact articles. Food Addit. Contam., 28, 967–973.
DD CEN/TS (2005): Materials and articles in contact with foodstuffs – Plastic substances subject to limitation – Part 27: Determination of 2,4,6-triamino-1,3,5-triazine in food simulants. NO. 13130-27
EC (2004): European Parliament and of the Council of 27 October 2004 on materials and articles intented to come into contact with food and repealing Directives 80/590/EEC and 89/109/EEC. NO. EC 1935
EN (2002): Materials and articles in contact with foodstuffs – Plastics–Part 1: Guide to the selection of conditions and test methods for overall migration. Part 9: Test methods for overall migration into aqueous food simulants by article fi lling. Part 14: Test methods for ‘substitute tests’ for overall migration from plastics intended to come into contact with fatty foodstuffs using test media iso-octane and 95% ethanol. No. 1186 (Parts 1, 9, 14)
EU (2011): 10/2011 European Union Commission Regulation on plastic materials and articles intended to come into contact with food. 14 Jan 2011.
EURACHEM (2014): The fi tness for purpose of analytical methods, a laboratory guide to method validation and related topics. 2nd ed.
FDA (2008): Update: Interim safety and risk assessment of melamine and its analogues in food for humans, 28. Nov Food and Drug Administration. U.S.
FILAZI, A., SIRELI, U.T., EKICI, H., CAN, H. & KARAGOZ, A. (2012): Determination of melamine levels of milk and dairy products by HPLC method. J. Dairy Sci., 95, 602–608.
IBARRA, G.V., RODRIGUEZ BERNALDO DE QUIRÓS, A. & SENDÓN, R. (2016): Study of melamine and formaldehyde migration from melamine tableware. Eur. Food. Res. Technol., 242, 1187–1199.
ISHIWATA, H., INOUE, T., YAMAZAKI, T. & YOSHIHIRA, K. (1987): Liquid chromatographic determination of melamine in beverages. J. AOAC Int., 70, 457–460.
LIDE, D.R. (1997): CRC handbook of chemistry and physics, 78th ed. CRC Press, Boca Raton, FL.
LU, J., XIAO, J., YANG, D.J., WANG, Z.T., JIANG, D.G., FANG, C.R. & YANG, J. (2009): Study on migration of melamine from food packaging materials on markets. Biomed. Environ. Sci., 22, 104–108.
LUND, K.H. & PETERSEN, J.H. (2006): Migration of formaldehyde and melamine monomers from kitchen and tableware made of melamine plastic. Food Addit. Contam., 23, 948–955.
LYNCH, R.A., HOLLEN, H., JOHNSON, D.L. & BARTELS, J. (2015): The effects of the pH on the migration of melamine from childern’s bowls. Int. J. Food Contam., 2, 9.
NATIONAL CENTER FOR BIOTECHNOLOGY INFORMATION (2018): De Gruyter – IUPAC Standards Online. PubChem Compound Database; CID=7955, Available at https://pubchem.ncbi.nlm.nih.gov/compound/7955 (last accessed: 13 July 2018)
SMPR (2011): Standard format and guidance for AOAC standard method performance requirement document 5 (Version 12.1; 31-Jan-11).
TFC (2013a): Communiqué on plastic materials and articles in contact with food. Türk Gıda Kodeksi (TGK)–
Turkish Food Codex No. 2013/34
TFC (2013b): Communiqué on list of simulants to be used for testing migration of constituents of the plastic materials and articles in contact with food. Türk Gıda Kodeksi (TGK)–Turkish Food Codex No. 2013/35 TS EN ISO/IEC (2012): General requirements for the competence of testing and calibration laboratories. No. TS
EN ISO/IEC 17025
WHO (2009): Toxicological and health aspects of melamine and cyanuric acid. Report of a World Health Organization, Geneva.
This is an open-access article distributed under the terms of the Creative Commons Attribution-NonCommercial 4.0 International License (https://creativecommons.org/licenses/by-nc/4.0/), which permits unrestricted use, distribu-