Genome-wide Scan Using DArT Markers for Selection Footprints in Six-rowed Naked Barley
from the Tibetan Plateau
J.Q. Xu1,2**, L. Wang1**, B.L. Liu1**, T.F. Xia1,2, D.C. Liu1,3, X. Chang4, T.W. Zhang5, h.g. Zhang1* and Y.h. Shen1*
1Key Laboratory of Adaptation and Evolution of Plateau Biota, Key Laboratory of Crop Molecular Breeding of Qinghai Province, Northwest Institute of Plateau Biology, Chinese Academy of Sciences,
Xining 810008, China
2University of Chinese Academy of Sciences, Beijing 100049, China
3Triticeae Research Institute, Sichuan Agricultural University, Wenjiang 611130, China
4Department of Plant Sciences, Tibet Agriculture and Animal Husbandry College, Linzhi 860000, China
5Institute of Agricultural Product Quality Standard and Testing Research, Tibet Academy of Agricultural and Animal Husbandry Sciences, Lhasa 850002, China
(Received 4 May 2017; Accepted 22 May 2018;
Communicated by H. Grausgruber)
As one of the world’s earliest domesticated crops, barley is a model species for the study of evolution and domestication. Domestication is an evolutionary process whereby a popula- tion adapts, through selection; to new environments created by human cultivation. We describe the genome-scanning of molecular diversity to assess the evolution of barley in the Tibetan Plateau. We used 667 Diversity Arrays Technology (DArT) markers to genotype 185 barley landraces and wild barley accessions from the Tibetan Plateau. Genetic diversity in wild barley was greater than in landraces at both genome and chromosome levels, except for chromosome 3H. Landraces and wild barley accessions were clearly differentiated geneti- cally, but a limited degree of introgression was still evident. Significant differences in diver- sity between barley subspecies at the chromosome level were observed for genes known to be related to physiological and phenotypical traits, disease resistance, abiotic stress toler- ance, malting quality and agronomic traits. Selection on the genome of six-rowed naked barley has shown clear multiple targets related to both its specific end-use and the extreme environment in Tibet. Our data provide a platform to identify the genes and genetic mecha- nisms that underlie phenotypic changes, and provide lists of candidate domestication genes for modified breeding strategies.
Keywords: domestication, Hordeum vulgare, selective sweep
*Corresponding authors: E-mails: shenyuhu@nwipb.cas.cn; hgzhang@nwipb.cas.cn
**These authors contributed equally to this article.
Cereal Research Communications 46, 2018
Introduction
Cultivated barley, Hordeum vulgare L., is one of the earliest domesticated crops, and one of the main cereals worldwide after maize, rice and wheat (Nevo 2013). In the Qinghai- Tibetan Plateau (QTP), six-rowed naked barley (H. vulgare L. var. nudum Hook.f.), also known locally as qingke, has been cultivated and adapted for thousands of years in the harsh conditions of this mountainous area and continues to be the staple food of the local Tibetan people (Tashi et al. 2013). Since the discovery of H. agriocrithon Åberg, in 1938 (Åberg 1938) and Hordeum spontaneum C. Koch, the wild ancestor of cultivated barley, in the 1950s in the QTP (Hsu 1975), the origins of Chinese cultivated barley have re- ceived attention and debate. Recently, evidences have been found to support Tibet as a center of barley domestication (Dai et al. 2012; Ren et al. 2013). Six-rowed naked barley is grown widely across the QTP and has become well adapted to the local environments characterized by poor soils, short growing season and high UV-B radiation. Therefore, a large phenotypic variation exits in Tibetan barley based on intrinsic genetic variation. As a founder crop, barley experienced dramatic genetic and phenotypic changes due to in- tense selection and adaption to diverse environmental conditions and agricultural prac- tices. It is considered that a similar “domestication syndrome” (Doebley et al. 2006) oc- curred in six-rowed naked barley on the Tibetan Plateau.
Brittleness of rachis, kernel row type, caryopsis type, dormancy and growth habit are regarded as key traits for domestication which have been genetically mapped with varia- ble accuracy (Pourkheirandish and Komatsuda 2007). Significant chromosome-level dif- ferences in diversity between wild barley and barley landraces from Jordan and Syria were observed for genes known to be involved in barley evolution, which highlighted regions of the genome that may be subject to selection processes (Russell et al. 2011).
Igartua et al. (2012) indicated chromosome regions and loci containing so-called domes- tication genes, including vernalization and photoperiod response genes, as well as quan- titative trait loci (QTL) for flowering time in Mediterranean barleys. However, little infor- mation is available about the response of genomic variation to artificial and natural selec- tion during domestication and post-domestication in six-rowed naked barley from the Tibetan Plateau.
In this study, we focus on finding genome signatures of historic selection pressure on genes and genomic regions of six-rowed naked barley based on DArT markers of acces- sions of wild barley and barley landraces collected from the Tibetan Plateau. The aims of this study were to i) evaluate the level of genetic diversity both at the genome and chro- mosome level; ii) find ‘domestication genes and regions’, i.e. genes and regions that were subjected to selection events during domestication; and iii) annotate the ‘domestication genes and regions’ of six-rowed naked barley from Tibet.
Material and Methods Plant materials and DArT genotyping
A total of 185 samples from the Tibetan Plateau (Fig. S1) were provided by the National Crop Germplasm Collection (Xining, Qinghai), consisting of 126 two-rowed wild barley (H. spontaneum) and 59 six-rowed naked barley landraces (H. vulgare) (Table S1*). All accessions were planted at Xining experimental station (101.5°E, 36.5° N) of Northwest Institute of Plateau Biology, Chinese Academy of Sciences, Xining city, Qinghai prov- ince. The kernel row type and caryopsis type of each accession were recorded in three continuous growing seasons from 2013 to 2015.
DNA from young leaves was extracted using the cetyltrimethylammonium bromide (CTAB) method (Doyle 1990). DArT genotyping was carried out using the Barley PstI (BstNI) version 1.7 array of Diversity Arrays Technology Pty. Ltd (University of Can- berra, Bruce Campus, Australia) (Wenzl et al. 2006).
Data analysis
For overall genome-level comparisons, Nei’s genetic diversity estimate (H) was calcu- lated by HICKORY software (Holsinger et al. 2002) with default parameters. To assess patterns of differentiation between barley subspecies, STRUCTURE 2.3 (Pritchard et al.
2010) was used to estimate the genetic differentiation among barley subspecies via a Bayesian method previously described by Wang et al. (2014). Principal co-ordinate anal- ysis (PCoA) was carried out with NTSYS pc2.1 (Rohlf 2000) using a genetic similarity matrix based on H. neighbor-joining (NJ) clustering via a weighted method was used to construct NJ trees. We calculated the linkage disequilibrium (LD) between pairs of DArT markers with a minor allele frequency <0.05 along landrace and wild barley chromo- somes with TASSEL software (Bradbury et al. 2007). LD was estimated by the squared- allele frequency correlations (r2) (Hill and Robertson 1968). ZnS (the average r2 values) of different chromosomes was based on significant r2 (P < 0.001).
To investigate artificial and natural selective pressures on genes and genome regions (DArT outliers) underlying the striking phenotypic changes, chromosome-level effects on barley were assessed by genetic differentiation (FST) and genetic diversity (H), respec- tively, between barley landraces and wild barley subspecies for polymorphic loci accord- ing to Russell et al. (2011). Here, a diagnostic marker is defined as having a frequency difference (Δflw) ≥0.4 between wild barley and barley landrace subspecies. The sliding window of rolling H is defined with the average of 15 consecutive values stepped by each DArT (Rostoks et al. 2006). A two-tailed t-test using the same sliding window approach for 15 consecutive individual loci H values was also undertaken in MS Excel 2010 (Russell et al. 2011). A significance of P < 0.01 between DArT loci in landrace and wild barley was chosen as a threshold corresponding to a posterior probability indicative of strong evidence for selection.
*Further details about the Electronic Supplementary Material (ESM) can be found at the end of the article.
Cereal Research Communications 46, 2018
Annotation of detected outliers
In previous publications (Wenzl et al. 2006; Pourkheirandish and Komatsuda 2007) both DArT and non-DArT markers were confirmed to be associated with agricultural traits.
Based on the high-density consensus map of DArT markers (Wenzl et al. 2006), putative domestication traits probably linked to the DArT outlier loci were deduced from the un- derlying non-DArT markers (within a ±2 cM interval). In addition, the approximate chro- mosomal locations of a subset of genes known to be important in barley evolution and adaptation were inferred based on previous work (Wenzl et al. 2006; Pourkheirandish and Komatsuda 2007; Faure et al. 2012; Kikuchi et al. 2012).
Results
Genetic differences between landraces and wild barley subspecies
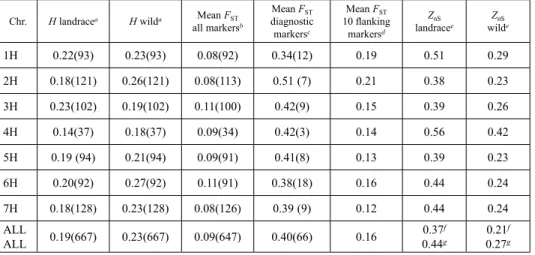
After discarding DArTs with missing values more than 20%, i.e. 667 mapped markers of which 647 were polymorphic retained for further analysis. Genome- and chromosome- level genetic diversity in wild barley was greater than in landraces (mean H of 0.27 and 0.24 at genome-level; mean H of 0.23 and 0.19 at chromosome-level, respectively; Table 1; Table S2). A further test of the difference based on (H) between barley landraces and wild barley was possible using nesting DArTs on individual chromosomes (mean H esti- mates by chromosome are provided in Table 1). The results revealed higher overall ge- netic diversity in wild than in landrace barley, except for 3H (Table 1). STRUCTURE
Table 1. Summary data for chromosome-level analysis of genetic diversity (H), genetic differentiation (FST) and linkage disequilibrium (ZnS) for barley landraces and wild barleys
Chr. H landracea H wilda Mean FST
all markersb
Mean FST
diagnostic markersc
Mean FST
10 flanking markersd
ZnS
landracee ZnS
wilde
1H 0.22(93) 0.23(93) 0.08(92) 0.34(12) 0.19 0.51 0.29
2H 0.18(121) 0.26(121) 0.08(113) 0.51 (7) 0.21 0.38 0.23
3H 0.23(102) 0.19(102) 0.11(100) 0.42(9) 0.15 0.39 0.26
4H 0.14(37) 0.18(37) 0.09(34) 0.42(3) 0.14 0.56 0.42
5H 0.19 (94) 0.21(94) 0.09(91) 0.41(8) 0.13 0.39 0.23
6H 0.20(92) 0.27(92) 0.11(91) 0.38(18) 0.16 0.44 0.24
7H 0.18(128) 0.23(128) 0.08(126) 0.39 (9) 0.12 0.44 0.24
ALLALL 0.19(667) 0.23(667) 0.09(647) 0.40(66) 0.16 0.37f
0.44g 0.21f 0.27g
a Based on the mapped markers and removed those with missing values more than 20%, numbers are given in parentheses.
b Based on the polymorphic markers in each subspecies and removed those with missing values more than 20%, numbers are given in parentheses. c Based on diagnostic markers, numbers are given in parentheses. d Based on the five adjacent markers on each side of diagnostic markers. eZnS values were calculated based on significant pairwise r2 (P < 0.001). f Value for all mapped markers (with a minor allele frequency <0.05) without chromosomal subdivision. gArithmetic average of the seven chromo- somes.
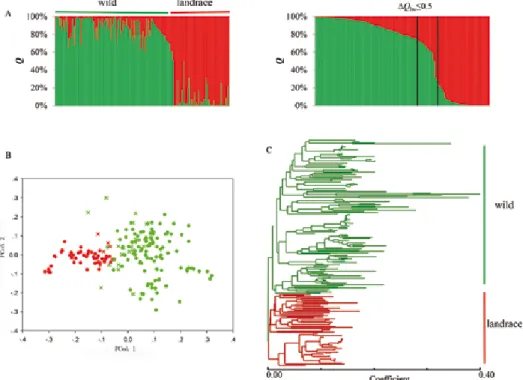
analysis (with K = 2) revealed a clear genetic differentiation at genome-level between barley landraces and wild barleys (Fig. 1A). However, 24 accessions (5 landraces and 19 wild barleys), showed patterns of mixed Q (member coefficient value) profiles (ΔQlw ≤ 0.5). PCoA placed the accessions into two defined groups (landrace and wild barley) according to the two first coordinates, which accounted for 55% of total variance (Fig. 1B). Neighbor-joining analysis also confirmed the two distinct groups, which are strictly consistent with our collected sample subspecies (Fig. 1C).
Detection of DArT outliers
As expected on the basis of their asymmetric distributions, the FST values for 66 diagnos- tic markers were outliers, with values ranging from 0.27 to 0.66 and a high mean of 0.40 (Table 1). Eliminating multiple markers at the same position, 49 loci were retained (Fig. 2A). More interestingly, the mean FST values for the set of 10 DArTs that flanked each of our diagnostic markers was a little higher than the mean value for all 647 poly-
Figure 1. Genetic differentiation between barley landraces and wild barley accessions from the Tibetan Plateau:
A: STRUCTURE results (K = 2) for genome-level analysis The 24 accessions having mixed profiles (ΔQlw ≤ 0.5) are contained within the vertical black bars. B: PCoA analysis based on Nei’s distance matrix between all pairs of individuals. Admixed individuals inferred by STRUCTURE are indicated using appropri- ately colored crosses. C: Neighbor-joining phylogenetic tree of 185 barley accessions. Red and green colors
represent landraces and wild barleys, respectively
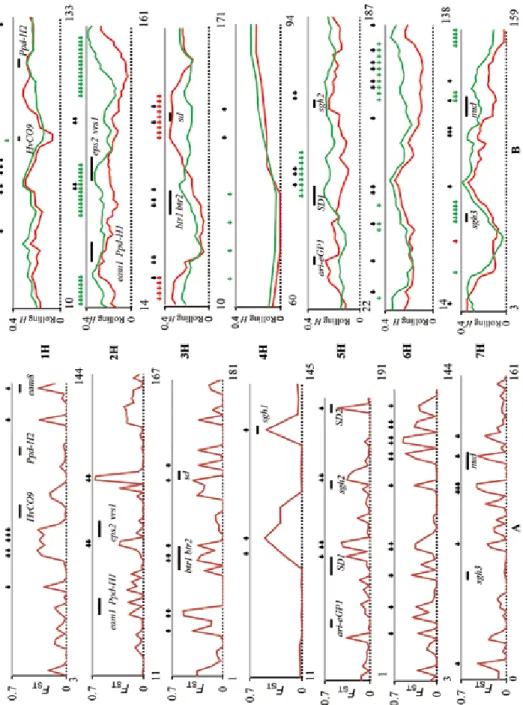
Figure 2. Outliers detected by genetic differentiation (FST) and genetic diversity (H) between barley landraces and wild barley accessions from the Tibetan Plateau: A: Genetic differentiation between landraces and wild barley accessions. Black arrows present the location of diagnostic DArT markers. B: Genetic diversity between landraces and wild barley accessions. Red and green arrows represent positions at which rolling t-tests of H estimates indicated these differences to be statistically significant (green arrows, wild significantly more diverse than landraces; red arrows, vice versa). DArT markers are given in map order (starting with the lowest cM value at the left or each chromosome; positions of the first and last DArT marker are given), but not on a cM scale
morphic mapped DArTs (0.16 vs. 0.09) (Table 1). Thus, FST values for DArTs adjacent to diagnostic markers were generally at the ‘background’ level, and there is no evidence that landrace-wild differentiation for DArTs extends to adjacent chromosomal regions (Fig. 2A).
Our result showed that differences were evident in rolling diversity values related to chromosome position, individual chromosome, and barley subspecies. Overall, diversity estimates varied less along chromosomes for wild materials than for landraces (Fig. 2B).
This was consistent with the fact that LD level was lower in wild barleys both on indi- vidual chromosomes and on the whole genome, resulting in a more even distribution of diversity (Table 1). Diversity profiles (Fig. 2B) indicated that, in particular chromosomal regions, both landrace and wild barley exhibited reductions in genetic variation that may represent population bottlenecks and selection processes. A comparison of landraces and wild barleys demonstrated, on occasion, contrasting levels of diversity (Fig. 2B). In total, 135 of 667 (20%) mapped DArTs showed a significant difference in diversity between subspecies. After ignoring markers sharing the same position on a chromosome, 96 mark- ers were retained (Fig. 2B). In 81 of them, wild barleys were more diverse than landraces, whereas in 15 this pattern was reversed, corresponding to expectations about whole ge- nome and whole chromosome analysis of diversity (Table 1; Table S2). In addition, six FST diagnostic markers (five in 3H and one in 7H) were in regions where landraces were more diverse than wild barley (Fig. 2B).
Annotation of the outliers
Annotation information of the detected outliers was processed mainly based on previous publications, 46 loci (regions) were annotated; 22 loci (regions) were detected by FST value with Δflw over 0.4, whereas 31 loci (regions) were detected by rolling H estimates with significance checked by two-tailed t-tests. Seven of these loci (regions) were de- tected by both methods (Table S3). To elucidate marker-trait associations, the traits linked with DArT or non-DArT markers around the outlier DArT markers are listed in Table S3.
In the vicinity of the outlier loci, the associated agricultural traits were related to different subspecies: physiological and phenotypical traits, disease resistance, and abiotic stress tolerance, malting quality and agronomic traits (Fig. 2).
Discussion
Genetic diversity and differentiation between the wild barley and barley landraces subspecies
The clear genetic differentiation and low diversity of landraces provide the basis of fur- ther scans at chromosome-level for selection footprints. Despite well-defined separation of landraces and wild barley, DArT analysis revealed intermediate STRUCTURE and PCoA profiles for 24 accessions (Fig. 1). The remarkable difference in flowering time and the brittle rachis suggest that hybridization between landraces and wild barleys should be rare (Pourkheirandish and Komatsuda 2007; Russell et al. 2011). Various authors have,
Cereal Research Communications 46, 2018
however, suggested that occasional outcrossing occurred in the Fertile Crescent (Badr et al. 2000; Pourkheirandish and Komatsuda 2007; Russell et al. 2011). Our data, especially the presence of 24 mixed individual accessions, also indicates some introgression be- tween landraces and wild barleys in the Tibetan Plateau (Fig. 1A). Because there are no crossing barriers between landraces and wild barleys (Pourkheirandish and Komatsuda 2007) combined with their sympatric distribution, especially in the Tibetan Plateau, it is likely that a certain frequency of introgression occurs between the two subspecies.
Signatures of selection
Of most interest is a comparison of DArT diversity patterns along chromosomes with the locations of significantly difference in genetic diversity between the two subspecies. Bar- ley domestication involved selection for three key traits, non-brittle rachis, six-rowed spike and naked caryopsis (Badr et al. 2000). Non-brittle rachis is associated with two tightly linked genes, btr1 and btr2, on the short arm of chromosome 3H (Pourkheirandish and Komatsuda 2007). During domestication, deletions in btr1 or btr2 converted the ra- chis to non-brittle (Pourkheirandish et al. 2015). Similar to previous studies of Rostoks et al. (2006) and Russell et al. (2011), our analysis also indicates a diagnostic locus and a reduction in diversity in landraces compared to wild barleys in this region (ca 65-70 cM) (Table S3; Fig. 2B). The six-rowed spike phenotype is controlled by a number of inde- pendent loci including recessive vrs1 on chromosome 2H (Tanno et al. 2002). Our data indicates significant differences in diversity between barley landraces and wild barley subspecies in the region around the vrs1 gene (Fig. 2B). This study also revealed signifi- cant differences around a single recessive gene, nud, located on chromosome 7HL (Fig. 2B), which controls the naked caryopsis character (Pourkheirandish and Komatsuda 2007). Selection footprints detected around these two regions are not surprising given that the landrace accessions assessed here were six-rowed naked barleys, which is the pre- dominant type in the Tibet.
Migration of barley to regions outside its place of origin was accelerated through mu- tations to reduce the vernalization requirement and enhance photoperiod insensitivity (von Bothmer et al. 2003). Three genes, Sgh1 (Vrn-H2), Sgh2 (Vrn-H1) and Sgh3 (Vrn-H3) (on chromosomes 4H, 5H and 7H, respectively) are associated with a reduced vernalization requirement in spring barley (Pourkheirandish and Komatsuda 2007). Our data provides evidence for higher diversity in wild barley in the chromosomal regions around these three genes especially for Sgh3, where the difference from landraces was statistically significant. Photoperiod insensitivity in cultivated types involved the accu- mulation of mutations in the Ppd-H1 and Ppd-H2 loci on chromosomes 2H and 1H, re- spectively (Pourkheirandish and Komatsuda 2007). Our analysis did not reveal signifi- cantly higher diversity in wild barleys around either Ppd-H1 or Ppd-H2. Considering the narrow geographic origins of our accessions with similar day length, this result is reason- able. Flowering time of barley is also associated with many other genes including HvCO9 (1H) (Kikuchi et al. 2012), eps2 (2H) (Boyd et al. 2003), eam8 (1H) (Faure et al. 2012), and eam1 (2H) (Boyd et al. 2003) etc. Our analysis provides evidence for a reduction in
diversity in landraces compared to wild germplasm in the chromosomal regions around the first three of these genes especially in eps2 and HvCO9, where the differences from landraces was statistically significant (Table S3 and Fig. 2). Several genes on 1H and 2H control flowering time and, therefore, facilitate short-season adaptation in extreme and harsh environments such as Tibet.
Pre-harvest sprouting results in significant economic losses around the world, espe- cially in the Tibetan Plateau where precipitation is mainly concentrated in the late grow- ing season. Two common major seed dormancy QTL (SD1 and SD2) have been identified in various studies (Li et al. 2004; Zhang et al. 2005). SD1 and SD2 are located near the centromere and the distal end of the long arm of chromosome 5H, respectively. Our anal- ysis reveals a diversity reduction in landraces compared with wild germplasm in the above two chromosomal regions, especially for SD1, where the difference from landraces was statistically significant (Fig. 2). GMS01 marker (at position 188.8 cM) closely linked with FST diagnostic markers (bpb-4809 and bpb-9660, at position 187.0 cM) (Table S3) has been associated with the pre-harvest sprouting trait controlled by SD2 (Li et al. 2004).
These results indicate that landrace progenitors from Tibet have undergone stringent phe- notypic selection for adequate seed dormancy to avoid highly undesirable pre-harvest sprouting.
Annotation for selection signals here also presents evidences of selection for biotic and abiotic stress resistance. On the whole, our data provides evidence for higher diversity in wild barley, with nine chromosomal regions dispersed on barley chromosomes. Among the outlier DArT markers, some are closely linked with other reported markers associated with resistance to various diseases including spot blotch, net blotch, stripe rust, leaf rust, and scald (details shown in Table S3). In addition, according to the previous reports (Jefferies et al. 1999; Cai et al. 2013), there are some regions – one each on 2H and 3H, and another nine on all chromosomes except 5H – which relate to selection for tolerance to boron and aluminum toxicity. Two regions (17.7–21.9 cM on 2H and 106.9 cM on 5H) demonstrate significant diversity differences between barley subspecies and are appar- ently associated with salinity tolerance (Table S3).
Interestingly, malting quality, grain color and weight also became target traits during domestication or post-domestication of barley from Tibet. Six selection regions dispersed on 1H, 2H, 3H and 7H, are associated with malting quality, including fine extract, β-glucan, diastatic power etc. (Table S3). It is not surprising that landraces from Tibet were subjected to stringent and diverse selection on malting qualities closely connected to utilization for brewing traditional qingke liquor. Barley grain at maturity can have yel- low, purple, blue, or black pigmentation caused by anthocyanins or by melanin-like pig- ments (Shoeva et al. 2016) protecting plants from the deleterious effects of UV light. In our study, the region 72.2–76.3 cM on 4HL (Table S3) reported to be linked with blue aleurone color loci (Li et al. 2003) was also highlighted by FST category diagnostic mark- ers, indicating association with the above linked Blx genes. An abundance of dark-colored barley grains from Tibet is perhaps the result of environmental selection responding to strong UV light in the high-altitude environment and retained by humans. Conscious se- lection focused on yield traits such as thousand kernel weight (TGW) and plant height are
Cereal Research Communications 46, 2018
typical targets of domestication. In this study we found a selection signal linked to TGW (Varshney et al. 2012) at position 122.7 cM on 6H and the Sd (dwarfing) gene on 3H with a significant reduction in diversity in landrace barley compared with wild germplasm (Fig. 2B) perhaps indicates a domestication bottleneck.
Several gene-rich regions under selection were identified in this study, which indicates that domestication and post-domestication of six-rowed naked barley from the Tibetan Plateau must have involved multi-target selection. This selection process on six-rowed naked barley is closely related to its utilization, agricultural practices, and the extreme environment in Tibet. It is clearly the result of interaction between artificial and natural selection. Thus, elucidation of the domestication and adaptation of barley from the Tibetan Plateau will assist in applying unique and mostly untapped genetic resources to barley improvement. Further clarification of the story of domestication of barley in this area will require analysis of genetic diversity in a larger collection of accessions and with a higher-resolution marker platform and a more precise map.
Acknowledgements
We appreciate the generous gifts of barley germplasm from Prof. Xiaogang Ma, duplicate database of the National Crop Germplasm Collection. This research was financially sup- ported by the Associate Scholar Program for the West Light Foundation of CAS, the Key research and development and transformation project of Qinghai Province (2016-NK- 131), the Construction Project for Innovation Platform of Qinghai province (2017-ZJ- Y14), the Qinghai Province Applied Basic Research Project (2015-ZJ-915Q).
References
Åberg E. 1938. Hordeum agriocrithon nova sp.: a wild six-rowed barley. Ann. Roy. Agric. Coll. Sweden 6:159–216.
Badr, A., Sch. R., Rabey, H.El., Effgen, S., Ibrahim, H., Pozzi, C., Rohde, W., Salamini, F. 2000. On the origin and domestication history of barley (Hordeum vulgare). Mol. Biol. Evol. 17:499–510.
Bauer, E., Weyen, J., Schiemann, A., Graner, A., Ordon, F. 1997. Molecular mapping of novel resistance genes against Barley Mild Mosaic Virus (BaMMV). Theor. Appl. Genet. 95:1263–1269.
Beattie, A.D., Edney, M.J., Scoles, G.J., Rossnagel, B.G. 2010. Association mapping of malting quality data from Western Canadian two-row barley cooperative trials. Crop Sci. 50:1649–1663.
Boyd, W.J.R., Li, C.D., Grime, C.R., Cakir, M., Potipibool, S., Kaveeta, L., Men, S., Kamali, M.R., Barr, A.R., Moody, D.B., Lance, R.C.M., Logue, S.J., Raman, H., Read, B.J. 2003. Conventional and molecular genetic analysis of factors contributing to variation in the timing of heading among spring barley (Hordeum vulgare L.) genotypes grown over a mild winter growing season. Aust. J. Agric. Res. 54:1277–1301.
Bradbury, P.J., Zhang, Z., Kroon, D.E., Casstevens, T.M., Ramdoss, Y., Buckler, E.S. 2007. TASSEL: software for association mapping of complex traits in diverse samples. Bioinformatics 23:2633–2635.
Brueggeman, R., Rostoks, N., Kudrna, D., Kilian, A., Han, F., Chen, J., Druka, A., Steffenson, B., Kleinhofs, A. 2002. The barley stem rust-resistance gene Rpg1 is a novel disease-resistance gene with homology to receptor kinases. Proc. Natl Acad. Sci. USA 99:9328–9333.
Cai, S., Wu, D., Jabeen, Z., Huang, Y., Huang, Y., Zhang, G. 2013. Genome-wide association analysis of alu- minum tolerance in cultivated and Tibetan wild barley. PLoS ONE 8:e69776.
Cakir, M., Poulsen, D., Galwey, N.W., Ablett, G.A., Chalmers, K.J., Platz, G.J., Park, R.F., Lance, R.C.M., Panozzo, J.F., Read, B.J., Moody, D.B., Barr, A.R., Johnston, P., Li, C.D., Boyd, W.J.R., Grime, C.R.,
Appels, R., Jones, M.G.K, Langridge, P. 2003. Mapping and QTL analysis of the barley population Tallon
× Kaputar. Aust. J. Agric. Res. 54:1155–1162.
Collins, H.M., Panozzo, J.F., Logue, S.J., Jefferies, S.P., Barr, A.R. 2003. Mapping and validation of chromo- some regions associated with high malt extract in barley (Hordeum vulgare L.). Aust. J. Agric. Res.
54:1223–1240.
Coventry, S.J., Barr, A.R., Eglinton, J.K., Mcdonald, G.K. 2003. The determinants and genome locations influ- encing grain weight and size in barley (Hordeum vulgare L.). Aust. J. Agric. Res. 54:1103–1115.
Dai, F., Nevo, E., Wu, D., Comadran, J., Zhou, M., Qiu L., Chen, Z., Beiles, A., Chen, G., Zhang, G. 2012.
Tibet is one of the centers of domestication of cultivated barley. Proc. Natl Acad. Sci. USA. 109:16969–
16973.
Doebley, J.F., Gaut, B.S., Smith, B.D. 2006. The molecular genetics of crop domestication. Cell 127:1309–
1321.
Doyle, J.J. 1990. Isolation of plant DNA from fresh tissue. Focus 12:13–15.
Edwards, M.C., Steffenson, B.J. 1996. Genetics and mapping of barley stripe mosaic virus resistance in barley.
Phytopathol. 86:184–187.
Excoffier, L., Lischer, H.E. 2010. Arlequin suite ver 3.5: a new series of programs to perform population genet- ics analyses under Linux and Windows. Mol. Ecol. Resour. 10:564–567.
Faure, S., Turner, A.S., Gruszka, D., Christodoulou, V., Davis, S.J., von Korff, M., Laurie, D.A. 2012. Mutation at the circadian clock gene EARLY MATURITY 8 adapts domesticated barley (Hordeum vulgare) to short growing seasons. Proc. Natl. Acad. Sci. USA. 109:8328–8333.
Garvin, D.F., Millergarvin, J.E., Viccars, E.A., Jacobsen, J.V., Brown, A.H.D. 1998. Identification of molecular markers linked to ant28-484, a mutation that eliminates proanthocyanidin production in barley seeds. Crop Sci. 38:1250–1255.
Genger, R.K., Williams, K.J., Raman, H., Read, B.J., Wallwork, H., Burdon, J.J., Brown, A.H.D. 2003. Leaf scald resistance genes in Hordeum vulgare and Hordeum vulgare ssp. spontaneum: parallels between culti- vated and wild barley. Aust. J. Agric. Res. 54:1335–1342.
Graner, A., Tekauz, A. 1996. RFLP mapping in barely of a dominant gene conferring resistance to scald (Rhynchosporium secalis). Theor. Appl. Genet. 93: 421–425.
Hill, W.G., Robertson, A. 1968. Linkage disequilibrium in finite populations. Theor. Appl. Genet. 38:226–231.
Holsinger, K.E., Lewis, P.O., Dey, D.K. 2002. A Bayesian approach to inferring population structure from dominant markers. Mol. Ecol. 11:1157–1164.
Hsu, T.W. 1975. On the origin and phylogeny of cultivated barley with reference to the discovery of Ganze wild two-rowed barley Hordeum spontaneum C. Koch. Acta Genet. Sin. 2:129–137. (in Chinese with English abstract)
Igartua, E., Moralejo, M., Casas, A.M., Torres, L., Molina-Cano, J.L. 2012. Whole-genome analysis with SNPs from BOPA1 shows clearly defined groupings of Western Mediterranean, Ethiopian, and Fertile Crescent barleys. Genet. Resour. Crop. Evol. 60:251–264.
Jefferies, S.P., Barr, A.R., Karakousis, A., Kretschmer, J.M., Manning, S., Chalmers, K.J., Nelson, J.C., Islam, A.K.M.R., Langridge, P. 1999. Mapping of chromosome regions conferring boron toxicity tolerance in barley (Hordeum vulgare L.). Theor. Appl. Genet. 98:1293–1303.
Kikuchi, R., Kawahigashi, H., Oshima, M., Ando, T., Handa, H. 2012. The differential expression of HvCO9, a member of the CONSTANS-like gene family, contributes to the control of flowering under short-day conditions in barley. J. Exp. Bot. 63:773–784.
Larson, S.R., Kadyrzhanova, D., Mcdonald, C., Sorrells, M., Blake, T.K. 1996. Evaluation of barley chromo- some-3 yield QTLs in a backcross F2 population using STS-PCR. Theor. Appl. Genet. 93:618–625.
Li, C., Ni, P., Francki, M., Hunter, A., Zhang, Y., Schibeci, D., Li, H., Tarr, A., Wang, J., Cakir, M., Yu, J., Bellgard, M. Lance, R., Appels, R. 2004. Genes controlling seed dormancy and pre-harvest sprouting in a rice-wheat-barley comparison. Funct. Integr. Genomics. 4:84–93.
Li, C.D., Lance, R.C.M., Collins, H.M., Tarr, A., Roumeliotis, S., Harasymow, S., Cakir, M., Fox, G.P., Grime, C.R., Broughton, S., Young, K.J., Raman, H., Barr, A.R., Moody, D.B., Read, B.J. 2003. Quantitative trait loci controlling kernel discoloration in barley (Hordeum vulgare L.). Aust. J. Agric. Res. 54:1251–1259.
Cereal Research Communications 46, 2018
Lonergan, P. F. 2001. Genetic characterisation and QTL mapping of zinc nutrition in barley (Hordeum vulgare).
Ph.D. thesis, University of Adelaide, Australia. http://hdl.handle.net/2440/21718
Mano, Y., Takeda, K. 1997. Mapping quantitative trait loci for salt tolerance at germination and the seedling stage in barley (Hordeum vulgare L.). Euphytica 94:263–272.
Meyer, R.C., Swanston, J.S., Young, G.R., Lawrence, P.E., Bertie, A., Ritchie, J., Wilson, A., Brosnan, J., Pearson, S., Bringhurst, T., Steele, G., Aldis, P.R., Filed, M., Jolliffe, T., Powell, W., Thomas, W.T.B. 2001.
A genome based approach to improving barley for the malting and distilling industries. HGCA Project Report 264. https://cereals.ahdb.org.uk/media/379983/264_complete_final_report.pdf Scottish Crop Research Institute pp. 70–74.
Nei, M. 1978. Estimation of average heterozygosity and genetic distance from a small number of individuals.
Genetics 89:583–590.
Nevo, E. 2013. Evolution of wild barley and barley improvement. In: Zhang, G.P., Li, C.D., Liu, X. (eds), Advance in barley sciences. Springer. Dordrecht, The Netherlands. pp. 1–23.
Park, R.F., Karakousis, A. 2002. Characterization and mapping of gene Rph19 conferring resistance to Puccinia hordei in the cultivar ‘Reka 1’ and several Australian barleys. Plant Breed. 121:232–236.
Pourkheirandish, M., Hensel, G., Kilian, B., Senthil, N., Chen, G., Sameri, M., Azhaguvel, P., Sakuma, S., Dhanagond, S., Sharma, R., Mascher, M., Himmelbach, A., Gottwald, S., Nair, S.K., Tagiri, A., Yukuhiro, F., Nagamura, Y., Kanamori, H., Matsumoto, T., Willcox, G., Middleton, C.P., Wicker, T., Walther, A., Waugh, R., Fincher, G.B., Stein, N., Kumlehn, J., Sato, K., Komatsuda, T. 2015. Evolution of the grain dispersal system in barley. Cell 162:527–539.
Pourkheirandish, M., Komatsuda, T. 2007. The importance of barley genetics and domestication in a global perspective. Ann. Bot. 100:999–1008.
Pritchard, J.K., Wen, X., Falush, D. 2010. Documentation for structure software: Version 2.3. University of Chicago, Chicago, IL.
Raman, H., Platz, G.J., Chalmers, K.J., Raman, R., Read, B.J., Barr, A.R., Moody, D.B. 2003. Mapping of genomic regions associated with net form of netblotch resistance in barley. Aust. J. Agric. Res. 54:1359–
1367.
Read, B.J., Raman, H., Mcmichael, G., Chalmers, K.J., Ablett, G.A., Platz, G.J., Raman, R., Genger, R.K., Boyd, W.J.R., Li, C.D., Grime, C.R., Park, R.F., Wallwork, H., Prangnell, R., Lance, R.C.M. 2003. Mapping and QTL analysis of the barley population Sloop × Halcyon. Aust. J. Agric. Res. 54:1145–1153.
Ren, X., Nevo, E., Sun, D., Sun, G. 2013. Tibet as a potential domestication center of cultivated barley of China. PLoS ONE 8:e62700.
Rohlf, F.J. 2000. NTSYS-pc Numerical taxonomy and multivariate analysis system, version 2.1. Exeter Software, New York.
Rostoks, N., Ramsay, L., MacKenzie, K., Cardle, L., Bhat, P.R., Roose, M.L., Svensson, J.T., Stein, N., Varshney, R.K., Marshall, D.F., Graner, A., Close, T.J., Waugh, R. 2006. Recent history of artificial out- crossing facilitates whole-genome association mapping in elite inbred crop varieties. Proc. Natl Acad. Sci.
USA. 103:18656–18661.
Roy, J.K., Smith, K.P., Muehlbauer, G.J., Chao, S., Close, T.J., Steffenson, B.J. 2010. Association mapping of spot blotch resistance in wild barley. Mol. Breed. 26:243–256.
Russell, J., Dawson, I.K., Flavell, A.J., Steffenson, B., Weltzien, E., Booth, A., Ceccarelli, S., Grando, S., Waugh, R. 2011. Analysis of >1000 single nucleotide polymorphisms in geographically matched samples of landrace and wild barley indicates secondary contact and chromosome-level differences in diversity around domestication genes. New Phytol. 191:564–578.
Shoeva, O.Y., Mock, H.-P., Kukoeva, T.V., Börner, A., Khlestkina, E.K. 2016. Regulation of the flavonoid Biosynthesis Pathway Genes in Purple and Black Grains of Hordeum vulgare. PloS one 11:e0163782 Spaner, D., Shugar, L.P., Choo, T.M., Falak, I., Briggs, K.G., Legge, W.G., Falk, D.E., Ullrich, S.E., Tinker,
N.A., Steffenson, B.J., Mather, D.E. 1998. Mapping of disease resistance loci in barley on the basis of visual assessment of naturally occurring symptoms. Crop. Sci. 38:843–850.
Steffenson, B.J., Hayes, P. M., Kleinhofs, A. 1996. Genetics of seedling and adult plant resistance to net blotch (Pyrenophora teres f. teres) and spot blotch (Cochliobolus sativus) in barley. Theor. Appl. Genet. 92:552–
558.
Tanno, K., Taketa, S., Takeda, K., Komatsuda, T. 2002. A DNA marker closely linked to the vrs1 locus (row- type gene) indicates multiple origins of six-rowed cultivated barley (Hordeum vulgare L.). Theor. Appl.
Genet. 104:54–60.
Tashi, N., Tang, Y., Zeng, X. 2013. Food preparation from hulless barley in Tibet. In: Zhang, G.P., Li, C.D., Liu, X. (eds), Advance in barley sciences. Springer. Dordrect, The Netherlands. pp. 151–158.
Varshney, R.K., Paulo, M.J., Grando, S., van Eeuwijk, F.A., Keizer, L.C.P., Guo, P., Ceccarelli, S., Kilian, A., Baum, M., Graner, A. 2012. Genome wide association analyses for drought tolerance related traits in barley (Hordeum vulgare L.). Field Crop Res. 126:171–180.
von Bothmer, R., Sato, K., Komatsuda, T., Yasuda, S., Fischbeck, G. 2003. The domestication of cultivated barley. In: von Bothmer, R., van Hintum, T., Knüpffer, H., Sato, K. (eds), Diversity in barley (Hordeum vulgare). Elsevier, Amsterdam. pp. 9–27.
Wang, L., Xu, J.Q., Xia, T.F., Zhang, H.G., Liu, D.C., Shen, Y.H. 2014. Population structure and linkage dis- equilibrium in six-rowed barley landraces from the Qinghai-Tibetan Plateau. Crop. Sci. 54:2011–2022.
Wenzl, P., Li, H., Carling, J., Zhou, M., Raman, H., Paul, E., Hearnden, P., Maier, C., Xia, L., Caig, V., Ovesná, J., Cakir, M., Poulsen, D., Wang, J., Raman, R., Smith, K.P., Muehlbauer, G.J., Chalmer, K.J., Kleinhofs, A., Huttner, E., Kilian, A. 2006. A high-density consensus map of barley linking DArT markers to SSR, RFLP and STS loci and agricultural traits. BMC Genomics 7:206.
Williams, K.J., Lichon, A., Gianquitto, P., Kretschmer, J.M., Karakousis, A., Manning, S., Langridge, P., Wallwork, H. 1999 Identification and mapping of a gene conferring resistance to the spot form of net blotch (Pyrenophora teres f. maculata) in barley. Theor. Appl. Genet. 99:323–327.
Wu, D., Qiu, L., Xu, L., Ye, L., Chen, M., Sun, D., Chen, Z., Zhang, H., Jin, X., Dai, F., Zhang, G. 2011. Genetic variation of HvCBF genes and their association with salinity tolerance in Tibetan annual wild barley. PLoS ONE 6:e22938.
Zhang, F., Chen, G., Huang, Q., Orion, O., Krugman, T., Fahima, T., Korol, A.B., Nevo, E., Gutterman, Y. 2005.
Genetic basis of barley caryopsis dormancy and seedling desiccation tolerance at the germination stage.
Theor. Appl. Genet. 110:445–453.
Zhou, T.-S., Takashi, I., Ryouichi, K., Naohiko, H., Makoto, K., Takehiro, H., Kazuhiro, S. 2012. Malting qual- ity quantitative trait loci on a high-density map of Mikamo golden × Harrington cross in barley (Hordeum vulgare L.). Mol. Breed. 30:103–112.
Electronic Supplementary Material (ESM)
Electronic Supplementary Material (ESM) associated with this article can be found at the website of CRC at https://akademiai.com/loi/0806
Electronic Supplementary Table S1. Description of barley germplasm used in the study (1–59 represent land- races, 60–185 wild barleys with brittle rachis)
Electronic Supplementary Table S2. Summary data for genome-level analysis of DArT markers scored in land- races and wild barley accessions collected from the Tibetan Plateau
Electronic Supplementary Table S3. Traits linked with the outlier DArT markers presenting evidence of selec- tion
Electronic Supplementary Figure S1. Geographic locations of landraces and wild barley samples collected from the Tibetan Plateau