Improving Pedigree Selection in Applied Breeding of Barley Populations
V. Greveniotis1,2*, S. Zotis2**, E. Sioki3 and C.G. Ipsilandis4
1Department of Agricultural Development, Democritus University of Thrace, Orestiada, 68200, Greece
2Department of Agricultural Technologists, School of Agricultural Technology, Food Technology and Nutrition, Technological Educational Institution of Western Macedonia, Florina, 53100, Greece
3Hellenic Agricultural Organization-’’Demeter’’, National Center For Quality Control, Classification & Standardization of Cotton, 1st km Karditsa-Mitropolis, 43100, Karditsa, Greece
4Regional Administration of Central Macedonia, Department of Agriculture, Thessaloniki 54622, Greece (Received 9 June 2018; Accepted 30 October 2018;
Communicated by M. Taylor)
The objectives of this study were (a) to compare the effectiveness of the two methods of pedigree selection in barley: the ear-to-row classical pedigree method and the honeycomb method and (b) the evaluation of the selection criteria of the honeycomb methodology. Five F12 lines developed by classical pedigree method were used as checks in order to compare seven lines developed by honeycomb methodology. Five honeycomb pedigree lines were selected by PYI basic selection criterion of honeycomb methodology and two more (rejected by PYI) were selected by YC, a new criterion proposed for improving selection of high yielding plants in honeycomb design. Also, the original local population from which all these lines were derived and two commercial barley cultivars were used as the basic checks. All genotypes selected by classical and honeycomb pedigree method out yielded the original local population. Many of them reached or out yielded the commercial cultivars used as checks and thus both classical and honeycomb pedigree methods were able to promote some homozygous genotypes in order to be used as new cultivars. Yield performance of progeny lines selected by classical pedigree method was better than honeycomb’s. Only when YC was used as selection criterion honeycomb pedigree lines showed high yielding perfor- mance. Comparing PYI and YC selection criteria, it seems that the second is better for pro- moting high yielding and stable lines for next generations to be used as future new cultivars.
Grain yield and bulk density are safer traits than 1000-kernel weight, for efficient selection that ensures high and stable yields.
Keywords: local population, honeycomb, selection effectiveness, pedigree
Abbreviations: NR-0 – Non-replicated Honeycomb design; R-21 – Replicated Honey- comb design with 21 entries (families); RCB – Randomized Complete Block design; PYI – Plant yield index: PYI = (x/xr)2; CH – Coefficient of Homeostasis: CH = (x/s)2; x.PYI – new Yielding Coefficient, (YC) i.e. PYI multiplied by individual plant yield; s-PE – line evalua- tion prognostic equation: s-PE = (x/xr)2 ∙ (x/s)2, where x is the single-plant yield, xr is the average yield of the surrounding plants within a moving ring of a chosen size, x and s are the progeny line mean and standard deviation; CV – Coefficient of Variation
*Corresponding author; E-mail: vgreveni@mail.com
**Late author
Introduction
Breeding for development of new cultivars must result in high and stable (across environ- ments) yield performance. Early stage evaluation is usually of limited success (Tapsell and Thomas 1983), for this many methods have been proposed in order to enhance effi- ciency of selection. Fasoulas (1988, 1993) proposed single plant as the unit of selection, in order to improve yielding potential. He also stated that soil heterogeneity and plant-to- plant competition may reduce selection effectiveness during breeding procedure along with genes that improve individual plant yield and stability. Honeycomb methodology and field designs proposed by Fasoulas (1988, 1993), are suitable for individual plant evaluation and capable of reducing deviations due to plant-to-plant competition and soil heterogeneity that reduces selection efficiency (Vollmann et al. 2000). The pedigree method is widely used in self-pollinated species, applying selection in certain plants and their progeny lines without mixing seeds of different pedigree lines (Allard 1960). Ear-to- row is a basic pedigree method for improving cereals and especially for barley (Hordeum vulgare L.) NDSU breeding scheme is preferred for shorting breeding program (Horsley et al. 2009). On the other hand, honeycomb methodology presupposes an extreme favora- ble environment for plant evaluation in the absence of competition that has to be investi- gated in comparison to classical pedigree selection schemes and in conditions that are close to farmer’s practice.
Comparing honeycomb to standard experimental designs, Samphantharak and Tan- apong (2003) found that moving circle honeycomb selection identified highest number of diverse and of good combination inbred lines, followed by other selection schemes when tested in conventional plant spacing, 0.75 by 0.25 m. Top-7 crosses were derived from top-5 inbreds of moving circle selection while only 4 crosses in the top-7 were derived from top-5 inbreds of other methods. The results suggested that moving circle selection was the most effective method of selection. In a recent study (Greveniotis et al. 2012), selection was based on the two basic equations of honeycomb evaluation: one to estimate the yield genetic potential of single plants and the other the yield genetic potential of en- tries/ lines. The results were promising because of enhanced gene fixation and exploita- tion of useful additive gene action. The high selection pressures led to homogeneous half-sib lines reaching the productivity and stability of ‘Costanza’. Utilization of such lines in the production of hybrids is expected to increase the crop yield potential, while progressive line improvement could reduce the line-to-hybrid productivity gap. Thus, progressive exploitation of favorable additive alleles was realized when ultra-low plant densities were used. As a general conclusion, comparable evaluation of tested progenies requires concurrent selection among and within progenies and application of high selec- tion pressures. The intense selection procedure reduces genotype × environment interac- tion and increases heritability (Koutsika-Sotiriou et al. 2013).
Local populations (also referred as landraces) are heterogeneous genetic materials consisted consisting of sibling lines that are reproduced by farmers in certain geographi- cal regions and which exhibit special traits and adaptability in these local conditions (Bellucci et al. 2013). This specific adaptation has been exploited in breeding programs, especially in unfavorable conditions. Usually, farmers with small farms or marginal lands
are dependent on traditional varieties that are adapted to local conditions. Landraces orig- inated with organized agriculture and today may be well established varieties in certain areas (Zeven 1998). Especially in Greece, landraces are mainly cropped in remote rural areas for local use because of their high quality. These landraces are expected to be pure line mixtures with good yielding performance under modern cropping conditions (Agorastos and Goulas 2005). In barley, these local populations may contribute in ge- netic diversity for breeding purposes (Backes et al. 2009). This genetic diversity has un- dergone a thorough investigation in barley by many researchers (Hamza et al. 2004; Hou et al. 2005). This mixture of homozygous genotypes may highlight a few promising ma- terials with good and stable performance (Moghaddam et al. 1997). Until now, local pop- ulations were evaluated in comparison to each other for certain traits (Weltzien 1988), but a question that has to be answered is about their ability to promote some homozygous genotypes in order to be used as new cultivars, after a successful evaluation stage.
The objectives of this study were (a) to compare the effectiveness of the two methods of pedigree selection: the ear-to-row pedigree method and the honeycomb method in a local barley population, and (b) the evaluation of the selection criteria (prediction equa- tion of individual plants) of the honeycomb methodology.
Materials and Methods
A pedigree selection scheme was conducted from 1994 to 2005 in a local barley popula- tion of Florina, Western Macedonia, Greece. Ear-to-row method based on yield measure- ments, selected the best plants and subsequently the best pedigree lines. All experiments were conducted in the farm of TEI of Western Macedonia in Florina. The first three years, 554, 320 and 54 best pedigree lines have been selected for the next generation on the basis of their yield, in comparison to the initial local population and commercial cultivar Cannon. The next three years involved a partially lattice design for line evaluation and selection in comparison to the initial local population and commercial cultivars Cannon and Plaisant and only 21 lines were selected at each cycle. Finally, an additional evalua- tion for seven years was conducted in order to depict the 11 best lines. Especially, the four last years of the procedure depicted the four best lines across years and one additional line that showed the worst measurements. These five F12 lines (4 high yielding and 1 low yielding pedigree lines) were compared in our study.
Honeycomb evaluation started in 2008, in the farm of TEI of Western Macedonia in Florina. Selection of individual plants was based on honeycomb methodology (Fasoulas 1988; Fasoula 2013). In initial populations non-replicated honeycomb designs (NR-0) were used (Figure S1*), as described by Fasoulas (1988). In progeny lines evaluation replicated designs were used (R-21), presented in Figure S2 (Fasoulas 1988). In all ex- periments, the plant-to-plant spacing was wide to avoid competition (Fasoulas 1988;
Fasoula 2013). Selection was based on moving circle (or moving ring), by comparing neighbouring plants in a closed area of low heterogeneity (Figures S1 and S2). In non-
*Further details about the Electronic Supplementary Material (ESM) can be found at the end of the article.
replicated designs, superior plants and lines were selected using the plant yield index PYI = (x/xr)2; proposed by Fasoula (2006, 2013). In replicated designs, superior lines were selected by the line evaluation equation s-PE = (x/xr)2 ∙ (x/s)2, where x is the single-plant yield, xr is the average yield of the surrounding plants within a moving ring of a chosen size, x and s are the progeny line mean and standard deviation (Fasoula 2006, 2013). Ini- tially (first year of honeycomb evaluation), a NR-0 (Fasoulas 1988) was established with 500 plants of the same local barley population. Plant-to-plant spacing was 1 m. Four seeds were planted in November in each hill position and thinned to one plant. Selection of individual plants was performed based on the PYI and the 10 highest yielding plants were selected for the next cycle, under a selection pressure of 2%. In parallel, PYI was transformed in x.PYI, here called Yielding Coefficient (YC), where x was the individual plant yield, in order to improve selection of high yielding plants in honeycomb design.
Also, 10 additional plants were selected for the next cycle according to high individual plant yield but PYI rejected those plants. The best two of them were proposed by YC.
Next year an R-21 honeycomb design evaluated the 10 PYI selected family lines and the 10 high yielding (but PYI rejected) family lines, plus the initial local population as a check. The s-PE % line evaluation equation was used in order to evaluate the 21 genetic materials for yielding performance and stability. Additionally, stability estimations based on Stability (%) or CV–1(%) (Fasoulas 1993), Coefficient of Homeostasis CH% (Fasoula 2006, 2013) and family CV (Fasoulas 1988). The two highest yielding lines were selected (they were derived from selection of high yielding plants in NR-0 and also proposed by YC). Also, five of the best ranked lines according to s-PE % (and derived from PYI se- lected plants) were selected for next generation evaluation.
In 2010–2011 and 2011–2012 periods, two Randomized Complete Block (RCB) de- signs were established in the farm of TEI of Western Macedonia in Florina. The seven F4 lines selected from R-21 honeycomb were evaluated in both years, with the five F12 lines (4 high yielding and 1 low yielding pedigree lines) that were developed by ear-to-row method as basic checks and three additional checks: the initial local population and culti- vars Cannon and Plaisant. Each plot consisted of seven lines distanced 25 cm each other, 5 m long. Four replications were used. Grain yield (GY) in Mg ha–1, 1000-kernel weight (TKW) in g and the specific weight (bulk density) in gL–1 of each plot were measured.
ANOVA was performed for each year separately and in total as well (year as additional factor). The genetic materials were considered as the fixed factor. Analyses were based on Steel and Torrie (1980) and means were separated according to Duncan’s method. Total Sum of Squares was used to estimate the contribution of the two factors (genetic materials and year) based on expected mean squares of the model (McIntosh 1983). The cultivar phenotypic variance (σ2p) and genetic variance (σ2g) were computed (McIntosh 1983).
The broad sense heritability estimation (H2) was calculated as σ2g/σ2p ratio (Guillen- Portal et al. 2004). Finally, genotypic variability coefficient (GCV) and phenotypic vari- ability coefficient (PCV) and genetic advance (GA) have been calculated according to Johnson et al. (1955) and Joseph et al. (2015). Correlations between F3 and F4 lines for each method were performed according to Pearson coefficient (Steel and Torrie 1980).
Results
Table S1 presents the evaluation data of NR-0 honeycomb, including entries, individual plant yields and the two criteria PYI and proposed YC. Highest individual plant yield reached 67.2 g, while the top 1% yielded over 64 g. Comparing PYI (the classical selec- tion criterion of honeycomb) with proposed YC at 1% intensity level, there was 100%
agreement of selected plants. At 2% level the two criteria had an 80% agreement, since two high yielding plants were proposed by YC. At the 4% level the agreement reached 90% and at the 6% level agreement was found 100%. Figure S3, presents graphically the agreement of the two criteria, where it is clear that at the 1% level (ultrahigh selection intensity) honeycomb selects successfully high yielding plants within the homogeneity ring of selection, while from 2–4% (high selection intensity) the PYI criterion fails to select some promising and high yielding plants, until the 6% level (medium selection intensity) is reached where the two criteria showed 100% agreement. After this level (>6%), PYI deviates considerably, as agreement declines.
In Table S2, F3 line evaluation under R-21 is presented (including original local popu- lation), with various stability estimations. Five lines selected by PYI criterion and exhib- ited high s-PE% (classical criteria of honeycomb methodology), were also selected for next generation RCB evaluation. The two high yielding lines (proposed by YC), exhibited
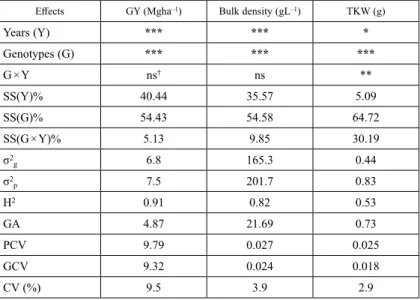
Table 1. Factor analyses (ANOVA) for each trait: grain yield (GY in Mgha–1), 1000-kernel weight (TKW in g) and specific weight (bulk density in gL–1). Estimations of Sum of Squares for years SS(Y)%, Sum of Squares for genotypes SS(G)%, Sum of Squares for interaction SS(G × Y)%, genetic variability (σ2g), phenotypic variability (σ2p), genetic advance (GA), heritability (H2), phenotypic CV% (PCV), genotypic CV% (GCV) and
experimental across-years coefficient of variation CV (%)
Effects GY (Mgha–1) Bulk density (gL–1) TKW (g)
Years (Y) *** *** *
Genotypes (G) *** *** ***
G × Y ns† ns **
SS(Y)% 40.44 35.57 5.09
SS(G)% 54.43 54.58 64.72
SS(G × Y)% 5.13 9.85 30.19
σ2g 6.8 165.3 0.44
σ2p 7.5 201.7 0.83
H2 0.91 0.82 0.53
GA 4.87 21.69 0.73
PCV 9.79 0.027 0.025
GCV 9.32 0.024 0.018
CV (%) 9.5 3.9 2.9
*Significant at the 0.05 probability level.
**Significant at the 0.01 probability level.
***Significant at the 0.001 probability level.
†ns – not significant.
the highest yields in F3 (49.7 and 49.1 g) and high s-PE% (over 70) and they were also selected for next generation RCB evaluation. One line showed 100% to all stability esti- mations, but since it was not high yielding in F3 (as it was found in NR-0 evaluation), it was not selected. Table 1, presents ANOVA data for all traits measured, plus estimations of Sum of Squares for years SS(Y)%, Sum of Squares for genotypes SS(G)%, Sum of Squares for interaction SS(G × Y)%, genetic variability (σ2g), phenotypic variability (σ2p), genetic advance (GA), heritability (H2), phenotypic CV% (PCV), genotypic CV% (GCV) and experimental across-years coefficient of variation CV (%). ANOVA showed statisti- cally significant differences between years and also genotypes for all measurements. For TKW a significant interaction between years and genotypes was found. SS(G)% was found over 54% for all measurements, indicating that genotype is the most significant factor in total variation. Genetic variability (σ2g) was found 6.8 for GY, 165.3 for bulk density and 0.44 for TKW, while phenotypic variability (σ2p) was found 7.5, 201.7 and 0.83 for respective traits. Heritability was higher for GY (0.91) followed by bulk density and genetic advance was higher for bulk density (21.69) followed by GY. TKW showed too low values. GCV was too close to PCV, except for TKW. Experimental CV was found high (9.5%) for GY, but relative low for bulk density and TKW. Table S3 presents total comparisons of means across the two years for each trait measurement: grain yield (GY in Mg ha–1), 1000-kernel weight (TKW in g) and specific weight (bulk density in gL–1) of the 12 progeny lines, plus the means of all methods used with the three checks. As it is clearly seen, lines selected by pedigree method (F8 progenies) yielded much better (3.99 Mgha–1) than honeycomb PYI selected lines (3.53 Mgha–1) and the mean of checks (3.5 Mgha–1). High yielding lines from honeycomb (rejected by PYI) yielded also better (3.84 Mgha–1) than honeycomb PYI selected lines and close to pedigree selected lines.
Local population was always inferior to all lines developed. The better yielding line reached 4.28 Mgha–1. For bulk density, the general view showed similar results, although in some cases measurements were close to each other (especially for commercial culti- vars). Again best line was developed by pedigree method (547 gL–1), with a mean of these progeny lines at 540.9 gL–1. For TKW the results were more complex, but again pedigree method selected lines (36.33 g) and high yielding honeycomb lines (36.88 g) were better than honeycomb PYI selected lines.
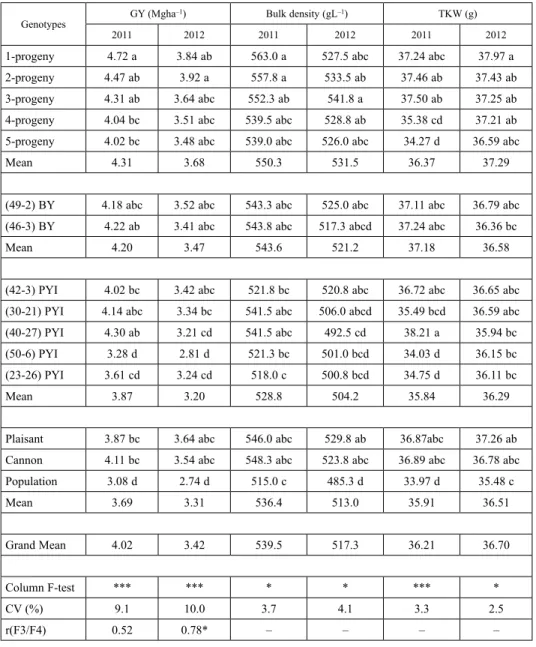
Table 2 presents comparisons of means for the two years separately (2011, 2012) for each trait measurement: grain yield (GY in Mgha–1), 1000-kernel weight (TKW in g) and spe- cific weight (bulk density in gL–1) of the 12 progeny lines of all methods used, plus the means of respective genetic materials per year (including year grand means), with the three checks and the experimental CV values and F3/F4 correlation coefficients. Year 2012 af- fected negatively yielding performance for GY and bulk density. For GY mean of 2011 reached 4.02 Mgha–1, but in 2012 it was 3.42 Mgha–1. For bulk density mean of 2011 reached 539.5 gL–1, but in 2012 it was 517.3 gL–1. For TKW there was found a strong GxY interaction (presented in Table 1) and thus values within each year and genotype had a def- erent response. Experimental CVs for each year were greater for GY (over 9%) and lower for other traits (lower than 4.1%). F3/F4 correlations for GY for the seven honeycomb lines were 0.52 (without statistically significant difference from 0) for 2011 and 0.78 for 2012.
Table 2. Comparisons of means for the two years separately (2011, 2012) for each trait measurement: grain yield (GY in Mgha–1), 1000-kernel weight (TKW in g) and specific weight (bulk density in gL–1) of the 12 progeny lines of all methods used (5 F8 progeny, 5 F4 honeycomb PYI and 2 F4 honeycomb best yielding lines-BY), plus the means of respective genetic materials per year (including year grand means), with the three checks (Plaisant, Cannon, local population) and the experimental CV values and F3/F4 correlation coefficients
for the seven honeycomb lines
Genotypes GY (Mgha–1) Bulk density (gL–1) TKW (g)
2011 2012 2011 2012 2011 2012
1-progeny 4.72 a 3.84 ab 563.0 a 527.5 abc 37.24 abc 37.97 a
2-progeny 4.47 ab 3.92 a 557.8 a 533.5 ab 37.46 ab 37.43 ab
3-progeny 4.31 ab 3.64 abc 552.3 ab 541.8 a 37.50 ab 37.25 ab
4-progeny 4.04 bc 3.51 abc 539.5 abc 528.8 ab 35.38 cd 37.21 ab
5-progeny 4.02 bc 3.48 abc 539.0 abc 526.0 abc 34.27 d 36.59 abc
Mean 4.31 3.68 550.3 531.5 36.37 37.29
(49-2) BY 4.18 abc 3.52 abc 543.3 abc 525.0 abc 37.11 abc 36.79 abc (46-3) BY 4.22 ab 3.41 abc 543.8 abc 517.3 abcd 37.24 abc 36.36 bc
Mean 4.20 3.47 543.6 521.2 37.18 36.58
(42-3) PYI 4.02 bc 3.42 abc 521.8 bc 520.8 abc 36.72 abc 36.65 abc
(30-21) PYI 4.14 abc 3.34 bc 541.5 abc 506.0 abcd 35.49 bcd 36.59 abc
(40-27) PYI 4.30 ab 3.21 cd 541.5 abc 492.5 cd 38.21 a 35.94 bc
(50-6) PYI 3.28 d 2.81 d 521.3 bc 501.0 bcd 34.03 d 36.15 bc
(23-26) PYI 3.61 cd 3.24 cd 518.0 c 500.8 bcd 34.75 d 36.11 bc
Mean 3.87 3.20 528.8 504.2 35.84 36.29
Plaisant 3.87 bc 3.64 abc 546.0 abc 529.8 ab 36.87abc 37.26 ab
Cannon 4.11 bc 3.54 abc 548.3 abc 523.8 abc 36.89 abc 36.78 abc
Population 3.08 d 2.74 d 515.0 c 485.3 d 33.97 d 35.48 c
Mean 3.69 3.31 536.4 513.0 35.91 36.51
Grand Mean 4.02 3.42 539.5 517.3 36.21 36.70
Column F-test *** *** * * *** *
CV (%) 9.1 10.0 3.7 4.1 3.3 2.5
r(F3/F4) 0.52 0.78* – – – –
*Significant at the 0.05 probability level.
***Significant at the 0.001 probability level.
The same letters mean lack of significant differences at P ≤ 0.05.
Discussion
Breeders of self-pollinating plants need an original F2 population or a mixture of pure lines as starting materials and then they apply pedigree selection to succeeding F3-, F4-, F5-lines originating from self-pollination (Iliadis et al. 2003). Pure line selection method (pedigree method), does not develop new genotypes but selects promising materials re- cording pedigree for several generations. Under that point of view, improvement of a lo- cal population is focusing in isolating best genotypes already existing in original popula- tion. The comparison of honeycomb pedigree method against classical pedigree method aroused because of the need to depict the more efficient selection scheme in a breeding program (Samphantharak and Tanapong 2003; Stratilakis and Goulas 2003).
In our study for honeycomb methodology we used two criteria of selecting plants in NR-0: PYI and proposed YC. At 2% level the two criteria had an 80% agreement, since two high yielding inbreds were proposed by YC. At the 4% level the agreement reached 90% and at 6% level agreement was found 100%. After this level (>6%), PYI deviates considerably as agreement declines, because high yielding plants are not proposed by PYI. That is why Fasoula (2013) proposed high selection pressure for enhancing effi- ciency of selection based on PYI. Subsequently, high selection pressure leads to a rapid and extended gene fixation. She also concluded that this gene fixation unifies breeding methodology of inbreeders and outbreeders. In R-21, the two high yielding lines pro- posed by YC, exhibited higher yields in F3 compared to PYI selected lines and also high s-PE% and stability. Environments may distort and reduce stability (Ceccarelli et al.
1991), and thus, except high yielding performance, stability estimations are valuable for efficient selection in a breeding program. Reverse value of CV or HC% reveals stability due to tolerance to stresses (Fasoula and Fasoula 2000). The seven honeycomb selected lines were included among the best lines for HC%. Generally, low CV is considered as a stabilization factor of individual plant grown in favourable conditions (Fasoulas 1988;
Fasoula and Fasoula 2000). In wide plant spacing CV is an indicator of the optimal plant- to-plant distant, in order to have accurate yield estimations (Iliadis et al. 2003; Kotzama- nidis et al. 2009).
ANOVA showed great differences between genotypes, or between years for all traits and a significant G × Y interaction for TKW. Since all genotypes selected by classical and honeycomb pedigree method out yielded original population, breeding procedure is con- sidered successful. For GY, classical pedigree selection resulted in five high yielding progenies that out yielded the original population by 37% (47% the best progeny line), honeycomb YC selected lines out yielded the original population by 32% (33% the best progeny line) and honeycomb PYI selected lines out yielded the original population by 21% (29% the best progeny line). Heritability was higher for GY followed by bulk den- sity, and genetic advance was higher for bulk density followed by GY. TKW showed too low values, indicating that breeding with basic measurement (criterion) the TKW may be inefficient, although experimental CV for TKW is relative low. After all, TKW is sub- jected to G × Y interaction. Experimental CVs for each year were greater for GY and lower for other traits. Year 2012 affected negatively yielding performance for GY and
bulk density and this may was a result of worst environmental conditions of the certain year. F3/F4 correlations for GY for the seven honeycomb lines were relative low and statistically significant only for F4 evaluation in 2012, indicating poor relation between F3 and F4 yielding performance and questionable heritability. When selection is carried out in an early generation like F2, the important consideration is the response to this se- lection in a late generation, like F4 or F5, when lines are approaching homozygosity (Whan et al. 1982).
Honeycomb methodology selects for additive gene action (Fasoulas 1988; Fasoulas 1993; Ipsilandis and Koutsika-Sotiriou 2000), the only kind of action that is heritable, rejecting in parallel recessive deleterious genes that depress the whole genome. Bulk se- lection or crossing techniques may preserve recessive alleles, by mixing the genotypes physically or by crossing. In fact, honeycomb is depended strongly on individual selec- tion and not in line selection resulting indirectly by replicated honeycomb designs. The PYI index could help, but stability is not the main goal of plant breeding. By proposing YC we focused on pure yield, leaving stability in a secondary (but important) role. Land races or local populations may preserve various genes either with additive action, or dom- inant action in some cases, but they also may incorporate recessive alleles that must be eliminated if the original population undergoes a yield-focused selection scheme. Always some variability remains in commercial inbreds, and seeking for adaptability, Fasoulas (1993) and Fasoula (2013) proposed continuous selection (non-stop selection) just to fol- low environmental differentiation.
Concluding, all genotypes selected by classical and honeycomb pedigree method out yielded the original population and hence the breeding procedure is considered success- ful. Many of them reached or out yielded the commercial cultivars used as checks (10 out of 12) and thus both classical and honeycomb pedigree methods were able to promote some homozygous genotypes in order to be used as new cultivars. Plant evaluation in the absence of competition (honeycomb methodology) in comparison to classical pedigree method did not show any superiority. In fact, yielding performance of progeny lines se- lected by classical pedigree method was better than honeycomb’s. Only when YC was used as selection criterion honeycomb pedigree lines showed high yielding performance.
Comparing PYI and YC selection criteria, it seems that the second is better for promoting high yielding and stable lines for next generations to be used as future new cultivars.
References
Agorastos, A.G., Goulas, C.K. 2005. Line selection for exploiting durum wheat (T. turgidum L. var. durum) local landraces in modern variety development program. Euphytica 146:117–124.
Allard, R.W. 1960. Principles of Plant Breeding. John Wiley & Sons, New York. pp. 1–485.
Backes, G., Orabi, J., Wolday. A., Yahyaoui, A., Jahoor, A. 2009. High genetic diversity revealed in barley (Hor- deum vulgare) collected from small-scale farmer’s fields in Eritrea. Genet. Resour. Crop Evol. 56:85–97.
Bellucci, E., Bitocchi, E., Rau, D., Nanni, L., Ferradini, N., Giardini, A., Rodriguez, M., Attene, G., Papa, R.
2013. Population structure of barley landrace populations and gene-flow with modern varieties. PloS One 8:e83891
Ceccarelli, S., Acevedo, E., Grando, S. 1991. Breeding fro yield stability in unpredictable environments: single traits, interaction between traits, and architecture of genotypes. Euphytica 56:169–185.
Fasoula, V.A. 2006. A novel equation paves the way for an everlasting revolution with cultivars characterized by high and stable crop yield and quality. Proceedings of the 11th Congress of the Hellenic Society for the Genetic Improvement of Plants. Orestiada. pp. 7–14.
Fasoula, V.A. 2013. Prognostic Breeding: A new paradigm for crop improvement. Plant Breed. Rev. 37:297–
347.
Fasoula, V.A., Fasoula, D.A. 2000. Honeycomb breeding: Principles and applications. Plant Breed. Rev.
18:177–250.
Fasoulas, A.C. 1988. The Honeycomb Methodology of Plant Breeding. A. Altidjis Publ., Thessaloniki. pp.
1–168.
Fasoulas, A.C. 1993. Principles of crop breeding. A.C. Fasoulas, P.O. Box 19555, Thessaloniki, Greece. pp.
1–128.
Greveniotis, V., Fasoula, V.A., Papadopoulos, I.I., Sinapidou, E., Tokatlidis, I.S. 2012. The development of highly-performing open-pollinated maize lines via single-plant selection in the absence of competition.
Aust. J. Crop Sci. 6(10):1448–1454.
Guillen-Portal, F.R., Russell, W.K., Eskridge, K.M., Baltensperger, D.D., Nelson, L.A., D’Croz-Mason, N.E., Johnson, B.E. 2004. Selection environments for maize in the U.S. Western High Plains. Crop Sci. 44:1519–
1526.
Hamza, S., Ben Hamida, W., Rebai, A., Harrabi, M. 2004. SSR based genetic diversity assessment among Tunisian winter barley and relationship with morphological traits. Euphytica 135:107–118.
Horsley, R.D., Franckowiak, J.D., Schwarz, P.B. 2009. Barley breeding. In: Carena, M.J. (ed.) Cereals:
Handbook of Plant Breeding, 3rd edn. Springer, Berlin. pp. 227–250.
Hou, Y.-C., Yan, Z.-H., Wei, Y.-M., Zheng, Y.-L. 2005. Genetic diversity in barley from west China based on RAPD and ISSR analysis. Barley Genet. Newsl. 35:9–22.
Iliadis, G.C., Roupakias, D.G., Goulas, C.K. 2003. Effectiveness of honeycomb selection for yield superiority at three interplant distances: a field simulation study using chickpea (Cicer arietinum L.) inbred lines.
Euphytica 133(3):299–311.
Ipsilandis, C.G., Koutsika-Sotiriou, M. 2000. The combining ability of recombinant S-lines developed from an F2 maize population. J. Agric. Sci. Cambridge. 134(2):191–198.
Johnson, H.W., Robinson, H.F., Comstock, R.I. 1955. Estimates of genetic and environmental variability in soybeans. Agron. J. 47:314–318.
Joseph, O.D., Oduwaye, O.A., Olakojo, S.A., Ojo, D.K. 2015. Genetic variability, repeatability, traits relation- ships and path coefficient analysis in low nitrogen donor white inbred lines of maize (Zea mays L). Maydica 60.3–M 25.
Kotzamanidis, S.T., Lithourgidis, A.S., Roupakias, D.G. 2009. Short communication. Plant density effect on the individual plant to plant yield variability expressed as coefficient of variation in barley. Span. J. Agric.
Res. 7(3):607–610.
Koutsika-Sotiriou, M., Tsivelikas, A.L., Gogas, Ch., Mylonas, I.G., Avdikos, I. Traka-Mavrona, E. 2013.
Breeding methodology meets sustainable agriculture. Int. J. Plant Breed. Genet. 7:1–20.
McIntosh, M.S. 1983. Analysis of combined experiments. Agron. J. 75:53–155.
Moghaddam, M., Ehdaie, B., Waines, J.G. 1997. Genetic variation and interrelationships of agronomic charac- ters in landraces of bread wheat from southeastern Iran. Euphytica 95:361–369.
Samphantharak, K., Tanapong, O. 2003. Screening methods for high yield corn inbreds in honeycomb design and performances of their hybrid combinations. Kasetsart J. Nat. Sci. 37:1–4.
Steel, R.G.D., Torrie, Η. 1980. Principles and Procedures of Statistics. Biometrical Approach, second ed.
McGraw-Hill, New York.
Stratilakis, S.N., Goulas, C.K. 2003. Yield performance at three nitrogen rates of a set of honeycomb vs. tradi- tional pedigree selected bread wheat varieties. Eur. J. Agron. 19:65–76.
Tapsell, C.R., Thomas, W.T.B. 1983. Cross predictions studies on spring barley. 2. Estimation of genetic and environmental control of yield and its component characters. Theor. Appl. Genet. 64:353–358.
Vollmann, J., Winkler, J., Fritz, C.N., Grausgruber, H., Ruckenbauer, P. 2000. Spatial field variation in soybean (Glycine max [L.] Merr.) performance trial affect agronomic characters and seed composition. Eur. J. Agron.
12:13–22.
Weltzien, E. 1988. Evaluation of barley (Hordeum vulgare L.) landrace populations originating from different growing regions in the Near East. Plant Breed. 101:95–106.
Whan, B.R., Knight, R., Rathjen, A.J. 1982. Response to selection for grain yield and harvest index in F2, F3 and F4 derived lines of two wheat crosses. Euphytica 31:139–150.
Zeven, A.C. 1998. Landraces: A review of definitions and classifications. Euphytica 104:127–139.
Electronic Supplementary Material (ESM)
Electronic Supplementary Material (ESM) associated with this article can be found at the website of CRC at https://akademiai.com/loi/0806
Electronic Supplementary Table S1. The evaluation of individual plants in NR-0 with PYI, YC and yield per plant and the selection pressure (1–6%)
Electronic Supplementary Table S2. F3 line evaluation and yield stability estimations (Stability%, CH%, s-PE%, CV) according to selected plants using PYI or high yield (per plant)
Electronic Supplementary Table S3. Total comparisons of means across the two years for each trait measure- ment: grain yield (GY in Mgha–1), 1000-kernel weight (TKW in g) and specific weight (bulk density in gL–1) of the 12 progeny lines, plus the means of all selection methods used (5 F8 progeny, 5 F4 honeycomb PYI and
2 F4 honeycomb best yielding lines-BY) with the three checks (Plaisant, Cannon, local population) Electronic Supplementary Figure S1. Comparisons among plants in the moving circle (moving ring) of a non-
replicated honeycomb design (NR-0) using PYI criterion of selection
Electronic Supplementary Figure S2. Comparisons among plants in the moving circle (moving ring) of a rep- licated honeycomb design (R-21) using Coefficient of Homeostasis
Electronic Supplementary Figure S3. Comparison of PYI selection criterion to proposed YC selection criterion for honeycomb and deviation of selecting high yielding plants