68 (2019) Supplement, 53-60 First published online: 08 Dec 2019
*Corresponding author: MÁRTON JOLÁNKAI, SZIE Növénytermesztési Intézet, 2100 Gödöllő, Páter Károly utca 1.
E-mail: jolankai.marton@mkk.szie.hu
Water footprint of yield protein content of twelve field crop species on a Hungarian crop site
AdnanESER, HajnalkaKATÓ, LauraKEMPF, *MártonJOLÁNKAI Szent István University, Crop Production Institute, Gödöllő, Hungary
Abstract
Water availability is one of the major physiological factors influencing plant growth and development. An assessment study has been done at the Szent István University, Gödöllő to evaluate and identify the water footprint of protein yield of field crop species. Twelve field crop species (Sugar beet Beta vulgaris, spring and winter barley Hordeum vulgare, winter wheat Triticum aestivum, maize Zea mays, sunflower Helianthus annuus, peas Pisum sativum, potato Solanum tuberosum, alfalfa Medicago sativa, oilseed rape Brassica napus, rye Secale cereale and oats Avena sativa) were involved in the study. Evapotranspiration patterns of the crops studied have been identified by the regular agroclimatology methodology and physiologically reliable protein ranges within crop yields were evaluated.
The results obtained suggest, that water footprint of cereals proved to be the lowest, however maize values were highly affected by the high variability of protein yield. Oilseed crops had considerably high protein yield with medium water efficiency. Alfalfa, potato and sugar beet water footprints were in accordance with their evapotranspiration patterns.
Protein based water footprint assessment seems to be more applicable in crop species evaluations than that of yield based methodologies.
Keywords: water footprint, evapotranspiration, yield protein content, field crop species
Introduction
The water footprint shows the extent of water use in relation to consumption by people (HOEKSTRA and CHAPAGAIN 2007). The water footprint of an individual, community or business is defined as the total volume of fresh water used to produce the goods and services consumed by the individual or community or produced by the business. Generally, water use is measured in water volume consumed (evaporated) per unit of time. A water footprint can be calculated for any well- defined group of consumers (e.g., an individual, family, village, city, province, state or nation) or producers (e.g., a public organization, private enterprise or economic sector), for a single process (such as growing crop plants) or for any product.
Traditionally, water use has been approached from the production side, by quantifying the following three columns of water use: water withdrawals in the
domestic and agricultural and industrial sector. While this does provide valuable data, it is a limited way of looking at water use in a globalised world, in which products are not always consumed in their country of origin. International trade of agricultural and industrial products in effect creates a global flow of virtual water, or embodied water. Recently, the water footprint concept was introduced in order to have a consumption-based indicator of water use that could provide useful information in addition to the traditional production-sector-based indicators of water use. It is analogous to the ecological footprint concept introduced in the 1990s. The water footprint is a geographically explicit indicator, showing volumes of water use (WICHELNS 2010). Thus, it gives a grasp on how economic choices and processes influence the availability of adequate water resources and other ecological realities across the globe (and vice versa).
In a UNESCO study series water footprint of various food and feed products have been evaluated (MEKONNEN and HOEKSTRA 2010a). Their research results support scientific evidence that diverse amount of water is used for production of food and feed. The differences between vegetables, cereals and meat products may have a 1:10:100 x ratio concerning water usage; e.g. 1 kg of vegetable may be produced with some 300 litres of water while bovine meet would require about 15000 litres. The specific values were much smaller if exact nutritional indicators like calories, protein or fats were evaluated. In this comparison the water footprint differences were within a five-fold range.
Global and high-resolution assessment of the green, blue and grey water footprint of wheat has been presented by the same research team. It has been stated, that plants in general and cereals, within that wheat in particular have the smallest water footprint among live structures in agricultural production (MEKONNEN and HOEKSTRA 2010b). Similar statement could be derived from a Canadian study in relation with pulses and grain crops (DING et al. 2018).
Crop site x crop plant interactions have a profound role in yield formation regarding crop yield quantity and quality (TARNAWA et al. 2008, 2009 and 2011).
Plant development depends on optimum environmental conditions from among which water availability, nutrient supply and photosynthetic processes may influence yield formation and the manifestation of quality characteristics.
Climate change research results in Hungary have highlighted the variation induced by water availability on protein formation of field crops (KASSAI et al.
2016; ESER et al. 2017; JOLÁNKAI et al 2018).
Crop water use, consumptive use and evapotranspiration are terms used interchangeably to describe the water consumed by a crop. This water is mainly used for physiological processes; a negligible amount is retained by the crop for growth. Water requirements for crops depend mainly on environmental conditions.
Plants use water for cooling purposes, and the driving force of this process is prevailing weather conditions. Different crops have different water use requirements, under the same weather conditions (MÁTÉ and KASSAI 1993, KASSAI 1994, VÁRALLYAY, 2008; PEPÓ, 2010).
The present study is dealing with the identification of water footprint of some field crops. The hypothesis of the work was not to rely on yield figures only, but
rather the nutritional value of that. In our study the protein yield of various crop species has been evaluated in the context of evapotranspiration.
Materials and methods
The materials and methods of the present study cover a rather broad field, since there are various topics of the research work done by the Szent István University, Crop Production Institute, Hungary (SIU). Most of the results are based on experimental research, however, some evaluations were implemented by using national public data, or observation results published (FM 2017, FAOSTAT 2017).
An assessment study has been done by the authors to evaluate and identify the water footprint of protein yield of field crop species. Twelve field crop species (Sugar beet Beta vulgaris, spring and winter barley Hordeum vulgare, winter wheat Triticum aestivum, maize Zea mays, sunflower Helianthus annuus, peas Pisum sativum, potato Solanum tuberosum, alfalfa Medicago sativa, oilseed rape Brassica napus, rye Secale cereale and oats Avena sativa) were involved in the study.
Evapotranspiration patterns (ET) of the crops studied have been identified by the regular agroclimatology methodology (VARGA–HASZONITS et al 2000) and physiologically reliable protein ranges within crop yields were evaluated.
Regarding water availability impacts, experimental mean values of identical treatments and homogenized bulk yield samples were used only. Precipitation records have been evaluated in relation with yield quantity and quality. Quality characteristics were determined at the Research Laboratory of the SIU Crop Production Institute, according to Hungarian standards (MSZ, 1998, GYŐRI 2006, GYŐRI 2008). Analyses were done by statistical programmes with respect to the methodology of phenotypic crop adaptation (EBERHART and RUSSELL 1966;
FINLAY and WILKINSON 1963; HOHLS, 1995). The meteorological database of the research referring to precipitation as well as temperature data was provided by the Hungarian Meteorological Service (OMSZ). Statistical evaluations, crop ecological model adaptations, and calculations were done by regular methods (SVÁB, 1981;
FINLAY and WILKINSON, 1963).
The present paper produces results of an ongoing research in relation with weather impacts on crop production (KASSAI et al. 2016, TARNAWA et al. 2015 and 2016, JOLÁNKAI et al. 2018). Such an assessment has a diverse nature. Once, it is beneficial regarding the abundance and the duration of baseline data. On the other hand, it is restricted to the available structure and moreover it is bound mainly to available figures giving less chance for deep layer evaluations. However, the study could provide some novel specific information on crop performance in relation with their water footprint.
Results and discussion
The results obtained show that the evaluated crops may have ten times differences in their amount of yield built up under almost identical field conditions
regarding precipitation, soil conditions and other meteorological factors influencing water availability.
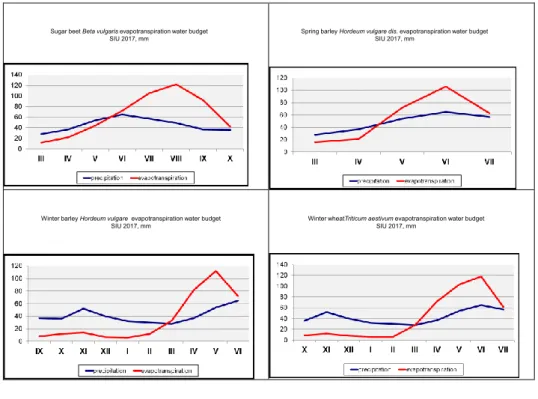
Figure 1 presents data on ET patterns in comparison with the long term precipitation means. In accordance with that it can be stated, that the twelve species studied have profoundly diverse evapotranspiration patterns concerning water demand, seasonality, and in dynamics as well.
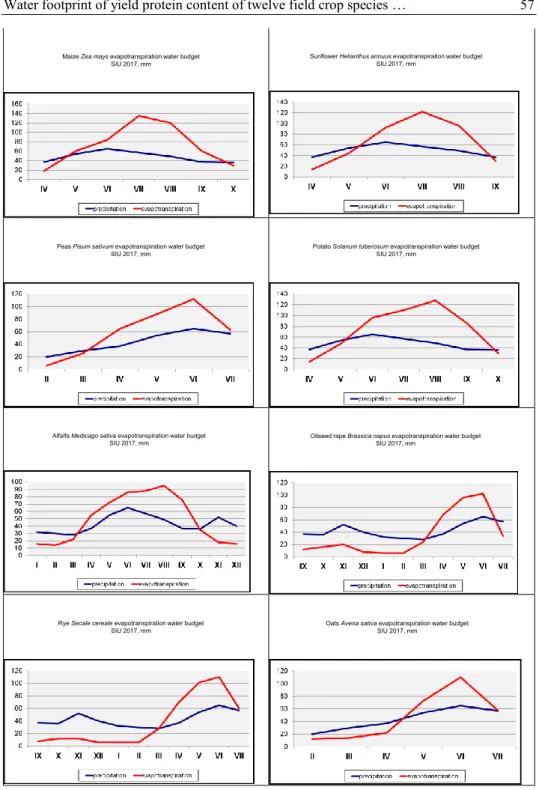
The most balanced water budget can be observed in the case of cereal crops like winter wheat and winter barley, where the early development stages are fully supplied by the precipitation and water deficiencies may be experienced mainly during the generative phases and ripening. Maize is the most deficient crop that should be supplied with water either from off season precipitation or irrigation.
Similarly to that, the two root and tuber crops are having a negative budget in most of their life cycle. Alfalfa as a perennial crop has more similarities in its ET to that of the cereal species.
Sugar beet Beta vulgarisevapotranspiration water budget
SIU 2017, mm Spring barley Hordeum vulgare dis. evapotranspiration water budget
SIU 2017, mm
Winter barley Hordeum vulgareevapotranspiration water budget SIU 2017, mm
Winter wheatTriticum aestivumevapotranspiration water budget SIU 2017, mm
Figure 1
Water budget of field crop species based on evapotranspiration. SIU, 40 years mean, 2017
Maize Zea maysevapotranspiration water budget SIU 2017, mm
Sunflower Helianthus annuusevapotranspiration water budget SIU 2017, mm
Peas Pisum sativumevapotranspiration water budget
SIU 2017, mm Potato Solanum tuberosum evapotranspiration water budget
SIU 2017, mm
Alfalfa Medicago sativaevapotranspiration water budget
SIU 2017, mm Oilseed rape Brassica napus evapotranspiration water budget
SIU 2017, mm
Rye Secale cereale evapotranspiration water budget SIU 2017, mm
Oats Avena sativaevapotranspiration water budget SIU 2017, mm
Figure 1 cont.
Water budget of field crop species based on evapotranspiration. SIU, 40 years mean, 2017
The water footprint of the examined crop species proved to be different as it is shown in Table 1. The amount of protein of the respective crops ranged from 450 kg to almost 800 kg in the yield of the evaluated species. Root and tuber crops had the lowest protein yield from among the crop species. Grain crops were in the mid- range and definitely alfalfa proved to produce the highest amount of protein.
There were considerable differences in the efficiency of water consumption regarding protein yields. Winter barley proved to be the most efficient protein producing crop regarding both evapotranspiration and direct water consumption of the crop. Wheat was the next water saving crop concerning protein production.
Spring cereals had small water footprint as well. Maize as a C4 type non cereal grain crop had almost double specific water consumption in comparison with cereals. Alfalfa had the highest protein yield from among the species examined, however its water efficiency was about half of that of the cereal species.
Oil seed crops like sunflower and canola have shown rather diverse water consumption patterns.
Potato and sugar beet produced the least protein yield within the evaluated crop species. It is quite acceptable since both of them are initiated for the production of carbohydrous substances like starch and sugar rather than proteinous ones. Consequently the water efficiency of these crops proved to be the worst as well.
Table 1
Water footprint of twelve crop plant species, SIU, 2017 Crop protein % crop yield
t ha-1 protein yield
kg ha-1 protein kg /
ET mm water
footprint l
Medicago sativa 18.0 4.35* 783 1.32 44.9
Solanum tuberosum
2.0 24.9 498 0.97 52.7
Beta vulgaris 1.1 41.2 453 0.89 57.4
Triticum
aestivum 13.0 4.8 624 1.47 28.8
Hordeum vulgare
16.5 4.1 676.5 1.88 18.9
Hordeum vulgare distichon
11.2 3.7 414.4 1.49 18.6
Secale cereale 12.8 4.2 537.6 1.28 32.7
Avena sativa 13.6 4.4 598.4 2.07 37.3
Zea mays 9.5 5.8 551 1.09 46.5
Helianthus annuus
18.5 3.3 610.5 1.54 25.8
Brassica napus 22.6 3.2 723.2 1.84 21.3
Pisum sativum 24.0 2.8 672.0 1.87 19.2
*hay
Finally, protein based water footprint assessment seem to be more applicable in crop species evaluations than that of yield based methodologies. Since protein formation in all live systems represent a more advanced level in physiological processes, various field crop species that belong to taxonomically diverse metabolic pathways and are driven by different evapotranspiration patterns may have a more plausible indicator in comparison of their water budget characteristcs.
Acknowledgement
This paper presents research results gained from a long term trial supported by TÁMOP, NVKP and VKSZ funds of the Government of Hungary.
References
DING, D.,ZHAO,Y.,GUO,H.,LI,X.,SCHOENAU,J.,SI, B., (2018). Water Footprint for Pulse, Cereal, and Oilseed Crops in Saskatchewan, Canada. Water. 10. 1609;
doi:10.3390/w10111609
EBERHART, S.A., RUSSELL, W.A., (1966). Stability parameters for comparing varieties.
Crop Science. 6. 36-40.
ESER A., KASSAI M.K., TARNAWA Á., NYÁRAI H.F., JOLÁNKAI M., (2017). Impact of crop year and nitrogen topdressing on the quantity and quality of wheat yield.
Columella 4. (1. Suppl.) 157-162.
FAOSTAT (2017): www.fao.org/faostat/
FINLAY, K.W. AND WILKINSON, G.N., (1963). The analysis of adaptation in a plant breeding program. Australian Journal for Agricultural Resesearch. 14. 742-754.
FM, (2017). Statistical data on agriculture. https://www.ksh.hu/hssz_tagok_fm
GYŐRI Z. (2006). A trágyázás hatása az őszi búza minőségére (Impacts of fertiliser application on winter wheat quality). Agrofórum. 17. (9) 14-16.
GYŐRI Z., (2008). Complex evaluation of the quality of winter wheat varieties. Cereal Research Communications. 36. 2. 1907-1910 pp
HOEKSTRA A.Y., CHAPAGAIN A.K., (2007). Water footprints of nations: Water use by people as a function of their consumption pattern. Water Resource Management.
21. 35-48.
HOHLS, T., (1995). Analysis of genotype environment interactions. South African J. Sci.
91. 121-124.
JOLÁNKAI M., KASSAI M.K., TARNAWA Á.,PÓSA B.,BIRKÁS M., (2018). Impact of precipitation and temperature on the grain and protein yield of wheat (Triticum aestivum L) varieties. Időjárás. 122. (1) 31-40.
KASSAI M.K., TARNAWA Á.,NYÁRAI H.F.,HORVÁTH CS., JOLÁNKAI M., (2016). Water availability and protein formations interrelations. Acta Hydrologica Slovaca. 17.
(2) 260-264.
KASSAI M.K., (1994). Production of leguminous crops in Hungary. Grain Legumes Paris. 5. 24-25.
MÁTÉ A., KASSAI M.K., (1993). Növekedésszabályozó anyagok alkalmazása az őszi búza vetőmagtermesztésében. Növénytermelés. 42. (5) 431-437.
MEKONNEN, M.M. and HOEKSTRA, A.Y., (2010a). The green, blue and grey water footprint of farm animals and animal products, Value of Water Research Report Series No. 48. UNESCO-IHE.
MEKONNEN, M.M., HOEKSTRA, A.Y., (2010b). A global and high-resolution assessment of the green, blue and grey water footprint of wheat. Hydrol. Earth Syst. Sci. 14.
1259-1276.
MSZ 6383, (1998). 824/2000/EK Crop quality standards, Hungary.
PEPÓ P., (2010). Adaptive capacity of wheat (Triticum aestivum L.) and maize (Zea mays L.) crop models to ecological conditions. Növénytermelés. 59. (Suppl.) 325- 328.
SVÁB J., (1981). Biometriai módszerek a kutatásban. Mezőgazdasági Könyvkiadó, Budapest.
TARNAWA Á., KASSAI M.K., MÁTÉ A., SZENTPÉTERY ZS., (2009). Precipitation and temperature stress impacting weed-crop coenology performance. Cereal Research Communications. 37. (Suppl.) 149-152.
TARNAWA Á., KLUPÁCS H., KASSAI K., SALLAI A., (2011). Crop year x crop site interaction for weediness in winter wheat. In: 19th International Poster Day.
Transport of water, chemicals and energy in the soil-plant-atmosphere system. Ed.:
A.CELKOVÁ. Slovak Academy of Sciences Institute of Hydrology. Bratislava. pp.
755-758.
TARNAWA Á., KLUPÁCS H.,KASSAI K.,SZENTPÉTERY ZS., (2008). Crop year x crop site interaction for weediness of winter wheat. Cereal Research Communications. 36.
(Suppl.) 875-878.
TARNAWA Á.,SOÓS R.,NYÁRAI H.F.,MÁTÉ A.,SZENTPÉTERY ZS., (2016). Comparison of SPAD values of various winter cereals from the spring to early summer period.
Növénytermelés. 65. (Suppl.) 223-226.
TARNAWA Á. –SZENTPÉTERY ZS.,MÁTÉ A.,CSÚRNÉ VARGA A.,NYÁRAI H.F.,(2015).
The effect of fertilization on the quality and quantity of winter wheat in small plot experiments. Növénytermelés. 64. (Suppl.) 245-248.
VÁRALLYAY, G., (2008). Extreme soil moisture regime as limiting factor of the plants’
water uptake. Cereal Research Communications. 36. (Suppl.) 3-6.
VARGA-HASZONITS Z., VARGA Z., LANTOS ZS., VÁMOS O., SCHMIDT R., (2000).
Magyarország éghajlati erőforrásainak agroklimatológiai elemzése. Lóriprint.
Mosonmagyaróvár. pp. 94-118.
WICHELNS D. (2010), Virtual water and water footprints offer limited insight regarding important policy questions. International Journal of Water Resources Development. 26. (4) 639-651.
Received: 14 May 2019 Accepted: 05 Dec 2019 Open Access statement. This is an open-access article distributed under the terms of the Creative Commons Attribution 4.0 International License (https://creativecommons.org/licenses/by/4.0/), which permits unrestricted use, distribution, and reproduction in any medium, provided the original author and source are credited, a link to the CC License is provided, and changes - if any - are indicated. (SID_1)