Extended tumor growth model for combined therapy
D´aniel Andr´as Drexler, Tam´as Ferenci and Levente Kov´acs
Abstract— Mathematical modeling of tumor growth dynam- ics may have great impact on modern medicine. The dynamical model of tumor growth which describes the effect of drugs can be used e.g., for therapy optimization, therapy supervision, drug development. Based on a single drug tumor growth model, we create a model that can be used to describe the effect of two drugs. The extended model is created using formal reaction kinetics analogy, thus the meaning of the equations is interpretable for experts not familiar with differential equa- tions. We carry out parametric identification using nonlinear mixed-effect model, for the identification we use measurements from mice experiments carried out using bevacizumab and fluorouracil treatment. The results of the identification show that the measurements can be reproduced using the model with small error, and the interpatient variability for most of the parameters is relatively low.
I. INTRODUCTION
Application of system and control theory in physiologi- cal problems opens new perspectives in modern medicine.
Modeling and control of BIS (bispectral index) in anesthesia [1]–[3], or modeling and control of blood glucose level in artificial pancreas applications [4]–[7] are well representative results of this interdisciplinary field. Modeling and control of tumor growth is an intensively researched area of physi- ological control as well aiming to automatize therapies and optimize treatment protocols [8]–[10].
A system theoretic model of tumor growth, which can describe the effect of the drug on tumor evolution, is a fundamental element of tumor control. Besides the control application, reliable tumor growth models can be used in drug research, patient monitoring and prognosis as well.
There are various tumor models in the literature. The Hahn- feldt model describes tumor volume and endothelial volume dynamics under the effect of angiogenic inhibition, describ- ing Gompertzian tumor growth, i.e., the tumor volume has an upper plateau [11]. A mechanistic model of tumor growth using partial differential equations describing the effect of chemotherapy is given in [12]. A compartmental model for the treatment of low-grade glioma with chemotherapy or ra- diotherapy is given in [13]. A cellular automation model was developed in [14]. A tumor model describing tumor volume dynamics, vessel support dynamics and pharmacodynamics of the drug was published in [15].
This project has received funding from the European Research Council (ERC) under the European Union’s Horizon 2020 research and innovation programme (grant agreement No 679681).
The Authors are with the Physiological Controls Research Center within the Research, Innovation and Service Center of ´Obuda University, Budapest, Hungary drexler.daniel@nik.uni-obuda.hu, ferenci.tamas@nik.uni-obuda.hu,
kovacs@uni-obuda.hu
A third-order tumor growth model with proliferating tumor volume, dead tumor volume and drug level dynamics was proposed in [16]. The model uses linear tumor growth, linear necrosis, and a Hill function to define the effect of drug (pharmacodynamics) and the drug depletion (mixed- order pharmacokinetics). The Hill function is an essential component of the model since it describes that the effect of the drug does not increase linearly as the drug level increases. Hill functions were used to describe continuous saturation on the drug effect in a model used for control of anesthesia in [3]. We use the model with Hill function drug effect given in [16] and modify it to describe the effect and pharmacokinetics of two drugs. The original model is described in Section II, while the modified model with multiple inputs is defined in Section III.
We use results from an experiment carried out on 10 immunosupressed mice implanted with human xenograft (HT-29 colorectal adenocarcinoma) with a combined ther- apy of bevacizumab and fluorouracil to validate the model structure and carry out parametric identification in Section IV. In the experiments, the mice got 7.09·10−4 mg/ml bevacizumab and0.1424 mg/kg fluorouracil in the form of injection each day after the 8th day of tumor implantation.
The parametric identification shows that the extended model can efficiently describe the measurements. The paper ends with the conclusions in Section V.
II. THE ORIGINAL TUMOR GROWTH MODEL The tumor growth model proposed in [16] is described with the analogy of formal reaction kinetics. This analogy has several benefits: the differential equations can be auto- matically generated from the stoichiometric equations using the techniques from [17] once the kinetics is described (e.g., mass-action of Michaelis-Menten kinetics), the stoichiomet- ric equations reveal the meaning of the differential equations in a form that is interpreted for expert not familiar with differential equations, e.g., medical experts, biologists, and the transition from stoichiometric equations to differential equations automatically guarantees the positivity of the re- sulting system.
In the third-order model, we use three fictive speciesX1, X2andX3that are the species representing the proliferating tumor volume, the dead tumor volume, and the drug level, respectively. The corresponding state variables x1, x2 and x3 are the time functions of the proliferating tumor volume, dead tumor volume and drug level, respectively. The sto- ichiometric equations defining the fictive reactions, which correspond to the physiological phenomena governing tumor growth are
• X1
−−→a 2 X1 that describes tumor proliferation with tumor growth ratea. We consider this effect with mass- action kinetics, which results in the linear differential equation x˙1=ax1;
• X1
−−→n X2 that describes tumor cell necrosis (death) with necrosis raten. We consider this effect with mass- action kinetics, the corresponding differential equations are x˙1=−nx1,x˙2=nx1;
• X3 −−→c O that describes depletion of the drug with reaction rate coefficientc, i.e. the clearance of the drug.
We use consider Michaelis-Menten kinetics with quasi steady-stace approximation, which results in mixed- order model for the pharmacokinetics, and the corre- sponding differential equation is x˙3 = −cx3/(KB + x3), where the parameter KB is the Michaelis-Menten constant of the drug;
• X1 + X3 −−→b X2 that describes the effect of the drug in a general way, i.e., if living tumor and drug meets, they turn into dead tumor. We consider this reac- tion with Michaelis-Menten kinetics with quasi steady- state approximation, Michaelis-Menten constantED50
(the effective median dose) resulting in the velocity term x1x3/(ED50+x3). The effective median dose defines the dose of the drug that exerts 50% of the maximal effect, thus if x3 = ED50, the component x3/(ED50+x3)has the value of 1/2. The effect of the proliferating and dead tumor volumes is considered with reaction rate coefficient b, resulting in the differential equations x˙1 = −bx1x3/(ED50 +x3) and x˙2 = bx1x3/(ED50+x3). We use the differential equation
˙
x3 = −bkx1x3/(ED50+x3) to describe the effect of the drug on drug level dynamics, where the rate coefficientbk has different dimension thanb.
The sum of these effect yields the differential equations of the system:
˙
x1 = (a−n)x1−b x1x3 ED50+x3
(1)
˙
x2 = nx1+b x1x3
ED50+x3 (2)
˙
x3 = −c x3
KB+x3
−bk
x1x3
ED50+x3
+u, (3) where x1 is the time function of the proliferating tumor volume in mm3,x2 is the time function of the dead tumor volume in mm3,x3 is the time function of the drug level in mg/kg and uis the input that is the time function of drug injection rate in mg/(kg·day).
The outputy of the system is the measured tumor volume in mm3 that is the sum of the proliferating (x1) and dead (x2) tumor volumes, i.e.
y=x1+x2. (4) The dynamics of the output is described by the differential equation
˙
y=ax1 (5)
that is the sum of (1) and (2), thus the change of the measured tumor volume depends directly only on the tumor growth rate
constantaand the actual volume of the proliferating tumor volume.
The qualitative analysis of the model with the application of state-feedback and neglicted dead volume dynamics is carried out in [18]. The system has a trivial equilibrium x1 = 0 mm 3, x3 = 0 mg/kg, which is a stable node if a−n < 0, i.e., tumor necrosis is faster than proliferation, and a saddle point ifa−n >0, i.e., tumor proliferation is faster than necrosis. The system is controllable, i.e., the drug can decrease tumor volume if and only ifa−n−b <0, which is the criterion for the existence of a nontrivial equilibrium for the pathological casea−n >0.
III. MODIFICATION OF THE TUMOR GROWTH MODEL
The model discussed in Section II has only one input, but this input can be any drug which have effect on tumor growth due to the general formalism of the drug effect mechanism. We modify this model to describe two inputs by duplicating the stoichiometric equation defining the drug effect mechanism, and the stoichiometric equation defining the drug depletion. Let X3 be the species corresponding to drug 1, while X4 be the species corresponding to drug 2.
The stoichiometric equations defining the effect of drugs are X1+ X3
b1
−−→ X2 (6) X1+ X4
b2
−−→ X2. (7) The inhibition rate of drug 1 isb1, while the inhibition rate of drug 2 isb2. We suppose that the drugs act independently, and there are no cross interactions, they have no effect on the other drugs effectiveness. Let the effective median dose parameter of drug 1 be ED50,1, and the effective median dose parameter of drug 2 beED50,2. Letx3, x4 denote the time functions of the drug level of drug 1 and 2, respectively.
The velocities caused by the stoichiometric equations are
˙
x1 = −b1
x1x3
ED50,1+x3
−b2
x1x4
ED50,2+x4
(8)
˙
x2 = b1 x1x3 ED50,1+x3
+b2 x1x4 ED50,2+x4
(9)
˙
x3 = −bk1
x1x3
ED50,1+x3 (10)
˙
x4 = −bk2
x1x4 ED50,2+x4
, (11)
withbk1 andbk2 being the rate coefficients that specify the velocity of drug depletion caused by the effect of drug 1 and 2, respectively.
The stoichiometric equations defining the depletion of the drug are
X3 −−→c1 O (12) X4
c2
−−→ O. (13)
The clearance rates of drugs 1 and 2 are c1 and c2, re- spectively. Let the Michaelis-Menten constants of the drugs be KB,1 and KB,2. The velocity terms defined by the
stoichiometrix equations considered with Michaelis-Menten kinetics are
˙
x3 = −c1
x1x3
KB,1+x3
(14)
˙
x4 = −c2 x1x4
KB,2+x4. (15) Both the drug effect mechanism and drug depletion are considered with Michaelis-Menten kinetics resulting in a Hill function in the corresponding differential equations.
Combining (8)-(15) with tumor proliferation and necrosis considered with mass-action kinetics (i.e., linear differential equation), we get the differential equations of the extended model:
˙
x1 = (a−n)x1
−b1
x1x3
ED50,1+x3
−b2
x1x4
ED50,2+x4
(16)
˙
x2 = nx1+b1 x1x3 ED50,1+x3
+b2 x1x4 ED50,2+x4
(17)
˙
x3 = −c1
x1x3
KB,1+x3
−bk1
x1x3
ED50,1+x3
+u1 (18)
˙
x4 = −c2
x1x4 KB,2+x4
−bk2 x1x4 ED50,2+x4
+u2.(19) The inputs of the extended model are the time function u1 of the injection rate of drug 1 and the time function u2 of the injection rate of drug 2. The dimension ofx3andx4can be mg/kg or mg/ml. In general, the dimensions of the inputs can be mg/kg/day or mg/ml/day. Since in our experiments the dose of bevacizumab is given in serum level (mg/ml), while the dose of fluorouracil is given inmgper body weight kilogram (mg/kg), the dimension ofx3will bemg/mland the dimension of x4 will bemg/kgin the next section.
This system is positive (nonnegative), since it is kinetic [17], thus for all positive initial conditions and for positive inputs the trajectories are positive. Note that all the param- eters of the model are supposed to be positive as well.
Theorem 1: Consider the extended system without dead tumor volume dynamics, i.e., the dynamic system described by (16),(18) and (19). The trivial equilibrium pointx∗1= 0, x∗3 = 0, x∗4 = 0 with constant input u∗1 = 0, u∗2 = 0 is stable in the sense of Lyapunov, ifa−n≤0, and unstable, ifa−n >0.
Proof: Letf denote the right-hand side of the differ- ential equation of the system without dead tumor volume dynamics, with zero input functions:
f =
(a−n)x1−b1
x1x3
ED50,1+x3 −b2
x1x4
ED50,2+x4
−c1
x1x3
KB,1+x3 −bk1
x1x3
ED50,1+x3
−c2
x1x4
KB,2+x4 −bk2
x1x4
ED50,2+x4
.
(20) The Jacobian of f evaluated at the equilibrium point is
f0(0,0,0) =
a−n 0 0 0 0 0 0 0 0
(21)
which has eigenvalues{a−n,0,0}. Ifa−n >0, then the Jacobian has a positive eigenvalue, thus the equilibrium point is unstable.
In order to analyze the case a−n ≤ 0, consider the Lyapunov function
V =1
2 x21+x23+x24
(22) and its derivative
V˙ = x1x˙1+x3x˙3+x4x˙4 (23)
= x1
(a−n)x1−b1 x1x3
ED50,1+x3 −b2 x1x4
ED50,2+x4
−c1
x23 ED50,1+x3
−c2
x24 ED50,2+x4
−bk1
x23 KB,1+x3
−bk2
x24 KB,2+x4
, (24)
which is negative semidefinite if a−n ≤ 0, since the system is positive (nonnegative), i.e., x1, x3, x4 ≥ 0 and the parameters are all positive. Since the derivative of the Lyapunov function is negative semidefinite, this implies that the zero equilibrium is stable in the Lyapunov sense if a−n≤0.
Theorem 2: Consider the pathological case a−n > 0, i.e., the tumor dynamics is unstable without drug. Then the tumor volume can be decreased with the appropriate control if and only ifa−n−b1−b2<0.
Proof: Ifa−n >0, the tumor volume can be decreased if and only if there exists positive drug levelsx3andx4such that the right-hand side of (16) is negative, i.e.,
(a−n)x1−b1 x1x3
ED50,1+x3 −b2 x1x4
ED50,2+x4 <0. (25) Suppose, that the drug levels are high, i.e., take the limits x3 → ∞, x4 → ∞. The limits of the Hill functions are 1, i.e.,
x3lim→∞
x3
ED50,1+x3
= 1 (26)
x4lim→∞
x4 ED50,2+x4
= 1, (27)
thus the tumor volume dynamics is described by
˙
x1= (a−n−b1−b2)x1 (28) which is negative if and only ifa−n−b1−b2<0. Since the value of Hill functions is between 0 and 1 for finite drug levels, we have that
−b1−b2<−b1
x3
ED50,1+x3 −b2
x4
ED50,2+x4, (29) which yields that
a−n−b1−b2< a−n−b1
x3
ED50,1+x3
−b2
x4
ED50,2+x4
, (30) thusx˙1<0 implies thata−n−b1−b2<0.
It is possible that for some positiveb1andb2, the inequalities a−n−b1>0anda−n−b2>0hold, thus the single therapy is not effective against the tumor, buta−n−b1−b2 <0, thus combination of the drugs can decrease tumor volume.
IV. RESULTS OF PARAMETRIC IDENTIFICATION For the purpose of parametric identification, we used mea- surements from experiments carried out on 10 immunosup- pressed SCID (Severe Combined ImmunoDeficiency) male mice. A human tumor, HT-29 colorectal adenocarcinoma was injected subcutaneously into the mice, and the treat- ment started eight days after tumor implantation. The mice received 7.09·10−4 mg/ml bevacizumab (which is an an- giogenic inhibitor) and 0.1424 mg/kg fluorouracil (which is a cytotoxic agent) in the form of injections each day.
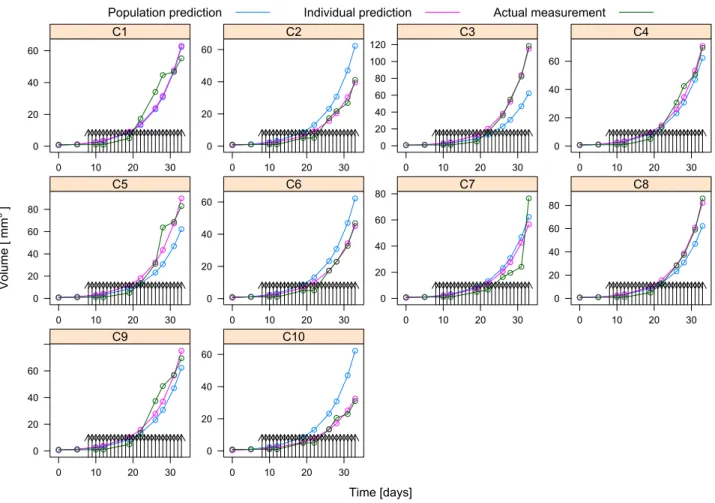
The experiments were carried out at the 1st Department of Pathology and Experimental Cancer Research, Semmelweis University in 2018 between 24th of October and 26th of November. The measurements for the 10 mice numbered fromC1-C10are shown by the green circles in Fig. 1, and are interpolated linearly with the green curves. The black arrows in Fig. 1 show the time of injections.
In the multidrug model discussed in Section III, the first inputu1is bevacizumab (which was 7.09·10−4 mg/ml per day), thus x3 is a serum level with dimension mg/ml, and u1 has the dimension mg/ml/day, while the second input u2 is fluorouracil (which was 0.1424 mg/kg per day), thus x4 is the drug level in mg/kg, and u2 has the dimension mg/kg/day. Parameter fitting was carried out using a mixed- effect model. First, the differential equation systems were converted to a nonlinear model in which the parameters were assumed to be random effects. As a result, every subject has an own realization for each parameter which is assumed to be a random draw from a given distribution (usually assumed to be normal), so that the number of estimated parameters is always fixed – for normal distribution these parameters are the mean and standard deviation – irrespectively of the number of subjects [19]. The mean measures the overall – population – value, while standard deviation characterizes the between-subject variability. This model can handle the within-subject correlations, therefore these models are widely used to describe repeated-measures data and are also univer- sally applied in population pharmacokinetics [20], [21].
Estimation was performed with Stochastic Approximation Expectation-Maximization (SAEM) method which is one of the modern methods to solve the likelihood equations arising from the above-described nonlinear mixed effects models [22], [23]. Calculations were carried out under R statistical program package version 3.5.2 [24] using the librarynlmixrversion 1.0.0-7 [25].
The initial values of the states were x2(0) = 0 mm3, x3(0) = 0 mg/ml, x4(0) = 0 mg/kg, while x1(0) was estimated as a parameter (called x10 in Fig. 2 and Table I).
Parameter estimation results showed that the values of kb1 are kb2 are small compared to the values of c1 and c2 (smaller by six order of magnitude), thus we have fixed kb1=kb2= 0, and rerun the parametric identification. The results of the parametric identification and the measurements for the 10 mice are shown in Fig. 1. The magenta curves show the result of the simulation based on the model with parameters identified for the individual mice. The magenta
dots show the values of the simulation in the time instants where measurements were carried out. The blue curves show the result of the simulation with parameters created for the population mean, whose values are listed in Table I. The parameters for the individual fits are shown in Fig. 2. The dots represent parameter values corresponding to individual fits, the particular individual (mouse) is identified by the number above or below the dot.
Table I shows that the parameters specific to the tumor (tumor growth rateaand necrosis raten) has small between subject variability. The coefficients c1 and c2 describing drug depletion shows large between subject variability, while the Michaelis-Menten constantsKB,1,KB,2 related to drug depletion have small between subject variability. The coeffi- cientsb1andb2characterizing the effect of the drug on tumor dynamics have relatively small between subject variability, however, the effective median dose parameters ED50,1, ED50,2 shows larger variability between the individuals.
This latter observation is critical in therapy design, since the effective median dose parameters fundamentally characterize the dosage required to treat the patient.
V. CONCLUSION
The parametric identification carried out on measurements from mice experiments where multiple drugs were applied showed that the extended multidrug model is able to describe the measurements with more drugs as inputs. The paramet- ric identification showed that drug depletion is negligibly affected by the drug effect mechanism, thus we can use the approximation bk1 = 0, bk2 = 0. The mixed-effect model showed the intersubject variability of the parameters. The tumor specific parameters show small variability, while the effective median dose and clearance parameters of the drugs show large intersubject variability. The large variability of the pharmacokinetic and pharmacodynamic parameters of the drugs has significant effect on the therapy, which should be taken into consideration during design of therapies.
ACKNOWLEDGMENT
The present work has also been supported by the Hungar- ian National Research, Development and Innovation Office (2018-2.1.11-T ´ET-SI-2018-00007 and SNN 125739).
REFERENCES
[1] M. Alamir, M. Fiacchini, I. Queinnec, S. Tarbouriech, and M. Maze- rolles, “Feedback law with probabilistic certification for propofol- based control of bis during anesthesia,” International Journal of Robust and Nonlinear Control, vol. 28, no. 18, pp. 6254–6266, 2018.
[2] I. Queinnec, S. Tarbouriech, and M. Mazerolles, “Reference tracking controller design for anesthesia,” in Proceedings of the 9th IFAC Symposium on Robust Control Design ROCOND 2018, vol. 51, no. 25, 2018, pp. 158 – 163.
[3] C.-M. Ionescu, “A computationally efficient hill curve adaptation strategy during continuous monitoring of dose-effect relation in anaes- thesia,”Nonlinear Dynamics, vol. 92, no. 3, pp. 843–852, 2018.
[4] R. Gondhalekar, E. Dassau, and F. J. Doyle, “Velocity-weighting &
velocity-penalty mpc of an artificial pancreas: Improved safety &
performance,”Automatica, vol. 91, pp. 105 – 117, 2018.
[5] D. Shi, E. Dassau, and F. J. Doyle III, “Multivariate learning frame- work for long-term adaptation in the artificial pancreas,”Bioengineer- ing & Translational Medicine, vol. 0, no. 0, 2018.
Time [days]
Volume [mm3 ]
0 20 40 60
0 10 20 30
C1
0 20 40 60
0 10 20 30
C2
0 20 40 60 80 100 120
0 10 20 30
C3
0 20 40 60
0 10 20 30
C4
0 20 40 60 80
0 10 20 30
C5
0 20 40 60
0 10 20 30
C6
0 20 40 60 80
0 10 20 30
C7
0 20 40 60 80
0 10 20 30
C8
0 20 40 60
0 10 20 30
C9
0 20 40 60
0 10 20 30
C10
Population prediction Individual prediction Actual measurement
Fig. 1. The tumor volume measurements (green), individual fits (magenta) and population fits (blue) for the 10 mice
Parameter Est. SE %RSE Back-transformed(95%CI) BSV(CV%) Shrink(SD)%
Log a -1.91 0.0317 1.66 0.147 (0.139, 0.157) 6.82% 14.3%<
Log b1 -6.17 0.179 2.9 0.0021 (0.00148, 0.00298) 17.1% 90.5%>
Log b2 -7.2 0.264 3.66 0.000746 (0.000445, 0.00125) 40.1% 92.3%>
Log c1 -1.32 0.546 41.3 0.267 (0.0914, 0.778) 121.% 88.0%>
Log c2 -1.21 0.669 55.1 0.297 (0.08, 1.1) 151.% 93.6%>
Log n -5.18 0.173 3.34 0.00566 (0.00403, 0.00793) 18.6% 87.6%>
Log x10 -0.574 0.121 21.1 0.563 (0.444, 0.714) 24.1% 31.4%>
Log KB1 -0.576 0.0149 2.58 0.562 (0.546, 0.579) 1.61% 92.6%>
Log KB2 3.8 0.293 7.7 44.8 (25.2, 79.5) 29.2% 88.7%>
Log ED501 -2.8 1.18 42 0.0607 (0.00604, 0.61) 249.% 93.7%>
Log ED502 -8.63 0.665 7.7 0.000178 (4.84·10−5, 0.000655) 48.4% 93.2%>
Additive error 5.28 5.28
TABLE I
ESTIMATED PARAMETERS OF THE NON-LINEAR MIXED EFFECTS MODEL(EST.), SE:STANDARD ERROR, RSE:RELATIVE STANDARD ERROR, CI:
CONFIDENCE INTERVAL, BSV:BETWEEN-SUBJECT VARIABILITY, CV:COEFFICIENT OF VARIATION, SD:STANDARD DEVIATION. LOG STANDS FOR NATURAL LOGARITHM.
[6] P. Colmegna, F. Garelli, H. D. Battista, and R. S´anchez-Pe˜na, “Au- tomatic regulatory control in type 1 diabetes without carbohydrate counting,”Control Engineering Practice, vol. 74, pp. 22 – 32, 2018.
[7] H. Khan, J. K. Tar, I. Rudas, L. Kov´acs, and G. Eigner,
“Receding horizon control of type 1 diabetes mellitus by using nonlinear programming,”Complexity, p. 11, 2018. [Online]. Available:
https://doi.org/10.1155/2018/4670159
[8] H.-P. Ren, Y. Yang, M. S. Baptista, and C. Grebogi, “Tumour chemotherapy strategy based on impulse control theory,”Philosophical Transactions Mathematical Physical & Engineering Sciences, vol.
375, no. 2088, 2017.
[9] F. Cacace, V. Cusimano, A. Germani, P. Palumbo, and F. Papa,
“Closed-loop control of tumor growth by means of anti-angiogenic administration,” Mathematical Biosciences & Engineering, vol. 15, no. 4, pp. 827–839, 2018. [Online]. Available: https://doi.org/10.
3934/mbe.2018037
[10] J. Klamka, H. Maurer, and A. Swierniak, “Local controllability and optimal control for a model of combined anticancer therapy with control delays,”Mathematical Biosciences and Engineering, vol. 14, no. 1, pp. 195–216, 2017.
[11] P. Hahnfeldt, D. Panigrahy, J. Folkman, and L. Hlatky, “Tumor development under angiogenic signaling: A dynamical theory of tu-
value
0.1350.1400.1450.1500.1550.1600.165 1
10
2 4 5 3
6 9 7 8
a
0.00206 0.00210 0.00214 1
10 2
3 4
5
6 7 8
9
b1
0.00072 0.00074 0.00076 0.00078
1 10
2 3
4 5 6
7
8 9
b2
0.24 0.26 0.28 0.30 0.32 0.34 1
10 2
3
4 5
6 7
8 9
c1
0.26 0.28 0.30 0.32 1 10 2
3 5 4
6 7
8 9
c2
0.00540.00550.00560.00570.0058 1
10 2
3
4 5 6
7 8 9
n
0.45 0.50 0.55 0.60 0.65 0.70 1 10 2
3 4
5 6
7
8 9
x10
0.5610 0.5615 0.5620 0.5625 1
10
2 3
4 5
6 7 8
9
KB1
42 43 44 45 46
1
10 3 4 2
5
6 7
8 9
KB2
0.050 0.055 0.060 0.065 0.070 1
10 2
3 6 4 5
7 9 8
ED501
0.000175 0.000180 0.000185
1 10
2
3 4
5 6 7
8 9
ED502
Fig. 2. Parameters resulting from the individual fits
mor growth, treatment response, and postvascular dormancy,”Cancer Research, vol. 59, pp. 4770–4775, 1999.
[12] E. Simbawa, “Mechanistic model for cancer growth and response to chemotherapy,” Computational and Mathematical Methods in Medicine, vol. 2017, pp. 1–7, 2017. [Online]. Available: https:
//doi.org/10.1155/2017/3676295
[13] B. Ribba, G. Kaloshi, M. Peyre, D. Ricard, V. Calvez, M. Tod, B. Cajavec-Bernard, A. Idbaih, D. Psimaras, L. Dainese, J. Pallud, S. Cartalat-Carel, J.-Y. Delattre, J. Honnorat, E. Grenier, and F. Ducray, “A tumor growth inhibition model for low-grade glioma treated with chemotherapy or radiotherapy,” Clinical Cancer Research, vol. 18, no. 18, pp. 5071–5080, jul 2012. [Online].
Available: https://doi.org/10.1158/1078-0432.ccr-12-0084
[14] T. Gonczy, D. Csercsik, and L. Kovacs, “A hybrid cellular automaton model of tumor-induced angiogenesis,” in 2018 IEEE International Conference on Automation, Quality and Testing, Robotics (AQTR). IEEE, may 2018. [Online]. Available: https:
//doi.org/10.1109/aqtr.2018.8402781
[15] D. Csercsik and L. Kov´acs, “Dynamic modeling of the angiogenic switch and its inhibition by bevacizumab,”Complexity, pp. 1–18, 2019.
[16] D. A. Drexler, J. S´api, and L. Kov´acs, “Modeling of tumor growth incorporating the effects of necrosis and the effect of bevacizumab,”
Complexity, pp. 1–11, 2017.
[17] P. ´Erdi and J. T´oth, Mathematical Models of Chemical Reactions.
Theory and Applications of Deterministic and Stochastic Models.
Princeton, New Jersey: Princeton University Press, 1989.
[18] D. A. Drexler, I. Nagy, V. Romanovski, J. T´oth, and L. Kov´acs,
“Qualitative analysis of a closed-loop model of tumor growth con- trol,” inProceedings of the 18th IEEE International Symposium on Computational Intelligence and Informatics, 2018, pp. 329–334.
[19] J. Pinheiro and D. Bates, Mixed-effects models in S and S-PLUS.
Springer Science & Business Media, 2006.
[20] J. Owen and J. Fiedler-Kelly, Introduction to Population Pharma- cokinetic / Pharmacodynamic Analysis with Nonlinear Mixed Effects Models. Wiley, 2014.
[21] T. K. Kiang, C. M. Sherwin, M. G. Spigarelli, and M. H. Ensom,
“Fundamentals of population pharmacokinetic modelling,” Clinical pharmacokinetics, vol. 51, no. 8, pp. 515–525, 2012.
[22] B. Delyon, M. Lavielle, E. Moulines et al., “Convergence of a stochastic approximation version of the EM algorithm,”The Annals of Statistics, vol. 27, no. 1, pp. 94–128, 1999.
[23] W. Sukarnjanaset, T. Wattanavijitkul, and S. Jarurattanasirikul, “Eval- uation of FOCEI and SAEM estimation methods in population phar- macokinetic analysis using NONMEMR across rich, medium, and sparse sampling data,” European journal of drug metabolism and pharmacokinetics, vol. 43, no. 6, pp. 729–736, 2018.
[24] R Core Team, R: A Language and Environment for Statistical Computing, R Foundation for Statistical Computing, Vienna, Austria, 2018. [Online]. Available: https://www.R-project.org/
[25] M. Fidler, Y. Xiong, R. Schoemaker, J. Wilkins, M. Trame, T. Post, and W. Wang,nlmixr: Nonlinear Mixed Effects Models in Population Pharmacokinetics and Pharmacodynamics, 2018, r package version 1.0.0-7. [Online]. Available: https://CRAN.R-project.org/package=
nlmixr