Inhibited autophagy may contribute to heme toxicity in cardiomyoblast cells
Alexandra Gyongyosi
a, Kitti Szoke
a, Ferenc Fenyvesi
b, Zsolt Fejes
c, Ildiko Beke Debreceni
c, Bela Nagy Jr.
c, Arpad Tosaki
a, Istvan Lekli
a,*aDepartment of Pharmacology, Faculty of Pharmacy, University of Debrecen, Debrecen, Hungary
bDepartment of Pharmaceutical Technology, Faculty of Pharmacy, University of Debrecen, Debrecen, Hungary
cDepartment of Laboratory Medicine, Faculty of Medicine, University of Debrecen, Debrecen, Hungary
a r t i c l e i n f o
Article history:
Received 21 February 2019 Accepted 25 February 2019 Available online 1 March 2019
Keywords:
Autophagy Cardiomyocytes Heme oxygenase-1 Heme
Toxicity
a b s t r a c t
Several groups have demonstrated that induction of heme-oxygenase-1 (HO-1) could protect the myocardium against ischemic events; however, heme accumulation could lead to toxicity. The aim of the present study was to investigate the role of autophagy in heme toxicity.
H9c2 cardiomyoblast cells were treated with different dose of hemin or cobalt-protoporphyrin IX (CoPPIX) or vehicle. Cell viability was measured by MTT assay. DCF and MitoSOX staining was employed to detect reactive oxygen species. Western blot analysis was performed to analyse the levels of HO-1, certain autophagy related proteins and pro-caspase-3 as an apoptosis marker. To study the autophagic flux, CytoID staining was carried out and cells were analyzed byfluorescence microscope and flow cytometry.
Decreased cell viability was detected at high dose of hemin and CoPPIXtreated H9c2 cells in a dose- dependent manner. Furthermore, at concentration of the inducers used in the present study a signifi- cantly enhanced level of ROS were detected. As it was expected both treatments induced a robust elevation of HO-1 level. In addition, the Beclin-1- independent autophagy was significantly increased, but caused a defective autophagicflux with triggered activation of caspase-3.
In conclusion, these results suggest that overexpression of HO-1 by high dose of hemin and CoPPIXcan induce cell toxicity in H9c2 cells via enhanced ROS level and impaired autophagy.
©2019 The Authors. Published by Elsevier Inc. This is an open access article under the CC BY-NC-ND license (http://creativecommons.org/licenses/by-nc-nd/4.0/).
1. Introduction
Heme oxygenases (HOs) exist in two major isoforms with cat- alytic activity including the inducible HO-1 and constitutive HO-2 [1]. The expression of HO-1 occurs at baseline level in most tis- sues under physiological circumstances and it can be highly induced in response to various harmful conditions [2]. HO-1 is increasingly recognized as an important mediator of cellular ho- meostasis in case of stress and cell injury. It plays a crucial role in cell survival and also inhibits apoptosis through several distinct mechanisms [3]. However, heme is a“double edged sword”[4]; in small amount, it acts as a functional group of heme proteins, and provides indispensable cellular functions; however, when a large amount of heme accumulates, it has been found to be toxic, which
manifests as an extremely diverse process in large variety of cell types [5]. In general, hem toxicity is accompanied by enhanced generation of iron-derived reactive oxygen species (ROS), DNA damage, with oxidation of lipids and proteins [6]. For this purpose, former studies have investigated that CoPPIX and hemin were cytotoxic on different cell types. Cai et al. have used series of dose of CoPPIXand found that treatment with 10e40mM CoPPIXwas not toxic for human cardiac stem cells [7]. Additionally, cell culture experiments have shown that 3e30mM hemin was sufficient to decrease the cell viability of cultured neurons and astrocytes by 30e40% [8]. Interestingly, hemin was not significantly affected the cell viability on CaCo-2 cells at the concentrations up to 100mM [9].
Furthermore, Gemelli et al. investigated the cytotoxic effect of he- min (0.1e1 mM) in colon epithelial cell line. They found that hemin decreased the cell viability in a dose and time dependent manner [10]. Autophagy is an evolutionarily conserved, dynamic and highly regulated process of self-digestion. There are at least three different
*Corresponding author. Department of Pharmacology, Faculty of Pharmacy, University of Debrecen, Nagyerdei krt. 98, 4032, Debrecen, Hungary.
E-mail address:lekli.istvan@pharm.unideb.hu(I. Lekli).
Contents lists available atScienceDirect
Biochemical and Biophysical Research Communications
j o u r n a l h o m e p a g e :w w w . e l s e v ie r . c o m / l o c a t e / y b b rc
https://doi.org/10.1016/j.bbrc.2019.02.140
0006-291X/©2019 The Authors. Published by Elsevier Inc. This is an open access article under the CC BY-NC-ND license (http://creativecommons.org/licenses/by-nc-nd/4.0/).
types of autophagy: macroautophagy (hereafter referred as auto- phagy), microautophagy and chaperone-mediated autophagy.
Autophagy includes a series of sequential steps. Its initiation starts with the activation of the class III PI3K/Vsp34 and Beclin-1 com- plex. Elongation of isolation membrane by ATGs, LC3B and p62 proteins is then processed with the maturation of autophagosome (double-membrane structure) and followed by fusion with a lyso- some generating autolysosome [11].
Overexpression of HO-1 by human HO-1 recombinant plasmid prevented the cardiac dysfunction at high glucose conditions and enhanced the level of autophagy [12]. Higdon et al. has used various concentrations of hemin to induce HO-1 and found that hemin caused mitochondrial dysfunction in endothelial cells by post- translational modification of proteins induced by reactive lipid and oxygen species. Furthermore, hemin exposure also induced mitophagy, but it was not sufficient to prevent cell death [13].
Nevertheless, heat stress induced HO-1 expression suppressed the protective autophagy in cerebellar Purkinje cells [14].
The present study was planned to investigate the role of autophagy-related heme toxicity.
2. Materials and methods 2.1. Materials
Hemin, cobalt-protoporphyrin IX (CoPPIX), medium, serum and MTT were purchased from Sigma (St. Louis, MO, USA) DCFDA from Santa Cruz Biotechnology (Dallas, TX, USA); MitoSOX from Life tech- nologies (Paisley, Scotland). The H9c2 cells were obtained from ATCC, CRL-1446, LGC Standards GmbH Wesel, Germany. Stain-Free gels were purchased from Bio-Rad Laboratories (Hercules, CA, USA). HO-1 antibody was obtained from Abcam (Cambridge, UK). Beclin-1, LC3B, p62 and Caspase-3 antibodies were obtained from Cell Signaling Technology (Boston, MA, USA). CYTO-ID Autophagy Detection Kit 2.0 was bought from Enzo Life Sciences, Inc. (Farmingdale, NY, USA).
2.2. Cell culture and treatment
Cells were cultured in Dulbecco's modified Eagle's medium (DMEM) supplemented with 10% fetal bovine serum and 1%
streptomycin-penicillin at 37C in a humidified incubator consist- ing of 5% CO2 and 95% air. Cells were exposed to eight different conditions: only medium (untreated control group); medium containing 20 mM NaOH (vehicle treated control group); 3mM hemin; 10mM hemin; 30mM hemin; 100mM hemin; 2.5mM CoPPIX; 25mM CoPPIXand 100mM CoPPIXgroups for 24 h.
2.3. Cell viability assay
Cell viability was measured by MTT experiments on 96-well plates. After treatment, MTT solution (final concentration of 0.5 mg/ml) was added to each well and incubated for 3.5 h at 37C.
Then medium was replaced by isopropyl alcohol to dissolve for- mazan product and incubated for 30 min at 37C. Absorbance was measured with a microplate reader (FLUOstar OPTIMA, BMG Lab- tech) at 570 and 690 nm. The values were expressed relative to untreated control, which was represented as 100% of viability. 1%
H2O2were used as positive control. Absorbance values were aver- aged across 7 replicate wells, and repeated minimum 3 times.
2.4. Protein isolation
After the treatment, samples were lysed in 100ml isolating buffer (in mM: 25 Tris-HCl, 25 NaCl, 1 orthovanadate, 10 NaF, 10 pyrophosphate, 10 okadaic acid, 0.5 EDTA, 1 PMSF, 1x protease
inhibitor cocktail and TritonX-100). Subsequently, samples were centrifuged at 14000 rpm at 4C for 10 min in three times freezing- melting cycles. The supernatant fraction were collected and protein concentration was determined using BCA kit (Thermo Scientific, Rockford, IL, USA).
2.5. Western blotting
A total of 25mg of protein in each sample was separated on TGX Stain-Free™12% acrylamide gels. Then, gels were exposed to UV light thereby trihalo compounds contained in stain-free gels covalently bind to tryptophan residues in proteins allowing total protein quantification. After transferring the proteins to PVDF membranes for 1 h at 100 V, membranes were exposed by another brief irradiation and the resulting fluorescence signals were recorded, and the signal intensity is proportional to the total pro- tein volume. After blocking with 5% of non-fat dry milk in TBST, membranes were incubated with primary antibody solution at 4C, overnight. The membranes were washed with TBST and incubated with HRP-conjugated secondary antibody solution. After washing, the membranes were incubated with Clarity Western ECL substrate (Bio-Rad Laboratories) to visualize by enhanced chem- iluminescence bands according to the recommended procedure (ChemiDoc Touch, Bio-Rad Laboratories). The chemiluminescent bands and each total protein lane intensity were measured by Image Lab software (Bio-Rad Laboratories). During quantification, protein density is measured directly on the membranes and re- flected to total loaded proteins. Thus, this type of normalization eliminates the need to select housekeeping protein [15,16].
2.6. DCFDA staining
Cells were seeded in black 96-well plates. After cells adhered, medium was removed and cells were washed with PBS. DCFDA dye was added for 1 h and diffused into cells. At the end of incubation period excess amount of the dye was removed and fresh medium was added back. After 30 min cells were treated with hemin and CoPPIX(100mM) for 24 h. Then, medium was removed and washed with PBS. Then the intensity offluorescent compound was detected byfluorescence spectroscopy with excitation and emission spectra of 485 nm and 528 nm respectively.
2.7. MitoSOX staining
Cells were seeded on coverslip. After the treatment with hemin and CoPPIX(100mM) for 24 h, medium was removed and cells were washed 3 times with PSB. MitoSOX™Red was added for 10 min at 37C in dark. Then, dye was removed and cells were washed 3 times with PBS. Nucleus was stained by DAPI. Cells werefixed with 4% formaldehyde then washed again. The coverslips were placed to a slide and examined the staining by fluorescence microscopy.
Images were captured by Zeiss Axio Scope. A1fluorescent micro- scope and analyzed with ZEN 2011 v.1.0.1.0. Software (Carl Zeiss Microscopy GmbH, München, Germany). Mean intensity of red color was quantified by Image J software (NIH, Bethesda, Maryland, USA). 100 cells/group were measured in 3 different experiment.
2.8. CYTO-ID staining
CYTO-ID Autophagy Detection Kit 2.0 was performed to mea- sure autophagic vacuoles and monitor autophagic living cells were seeded overnight and treated with hemin and CoPPIX(100mM) for 24 h. Rapamycin (5mM) was used as the positive control. Auto- phagic process was inhibited by chloroquine (10mM, for 18 h). After treatments, cells were collected by centrifugation and washed with
1x assay buffer. The cell pellets were resuspended in fresh 1x assay buffer. 250mL of the diluted CYTO-ID Green stain solution was added to each sample and mixed, then incubated for 30 min at 37C in dark. Cells were washed with 1assay buffer andfixed with 1% formaldehyde, then were immediately analyzed with a FC- 500 flow cytometer (Beckman Coulter, Pasadena, CA, USA).
The results were analyzed by CPX Analysis Software (Beckman Coulter). Autophagic flux was measured byDMFI in each group (DMFI: MFIwith ChloroquineeMFIwithout Chloroquine).
Cells were seeded on coverslips and treated with hemin and CoPPIX(100mM) for 24 h. Rapamycin (5mM) was used as the posi- tive control. Autophagic process was inhibited by chloroquine (10mM, 18 h). After treatments, the medium was removed and cells were washed with 1x Assay Buffer. A total of 100mL of Microscopy Dual Detection Reagent was added to each sample and incubated for 30 min at 37C. Cells were washed with 1assay buffer and fixed with 4% formaldehyde then washed again. The coverslips were placed to a slide and examined the staining byfluorescence microscopy (Zeiss Axio Scope. A1).
2.9. Statistical analysis
The data were expressed as mean ± SEM. Statistical analysis were performed with GraphPad Prism version 5 (La Jolla, CA, USA).
One-way analysis of variance (ANOVA) test followed by Dunnett multiple comparison tests, which identified the significant differ- ence between control and treated groups. A probability value of P<0.05 was used as the criterion for statistical significance. When significant (p<0.05), *, **, and *** represent p<0.05, p<0.01, and p<0.001 at the Dunnett's post-test, respectively.
3. Results
3.1. Effects of high doses of HO-1 inducers on viability of H9c2 cells and hemeoxygenase-1 expression
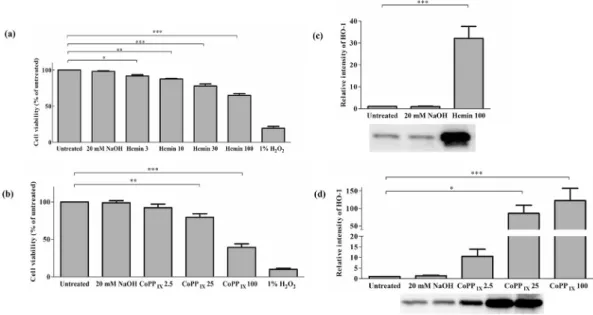
As it is shown inFig. 1panel a and b, treatment with hemin or CoPPIXdecreased the viability of H9c2 cardiomyocytes in a dose-
dependent manner. At hemin concentration of 25 and 100mM the toxic effect was profound compared to untreated sample. Addi- tionally, similar alteration in cell viability was detected if CoPPIX
was used. Average percentage of cell viability for 25 and 100mM CoPPIXwere as the follows: 79.3±4.9%; 39.1±4.8%, respectively (Fig. 1b). Western blot analysis using an antibody against HO-1 indicated a significant increase in HO-1 expression in H9c2 cells (Fig. 1c and d).
3.2. Effect of hemin or CoPPIXtreatment on ROS level
In order to study the role of ROS in the toxic effect induced by high dose of hemin or CoPPIXtreatments in H9c2 cells MitoSOX and DCFDA staining were carried out. MitoSOX detect mitochondrial superoxide, whereas DCFDA offers general ROS detection. As it can be seen in Fig. 2a and b both hemin and CoPPIX treatments enhanced ROS, which could play an important role in the toxic effect of the inducers and hem.
3.3. Effect of hemin or CoPPIXtreatment on autophagy
As it is shown in Fig. 3a and b the expression level of Beclin-1 remained unchanged after HO-1 induction with hemin or CoPPIX. Significantly increased LC3B-II (Fig. 3c and d) and p62 (Fig. 3e and f) expressions were measured by Western blotting. These results showed that hemin treatment markedly upregulated LC3B-II and p62 protein levels in cardiomyocytes, indicating that autophagy was induced, however, the level of p62 remained elevated suggesting the lack of its function. We further investigated these autophagic markers after HO-1 in- duction by CoPPIX. The results supported the upregulation of autophagy pathway. Similarly, we found significantly increased expression level of LC3B-II and p62 in CoPPIX 100 group compared to untreated cells. To confirm our Western blot re- sults, Cyto-ID Green staining were carried out and samples were analyzed by microscopy and flow cytometry. Monitoring autophagicflux, cells were treated with chloroquine, which is a known autophagic flux inhibitor.
Fig. 1. Effect of HO-1 inducers on viability of H9c2 cells and HO-1 expression.Cells were treated with various concentrations of hemin (a) and CoPPIX(b). 20 mM NaOH was used as treated control. Cell viability was measured by MTT assay. Viability was reported as percentages of cell surviving hemin (n¼4) or CoPPIX(n¼6) exposure compared to the untreated group. *, **, and ***represent p<0.05, p<0.01, and p<0.001, respectively. Analysis of protein level of HO-1 on H9c2 cell lysate following treatment with hemin (c) or CoPPIX(d) by Western blot. Values were normalized to the total protein level, and expressed as the mean±SEM, n¼6e8 in each group. *, *** represent p<0.05, p<0.001, respectively, compared to the untreated control.
The number of autophagic vacuoles were elevated in untreated and 20 mM NaOH cells in the presence of chloroquine indicating a functioning autophagicflux (Fig. 3g, h, and 3i). Rapamycin was used as positive control, these pictures show numerous vacuoles in the presence or absence of chloroquine. InFig. 3g, greenfluorescent signals and punctate structures were detected. However, after the CoPPIX treatment we found some autophagic vacuoles with decreased number compared to the untreated group. Comparing hemin and Hemin þ Q groups no significant alteration was observed. Same results were seen in CoPPIXtreated groups in the presence or absence of chloroquine. To quantify the autophagic flux,flow cytometric analysis was carried out. TheDMFI in each group was assessed (Fig. 3h). The results from this measurement supported the microscopic data.DMFI were 20.9 and 22.5 in un- treated and 20 mM NaOH treated group supporting the existence of normal autophagicflux. However, after hemin treatmentDMFI was actually zero. Additionally, this value also significantly decreased in the CoPPIXtreated group. As expected, a significant increase was found in DMFI (43.5) in rapamycin treated cells. The findings indicate that autophagic process is incomplete when high amount of hemin or CoPPIXwas used for HO-1 induction. Thus, ourfinding shows that both hemin and CoPPIXinduced Beclin-1 independent or non-canonical autophagy; however, it was not functioning.
3.4. Apoptosis activation by influence of high concentration of hemin and CoPPIX
A diminished level of pro-caspase-3 and enhanced level of cleaved caspase-3 after the hemin or CoPPIXtreatment was detec- ted in comparison with controls (Fig. 4), suggesting that the apoptotic machinery is activated after high dose of hemin or CoPPIX
treatment.
4. Discussion
The current study shows that high doses of different HO-1 in- ducers possess a toxic effect on H9c2 cells. The toxic effect is
accompanied by malfunctioning autophagy. Several lines of evi- dence indicated that different concentrations (0.1e1000mM) of hemin could increase the level of HO-1 expression [10]; however, it may have positive outcome [17] or cytotoxic effects [4] depending on the dose used. Recently, it has been shown that induction of HO- 1 by 20mM CoPPIXprotected H9c2 cells against H/R evidenced by decreased apoptosis [17]. However, in the present study, a higher dose of CoPPIXwas used, which exhibited a toxic effect. The car- diovascular system has number of cytoprotective pathways devel- oped to prevent the cytotoxic effects of heme and iron, such as HO- 1 or hemopexin [18]. Heme toxicity may occur under different pathological conditions including ischemia/reperfusion [6]. When the amount of free heme exceeds the capacity of heme detoxifying enzymes, free heme exerts its toxic effect, which could be mediated via enhanced ROS generation and inflammation. As expected, in our experiments, an enhanced level of HO-1 was detected upon treat- ment with HO-1 inducer in a dose-dependent manner. However, our cell viability assay indicated an increased toxic effect. In line with the literature an enhanced level of ROS was detected in both treated groups, indicating that under the experimental circum- stances used in this study the elevated ROS level contribute to the cell death.
Several studies investigated the connection between HO-1 and autophagy in different tissues. Resveratrol induced HO-1 expres- sion attenuates neurotoxicity through increased autophagolyso- some formation [19]. Additionally, the HO-1 is upregulated in liver sepsis, which could be an adaptive response to metabolize free intracellular heme release and suggested a pro-survival induction of autophagy [20]. Revelation of connection with autophagy in cardiomyocytes could give a new dimension to studies involving HO-1. The precise role of autophagy in cardiovascular system has always elicit controversy; there are evidence to support its role as a saviour [21] and also as a killer [22]. Our results show that auto- phagy is induced since the level of LC3B-II was significantly higher in the presence of HO-1 inducers [23]. It is known that during autophagy, the cytosolic LC3B-I is conjugated to phosphatidyleth- anolamine to form LC3B-II, which is incorporated to the Fig. 2. Effect of HO-1 inducers on ROS level.Cells were treated with hemin or CoPPIX. 20 mM NaOH was used as treated control. ROS production were measure by DCF (a) and MitoSOX staining (b), representative pictures (c). Results of DCF staining (five repetition) are expressed as the intensity offlorescent compound. Results of MitoSOX staining are expressed as median intensity of MitoSOX Red Results of 100 cells per group repeated three-times. *, and ***represent p<0.05, p<0.001, respectively.
autophagosomal membrane [24]. p62 is another widely used marker, which physically links autophagic cargo to the autophagic membrane [25]. p62 binds directly to LC3 and GABARAP family proteins and is selectively degraded by autophagy processes. Since p62 accumulates when autophagy is inhibited/impaired [26], decreased levels can be observed when autophagy is induced by oxidative stress [27]. Thus, p62 serves as an indicator of autophagic degradation and used as a marker to study autophagic flux.
Impaired autophagicflux by HO-1 dependent autophagy was pre- viously found [19]. In line with this study an enhanced level of p62 was found upon HO-1 induction, indicating that the autophagy is malfunctioning. Recently, it has been shown that genetic over- expression of HO-1 protects against hypoxia/reoxigenisation via induction of autophagy in H9c2 [28]. Similarly, the authors found elevated levels of LC3-II in cells overexpressing HO-1 after chal- lenging with H/R. Contrary, this enhanced level of LC3-II was accompanied by decreased level of p62, decreased level of ROS and enhanced mitochondrial stability. However, the difference may be arisen from the different model, since in the current study, toxicity of high dose of HO-1 inducers was examined, while in the
publication of Chen and co-authors, the effect of H/R was tested.
Another major difference between Chen et al. and our results is the level of HO-1. Here a robust enhancement in the level of HO-1 were observed in our study, while in the other study mild induction of HO-1 was found.
Autophagyflux is a dynamic process that includes initiation, elongation, maturation and degradation. Interestingly, autophago- some formation was independent of Beclin-1, indicating non- canonical autophagy activity in hemin and CoPPIX-treated cells (Fig. 3a and b). Recent findings suggest that autophagosome biogenesis occurs also in the absence of Beclin-1 [29]. To further study the autophagicflux, cells were treated with chloroquine, which induces the accumulation of autophagic vacuoles. Thefluo- rescent microscopy images andflow cytometry results revealed an enhanced number of autophagic vacuoles in control and rapamycin treated cells. However, in line with our Western blot data, we failed tofind any differences between signals in HO-1 inducers treated cells in the presence or absence of chloroquine, further supporting that malfunctioning autophagy contributes to heme toxicity.
Several studies published that autophagy is necessary process to Fig. 3. Effects of HO-1 induction with hemin or CoPPIXon autophagy and autophagicflux.Analysis of protein levels of Beclin-1, LC3B-II and p62 were performed after treatment with hemin (a, c, e), or CoPPIX(b, d, f) by Western blot. Values were normalized to the total protein level, and expressed as the mean±SEM, n¼6e15. Cells were treated with vehicle, hemin, CoPPIXand rapamycin in the presence or absence of chloroquine. Cells were stained with Cyto-ID Green before microscopic andflow cytometric analysis.
Representative pictures of Cyto-ID staining (g). Flow cytometric analysis after Cyto-ID Green staining (h). Data are expressed byDMFI in each group whereDMFI means MFIwith ChloroquineeMFIwithout Chloroquine. The values are expressed as the mean±SEM, n¼7, in the case of positive control n¼4. Representative histogram offlow cytometric analysis after Cyto-ID Green staining (i). Grey histograms represent MFI without chloroquine and green histograms are with chloroquine. *, **, and ***represent p<0.05, p<0.01, and p<0.001 compared to the untreated control.
remove damaged organelles. If this process fails or overwhelmed, these damaged organelles trigger an apoptotic cell death [30]. Our Western-blot results indicate a lower level of pro-caspase-3 and enhanced level of cleaved-caspase-3 indicating the activation of apoptosis. Taken together, we demonstrated that overexpression of HO-1 by high dose of hemin and CoPPIXinduce cell toxicity in H9c2 cells, in which malfunctioning autophagy and enhanced ROS level plays a role.
5. Limitations of the study
In the current study both inducers were used in high concen- trations, thus, we cannot rule out that direct toxicity of the inducers may contribute to the harmful effect. However, as it was reported that 20mM of CoPPIXprotected H9c2 cell [28]. Furthermore, we did not used HO-1 inhibitors, which could have confirmed ourfindings.
Acknowledgements
This research was supported by grants from OTKA-PD-111794, NKFIH-K-124719 by the European Social Fund in the framework of TAMOP 4.2.4. A/2-11-1-2012-0001 “National Excellence Program”, the ÚNKP-17-4-III-DE-219, FK_17 (FK124634) research grant of the National Research, Development and Innovation Office, Hungary, the Janos Bolyai Research Scholarship of the Hungarian Academy of Sciences (BO/00290/16) and GINOP-2.3.2-15-2016-00043.
Transparency document
Transparency document related to this article can be found online athttps://doi.org/10.1016/j.bbrc.2019.02.140.
Data availability
All data of this study are available from thefirst author upon request.
References
[1] M.D. Maines, Heme oxygenase: function, multiplicity, regulatory mechanisms, and clinical applications, FASEB J. 2 (1988) 2557e2568.
[2] F.H. Bach, Heme oxygenase-1 as a protective gene, Wien Klin. Wochenschr.
114 (Suppl 4) (2002) 1e3.
[3] R. Gozzelino, V. Jeney, M.P. Soares, Mechanisms of cell protection by heme oxygenase-1, Annu. Rev. Pharmacol. Toxicol. 50 (2010) 323e354.
[4] J. Balla, G. Balla, V. Jeney, et al., Ferriporphyrins and endothelium: a 2-edged sword-promotion of oxidation and induction of cytoprotectants, Blood 95 (2000) 3442e3450.
[5] V. Jeney, J. Balla, A. Yachie, et al., Pro-oxidant and cytotoxic effects of circu- lating heme, Blood 100 (2002) 879e887.
[6] S. Kumar, U. Bandyopadhyay, Free heme toxicity and its detoxification sys- tems in human, Toxicol. Lett. 157 (2005) 175e188.
[7] C. Cai, L. Teng, D. Vu, et al., The heme oxygenase 1 inducer (CoPP) protects human cardiac stem cells against apoptosis through activation of the extra- cellular signal-regulated kinase (ERK)/NRF2 signaling pathway and cytokine release, J. Biol. Chem. 287 (2012) 33720e33732.
[8] R.F. Regan, Y. Wang, X. Ma, et al., Activation of extracellular signal-regulated kinases potentiates hemin toxicity in astrocyte cultures, J. Neurochem. 79 (2001) 545e555.
[9] S. Ishikawa, S. Tamaki, M. Ohata, et al., Heme induces DNA damage and hyperproliferation of colonic epithelial cells via hydrogen peroxide produced Fig. 4. Effects of HO-1-induction on caspase-3 level.Analysis of protein level of pro-caspase-3 and cleaved-caspase-3 after hemin (a), CoPPIX(b) treatment by Western blot. Values were normalized to the total protein level, and expressed as the mean±SEM, n¼6 and n¼9. **represent p<0.01 compared to the untreated control.
by heme oxygenase: a possible mechanism of heme-induced colon cancer, Mol. Nutr. Food Res. 54 (2010) 1182e1191.
[10] C. Gemelli, B.M. Dongmo, F. Ferrarini, et al., Cytotoxic effect of hemin in colonic epithelial cell line: involvement of 18 kDa translocator protein (TSPO), Life Sci. 107 (2014) 14e20.
[11] N. Mizushima, B. Levine, A.M. Cuervo, et al., Autophagyfights disease through cellular self-digestion, Nature 451 (2008) 1069e1075.
[12] Y. Zhao, L. Zhang, Y. Qiao, et al., Heme oxygenase-1 prevents cardiac dysfunction in streptozotocin-diabetic mice by reducing inflammation, oxidative stress, apoptosis and enhancing autophagy, PLoS One 8 (2013) e75927.
[13] A.N. Higdon, G.A. Benavides, B.K. Chacko, et al., Hemin causes mitochondrial dysfunction in endothelial cells through promoting lipid peroxidation: the protective role of autophagy, Am. J. Physiol. Heart Circ. Physiol. 302 (2012) H1394eH1409.
[14] C.W. Li, Y.F. Lin, T.T. Liu, et al., Heme oxygenase-1 aggravates heat stress- induced neuronal injury and decreases autophagy in cerebellar Purkinje cells of rats, Exp. Biol. Med. 238 (2013) 744e754.
[15] A. Gurtler, N. Kunz, M. Gomolka, et al., Stain-Free technology as a normali- zation tool in Western blot analysis, Anal. Biochem. 433 (2013) 105e111.
[16] R. Ghosh, J.E. Gilda, A.V. Gomes, The necessity of and strategies for improving confidence in the accuracy of western blots, Expert Rev. Proteom 11 (2014) 549e560.
[17] C. Li, C. Zhang, T. Wang, et al., Heme oxygenase 1 induction protects myo- cardiac cells against hypoxia/reoxygenation-induced apoptosis : the role of JNK/c-Jun/Caspase-3 inhibition and Akt signaling enhancement, Herz 41 (2016) 715e724.
[18] J.R. Delanghe, M.R. Langlois, Hemopexin: a review of biological aspects and the role in laboratory medicine, Clin. Chim. Acta 312 (2001) 13e23.
[19] T.K. Lin, S.D. Chen, Y.C. Chuang, et al., Resveratrol partially prevents rotenone-
induced neurotoxicity in dopaminergic SH-SY5Y cells through induction of heme oxygenase-1 dependent autophagy, Int. J. Mol. Sci. 15 (2014) 1625e1646.
[20] E.H. Carchman, J. Rao, P.A. Loughran, et al., Heme oxygenase-1-mediated autophagy protects against hepatocyte cell death and hepatic injury from infection/sepsis in mice, Hepatology 53 (2011) 2053e2062.
[21] G.R. De Meyer, W. Martinet, Autophagy in the cardiovascular system, Biochim.
Biophys. Acta 1793 (2009) 1485e1495.
[22] K. Nishida, S. Kyoi, O. Yamaguchi, et al., The role of autophagy in the heart, Cell Death Differ. 16 (2009) 31e38.
[23] D.J. Klionsky, K. Abdelmohsen, A. Abe, et al., Guidelines for the Use and Interpretation of Assays for Monitoring Autophagy third ed., vol. 12, Auto- phagy, 2016, pp. 1e222.
[24] I. Tanida, T. Ueno, E. Kominami, LC3 and autophagy, Methods Mol. Biol. 445 (2008) 77e88.
[25] K.B. Larsen, T. Lamark, A. Overvatn, et al., A reporter cell system to monitor autophagy based on p62/SQSTM1, Autophagy 6 (2010) 784e793.
[26] I. Tanida, Autophagosome formation and molecular mechanism of autophagy, Antioxidants Redox Signal. 14 (2011) 2201e2214.
[27] T. Ishii, K. Itoh, S. Takahashi, et al., Transcription factor Nrf2 coordinately regulates a group of oxidative stress-inducible genes in macrophages, J. Biol.
Chem. 275 (2000) 16023e16029.
[28] D. Chen, Z. Jin, J. Zhang, et al., HO-1 protects against hypoxia/reoxygenation- induced mitochondrial dysfunction in H9c2 cardiomyocytes, PLoS One 11 (2016) e0153587.
[29] S. Tian, J. Lin, J. Jun Zhou, et al., Beclin 1-independent autophagy induced by a Bcl-XL/Bcl-2 targeting compound, Z18, Autophagy 6 (2010) 1032e1041.
[30] G. Marino, M. Niso-Santano, E.H. Baehrecke, et al., Self-consumption: the interplay of autophagy and apoptosis, Nat. Rev. Mol. Cell Biol. 15 (2014) 81e94.