CONCENTRATING HORMONE IN THE
REGULATION OF VIGILANCE; COMPARISON WITH THE EFFECT OF ESCITALOPRAM, THE SSRI
ANTIDEPRESSANT
PhD thesis
Szilvia Vas, Kalmárné
Semmelweis University
János Szentágothai Doctoral School of Neurosciences
Supervisors: Dr. György Bagdy, D.Sc.
Dr. Zsuzsanna Tóth, PhD
Official reviewers: Dr. Márk Molnár, D.Sc.
Dr. Gergely Zachar, PhD
Head of the Final Examination Committee: Dr. László Köles, PhD
Members of the Final Examination Committee: Dr. Ildikó Miklya, PhD Dr. Lucia Wittner, PhD
Budapest
2015
2
1. Table of Contents
1. Table of Contents ... 2
2. List of Abbreviations ... 5
3. List of Figures ... 7
4. List of Tables ... 9
5. Introduction ... 10
5.1. The stages of sleep and wakefulness ... 10
5.1.1. Wake... 12
5.1.2. Non rapid eye movement (non-REM) sleep ... 13
5.1.3. Rapid eye movement (REM) sleep ... 14
5.2. The role of brain structures in the regulation of sleep-wake cycle ... 15
5.2.1. Brainstem ... 17
5.2.2. Basal forebrain ... 18
5.2.3. Thalamus and cortex ... 19
5.2.4. Hypothalamus... 20
5.2.4.1. The preoptic area ... 21
5.2.4.2. The posterior hypothalamus ... 21
5.2.4.3. The lateral hypothalamic area... 22
5.2.4.3.1. The hypocretins /orexins ... 24
5.2.4.3.2. The melanin-concentrating hormone (MCH) ... 24
5.2.4.3.3. The nesfatin-1/NUCB2 ... 27
5.3. Fos expression as an indicator of neuronal activity ... 30
6. Objectives ... 32
7. Materials and methods ... 34
7.1. Housing of the animals ... 34
7.2. Neuromorphological studies: Experiment 1 and 2 ... 34
7.2.1. REM sleep deprivation (flower pot) method... 34
7.2.2. Immunohistochemistry (IHC) ... 35
3
7.2.2.1. Experiment 1. - MCH/Fos double immunostaining and morphometry
analysis ... 35
7.2.2.2. Experiment 2. - MCH/nesfatin/Fos triple immunolabeling and morphometry analysis ... 36
7.2.3. Drug treatment... 37
7.2.4. Experimental groups ... 38
7.3. Electroencephalography (EEG): Experiment 3 and 4 ... 39
7.3.1. EEG surgery ... 40
7.3.2. EEG data acquisition ... 41
7.3.3. Design of Experiment 3 and 4 ... 41
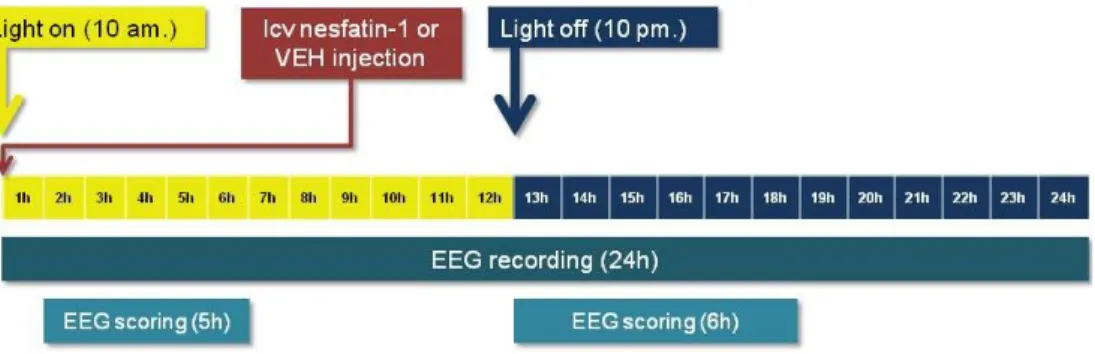
7.3.3.1. Experiment 3. – Effect of centrally administered nesfatin-1 on the EEG ... 41
7.3.3.2. Experiment 4. – Effect of two doses of intraperitoneally injected escitalopram on EEG ... 42
7.3.4. Sleep scoring ... 42
7.3.5. EEG power spectra analysis ... 43
7.3.6. Heat map spectra ... 43
7.4. Statistics ... 45
8. Results ... 46
8.1. Immunohistochemistry ... 46
8.1.1. Experiment 1: Activation of MCH neuron population as a result of ‘REM sleep rebound’ in different hypothalamic/thalamic nuclei ... 46
8.1.2. Experiment 2: Activation of nesfatin-containing neurons in different hypothalamic/thalamic structures as a result of ’REM sleep rebound’ ... 49
8.2. Electroencephalography (EEG) ... 52
8.2.1. The effect of exogenously administered nesfatin-1 on the architecture of sleep-wake cycle ... 52
8.2.1.1. Passive phase: 2nd-6th hours following central injection ... 52
8.2.1.2. Active phase: 13th-18th hours following central injection ... 57
8.2.2. Comparison of the EEG power spectral data of nesfatin-1 and escitalopram using ‘state space analysis’ ... 59
8.2.3. Comparison of the EEG power spectra of nesfatin-1 and escitalopram using conventional spectral analysis ... 65
9. Discussion ... 70
4
10. Conclusions ... 83
11. Summary ... 84
12. Összefoglalás ... 85
13. Bibliography ... 86
14. Bibliography of the candidate’s publications ... 107
14.1. Publications related to the PhD thesis ... 107
14.2. Publications that not related to the PhD thesis ... 107
15. Acknowledgements ... 109
5
2. List of Abbreviations
ACTH adrenocorticotropin ANOVA analysis of variance
ARAS ascending reticular activating system
AW active wake
BF basal forebrain
CART cocaine-amphetamine-regulated transcript CNS central nervous system
CRH corticotrophin-releasing hormone DAB diaminobenzidine
DLH dorsolateral hypothalamus DRN dorsal raphe nucleus
EEG electroencephalography / electroencephalographic EMG electromyography / electromyographic
5-HT 5-hydroxytryptamine / serotonin GABA γ-aminobutyric acid
Hcrt orexin/hypocretin
icv intracerebroventricular/intracerebroventricularly IHC immunohistochemistry
ip intraperitoneal/intraperitoneally
IR immunoreactive
IS intermediate stage of sleep LC locus coeruleus
LDT laterodorsal tegmental nucleus LH lateral hypothalamic area
MCH melanin-concentrating hormone MCHR MCH receptor
MnPO median preoptic nucleus MRN median raphe nucleus
MS-DBB medial septum-diagonal band of Broca
NA noradrenaline
6 nesfatin nesfatin-1/NUCB2
NiDAB nickel-enhanced diaminobenzidine non-REM non-rapid eye movement (sleep) NUCB2 nucleobindin 2
PFA perifornical area
PFH perifornical hypothalamic area PH posterior hypothalamus
POA preoptic area
POMC proopiomelanocortin
PPT pedunculopontine tegmental nucleus PVN hypothalamic paraventricular nucleus
PW passive wake
qEEG quantitative electroencephalography REM rapid eye movement (sleep)
SCN suprachiasmatic nucleus SON supraoptic nucleus
SSRI selective serotonin reuptake inhibitor SWS slow wave sleep
SWS1 light slow wave sleep SWS2 deep slow wave sleep TMN tuberomamillary nucleus
TW total wake
VLPO ventrolateral preoptic area VTA ventral tegmental area
ZI zona incerta / subzona incerta
7
3. List of Figures
Figure 1. Electroencephalographic (EEG) recordings of different vigilance stages in human and rat. ... 11 Figure 2. “Flip-flop” model of wake - sleep and REM - non-REM sleep switch, and
how this cascade is stabilized by orexin/hypocretin (Hcrt) neurons ... 16 Figure 3. Schematic drawing illustrating the key circuits involved in the regulation of sleep and wakefulness in rat brain. ... 19 Figure 4. Schematic illustration of the connection between the orexin/hypocretin
(Hcrt) and the melanin-concentrating hormone (MCH)-containing neurons and their innervations ... 23 Figure 5. Schematic illustration of the flower pot sleep deprivation method in
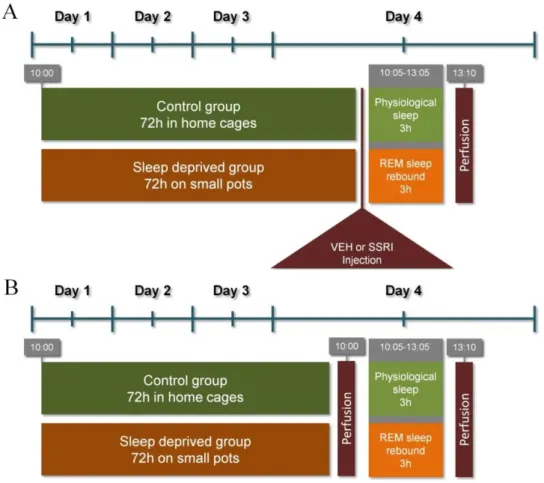
Experiment 1 and Experiment 2 ... 39 Figure 6. Experimental design of the EEG study in Experiment 3: the effect of
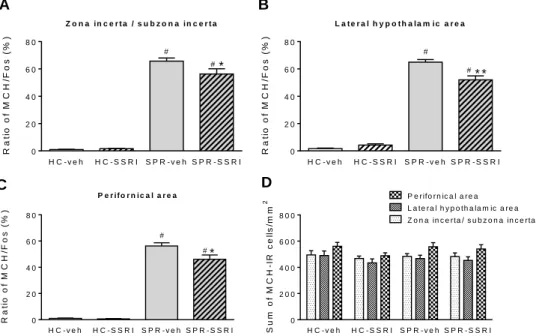
nesfatin-1 on the sleep-wake cycle and EEG spectra ... 41 Figure 7. The neuronal (Fos) activation of the MCH-containing neuronal cell
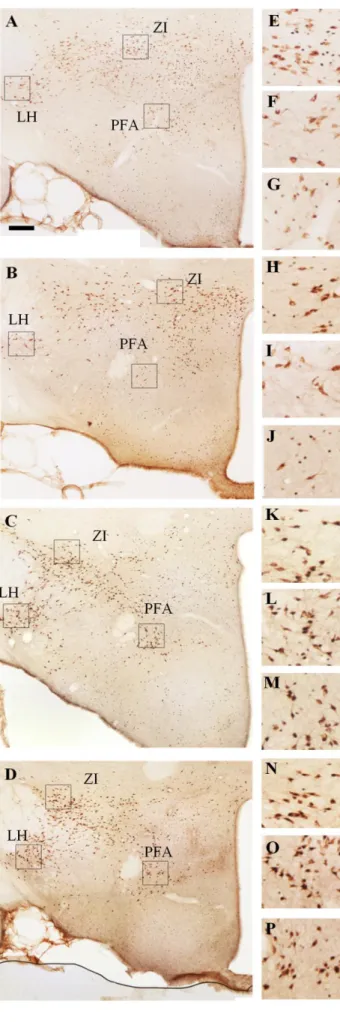
population of different hypothalamic/thalamic structures as a result of ‘REM sleep rebound’ and selective serotonin reuptake inhibitor (SSRI) treatment and their combination. ... 47 Figure 8. Illustrative pictures about the MCH/Fos double immunostaining visualizing
the neuronal activation of the MCH-expressing neurons in different hypothalamic nuclei in four experimental groups as a result of ’REM sleep rebound’ and
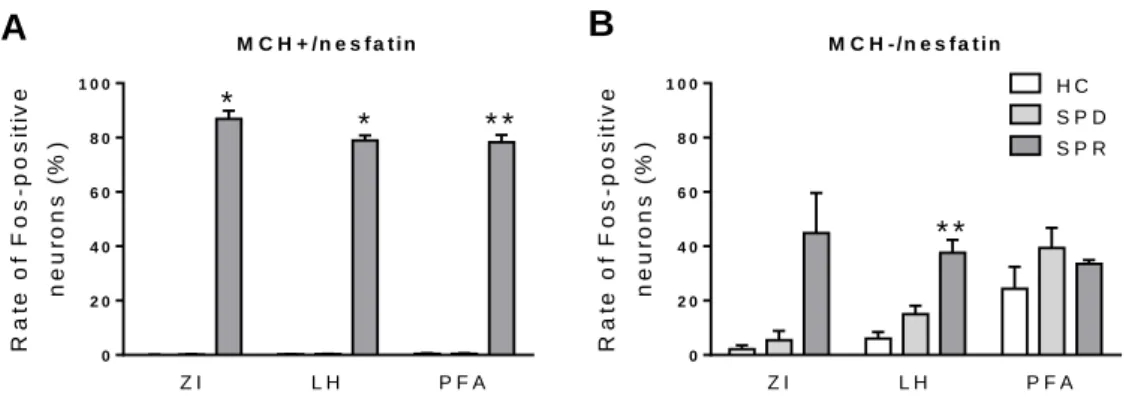
combined SSRI-treatment. ... 48 Figure 9. The neuronal (Fos) activation of the MCH-positive and MCH-negative
nesfatin cell populations of different hypothalamic/thalamic structures as a result of REM sleep deprivation and ‘REM sleep rebound’. ... 50 Figure 10. Photomicrographs illustrating the results of triple fluorescent
immunostaining, visualizing the MCH–positive and –negative nesfatin-1/NUCB2 (nesfatin) neurons in the lateral hypothalamic area of home cage and ’REM sleep rebound’ group ... 51 Figure 11. The effect of intracerebroventricularly (icv) administered nesfatin-1 on the
architecture of sleep-wake cycle ... 54
8
Figure 12. The effect of icv administered nesfatin-1 on the number and average duration of episodes in different vigilance stages during the 2nd-6th h of passive (light) phase. ... 56 Figure 13. The effect of icv administered nesfatin-1 on the number and average
duration of episodes in non-REM vigilance stages during the 2nd-6th h of passive (light) phase ... 57 Figure 14. The effect of icv administered nesfatin-1 on the architecture of sleep-wake
cycle in the active (dark) phase. ... 58 Figure 15. Demonstration of the basic concept of ‘state space analysis’. ... 59 Figure 16. Demonstration of the effect of icv-injected vehicle or nesfatin-1 on the
distributions and density of EEG power in passive (light) phase on a 2-dimensional
‘state space’ heat map ... 61 Figure 17. Demonstration of the effect of 2 and 10 mg/kg escitalopram or vehicle (of the summarized 2nd-3rd h) on the distributions and density of EEG power in passive (light) phase on a 2-dimensional ‘state space’ heat map ... 63 Figure 18. Demonstration of the shifts in the centroid-positions (distance from the
origo on x axis) in REM sleep, total wake and non-REM sleep vigilance stages on the ‘heat map spectra’ performed using ‘state space analysis technique’ in 2 and 10 mg/kg escitalopram-treated groups, compared to vehicle controls ... 64 Figure 19. Effect of nesfatin-1 and two doses (2 and 10 mg/kg) of escitalopram on
the EEG power of total-, active- and passive wake during the 2nd-3rd h of passive (light) phase. ... 66 Figure 20. Effect of nesfatin-1 and two doses (2 and 10 mg/kg) of escitalopram on
the EEG power of REM sleep during the 2nd-3rd h of passive (light) phase,
compared to vehicle control. ... 68 Figure 21. Effect of nesfatin-1 and two doses (2 and 10 mg/kg) of escitalopram on
the EEG power of light- and deep slow wave sleep during the 2nd-3rd h of passive (light) phase. ... 69
9
4. List of Tables
Table 1. Basic EEG rhythms and the typical vigilance stages where the rhythms are most frequently occur in human and rat. ... 12
10
5. Introduction
Sleep is one of the greatest mysteries: from birth, we spend nearly a third of our lives asleep. It is vital to our cognitive and physical performance, memory, health and well-being. Despite decades of research, we are still not sure why. The last decades saw a great progress in the understanding of sleep regulation. The relevance of this understanding is indicated by the fact that in our society sleep problems are often associated with a wide range of medical and psychiatric conditions, moreover, hypnotics are among the most frequently prescribed medications.
According to traditional concepts, sleep is a homeostatic function, that is, a prolonged wakefulness is followed by rebound sleep. It is a property of the whole organism: the animal is awake or asleep. However, in the past few years, a new theory of sleep was born, namely, sleep is a local process and use-dependent. This idea suggests that sleep is a fundamental property of neuronal networks; the homeostatic regulation of sleep can occur in any part of the brain as a result of former activity [1, 2].
5.1. The stages of sleep and wakefulness
Falling asleep takes only a few seconds or minutes, however, in the meanwhile, dramatic changes are processed in the central nervous system (CNS). During the transition, parallel alterations can also be observed in physiological variables, such as breathing, arousability, closure of the eyes and muscle tone. During switching between sleep and wake or between different sleep stages, changes in the global pattern of neuronal activity can be measured by electroencephalography (EEG) [3], while the alterations in muscle tone can be monitored by electromyography (EMG).
The observable extracellular field potential changes in the EEG stem from the synchronized electrical activity of large amount of cortical neurons. The summed synaptic currents of the apical dendrites of pyramidal neurons comprise the main contributors to EEG waves, although neuronal firing and intrinsic membrane properties are also involved [4].
11
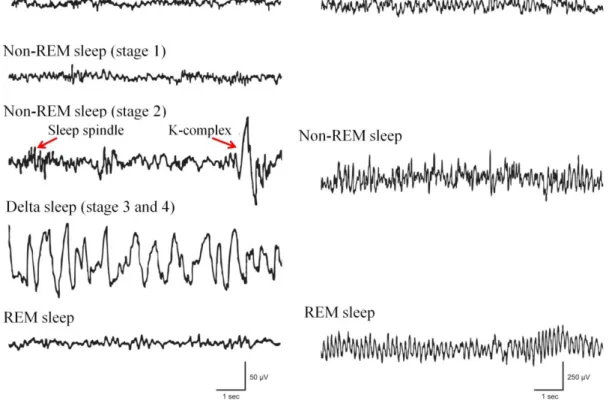
Figure 1. Electroencephalographic (EEG) recordings of different vigilance stages in human and rat. Wakefulness is characterized by desynchronized (low-amplitude and high-frequency) EEG in both human and rat. As sleep deepens, non rapid eye movement (non-REM) sleep in human can be divided into four stages, like stage 1 (superficial sleep), stage 2 (accompanied by the appearance of sleep spindles and K- complexes) as well as stage 3 and 4 (also called delta sleep together due to the high amount of high amplitude, low frequency delta waves). The EEG feature of rapid eye movement (REM) sleep is very similar to that in wakefulness (low-amplitude and high- frequency) in human. In rat, non-REM sleep is also characterized by low frequency delta waves that increase in amplitude and decrease in frequency as sleep deepens, although in most cases non-REM sleep in rat is not parsed into separate stages. In the REM sleep of rat, strong synchronous theta activity is typical, presumably generated by the hippocampus. Based on Brown et al. [5].
12
Table 1. Basic EEG rhythms and the typical vigilance stages where the rhythms are most frequently occur in human and rat [8, 11, 12].
EEG rhythm Frequency range (Hz) Typical Vigilance stage
Human Rat
Delta 0.5-4 non-REM III-IV slow wave sleep
Theta 5-9
non-REM I REM sleep wakefulness
REM sleep wakefulness
Sigma
(spindles) 12-14 non-REM II deep slow wave sleep
Alpha 9-13 drowsiness light slow wave
sleep
Beta 15-30 wakefulness wakefulness
Gamma 30< wakefulness wakefulness
5.1.1. Wake
The state of wakefulness is a complex manifestation of behaviours that are continually changing in response to alterations in the internal and external stimuli. This vigilance stage is characterized by high frequency, low voltage waves (desynchronized or “activated” EEG activity, see on Figure 1) with high muscular activity. These faster EEG rhythms with low amplitude comprise synchronized activity in small functionally interconnected areas. Theta rhythm, typical in wake and rapid eye movement (REM) sleep, appears over more widespread areas, and synchronizes faster, locally generated beta (15-30 Hz) and gamma (>30 Hz) rhythms (Table 1) that oscillations are considered to provide a temporal framework for higher-order brain functions such as conscious awareness, attention, representation of spatial position and memory [6]. In rat, the waking state with high theta activity corresponds to the attentive and/or psychoactive waking comprising 23% of sleep-wake cycle, while waking without theta activity represents the non-attentive waking or non-motivated motor activities, called quiet or passive wake (PW), comprising 33% of sleep-wake cycle [7]. Theta power is
13
presumably arising from the hippocampus [8]. More than one theta generator as well as more than one type of hippocampal theta activity has been suggested, however, the functional relevance of hippocampal theta activity is still not clear [6, 9].
5.1.2. Non rapid eye movement (non-REM) sleep
As the individual fall asleep, EEG switches to higher amplitude, slower frequency EEG signs (synchronized EEG activity) characteristic of non rapid eye movement (non-REM) sleep. Then, during non-REM sleep, the EEG slows progressively, until the EEG is dominated by high voltage, slow delta waves (0.5-4 Hz frequency, Table1). During this stage, the underlying cellular phenomenon is the slow oscillation (<1Hz), which contains an UP state, characterized by maintained depolarization and irregular neuronal firing, and a DOWN state characterized by silence in firing of cortical cells. Consequently, during non-REM sleep, cortical neurons show a firing pattern prevailed by periods of increased population activity (ON periods) intermitted by shorter periods of generalized silence (DOWN period), referring to the negative phase of EEG slow waves [10, 11].
Depending on the extent of synchronization, non-REM sleep can be subdivided into four stages in human. Stage one (non-REM I) comprises the superficial sleep, characterized by relative low amplitude theta frequency and vertex sharp waves. In stage two (non-REM II) distinctive sleep spindles (augmenting and decrementing waves at 12-14 Hz frequency) and K-complexes appear on the EEG. In stage three (non-REM III) and stage four (non-REM IV), EEG is occupied by delta waves (0.5-4 Hz) in no more than 50% and more than 50% of the EEG record, respectively. The deepest stages, like non-REM III and non-REM IV are also called slow wave sleep (SWS) or delta sleep [12], and recently not considered to be separate stages. Duration of a non-REM sleep bout typically lasts ca. 40-60 minutes in human, and about three-five minutes in rodents. Slow rolling eye movements and decreased tone of somatic musculature is typical. In rats, non-REM sleep is subdivided into two stages: light slow wave sleep (slow wave sleep 1, SWS1) is characterized by the occurrence of slow waves with increasing amplitude, while in deep slow wave sleep (slow wave sleep 2, SWS2), there
14
are spindles with progressively increasing amplitude and number interspersed by high- amplitude, low-frequency cortical slow waves on EEG [7].
5.1.3. Rapid eye movement (REM) sleep
During the switch from non-REM sleep to REM sleep, the slow waves are replaced by high frequency low-amplitude fast, tonically activated EEG signs. REM sleep is characterized by a distinct constellation of tonic and phasic features, namely, atony of skeletal muscles with the exception of breathing- and eye-moving muscles (tonic), and stereotyped bursts of saccadic eye movement, called rapid eye movements (phasic) observable on the electrooculogram. This sleep stage is also called paradoxical sleep due to the presence of an increased cortical activity while the arousal threshold is high. The duration of REM sleep bouts varies with species, age and heath of the individual lasting usually 1.5 h in human vs. 7-13 min in rodents (reviewed in [12-14].
During REM sleep in rodent, a rhythmic theta EEG activity, generated by the hippocampus, is a striking feature on the EEG. In theta activity, two different subtypes have been observed: the Type I (4-7 Hz) theta has been demonstrated under urethane or ether anaesthesia and during behavioural immobility, and was abolished by atropine sulphate, a muscarinic antagonist, while Type II theta (7-12 Hz) has been demonstrated during waking associated with movements and was abolished by urethane. However, during REM sleep, a combination of Type I and Type II theta can be detected [9]. In rats, REM sleep is preceded and sometimes followed by a short stage called intermediate stage of sleep (IS) characterized by high-amplitude anterior cortex spindles and low-frequency hippocampal theta rhythm [15].
In humans, although low frequency (4-7 Hz) theta activity is generated mainly from the hippocampus, the EEG is prevailed by faster and lower voltage cortical frequencies. In contrast to rats, theta in humans was not detected continuously, rather in short (1 sec) periods, moreover, it was not correlated with the occurrence of rapid eye movements [16]. In humans, the IS transitional stage has been identified as part of the non-REM II sleep [12].
15
5.2. The role of brain structures in the regulation of sleep-wake cycle
The regulation of sleep-wake cycle is based on two independent processes: the circadian rhythm and the homeostatic drive [17]. In mammals, the circadian rhythmicity of vigilance is determined by the function of the hypothalamic suprachiasmatic nucleus (SCN), a key pacemaker that translates the light-dark information from the retina into transcriptional and translational feedback loops of clock genes, and regulates behavioural responses with a roughly 24 h period [18]. In homeostatic sleep regulation, the length and depth of sleep is driven by sleep-promoting molecules, such as adenosine, which may accumulate extracellularly as a by-product of cellular metabolism. In other words, if someone is sleep-deprived for a period of time, he/she will have an increase in the subsequent sleep-time to compensate deprivation [2, 14, 19].
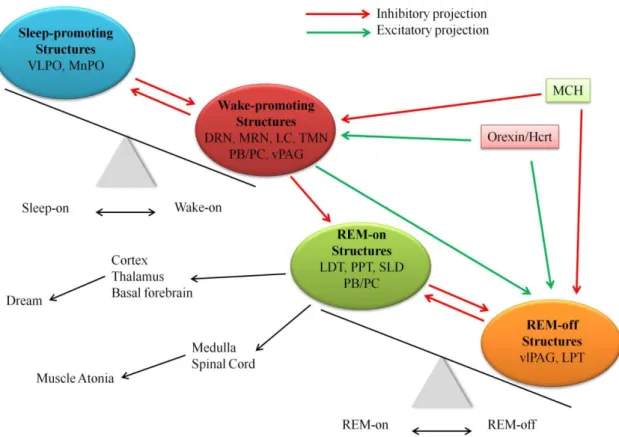
Regarding the transition between different vigilance stages, a mutually inhibitory relationship between sleep- and wake-promoting systems in the brain generates a flip-flop switch that is presumed to allow a sharp transition between sleep and wakefulness [14]. However, a similar switch is thought to regulate the transition between non-REM and REM sleep through the mutually antagonistic relationship of REM-on and REM-off neuronal populations [20] (Figure 2). In the brain, the mutual inhibition is between large populations of neurons, which may also respond to other stimuli at the same time, consequently the transition will take seconds to minutes, depending on the species, and the developing behavioural state is most likely the result of the summed activity across all neurons. However, this switch ensures stable sleep and wake, thus, lesion of a single component of the sleep-wake circuitry can destabilize the sleep switches, as shown by the example of narcolepsy [14, 21].
16
Figure 2. “Flip-flop” model of wake - sleep and REM - non-REM sleep switch, and how this cascade is stabilized by orexin/hypocretin (Hcrt) neurons (based on Saper et al. 2010 [18]). In the regulation of vigilance, the “switch” between sleep and wakefulness (at the upper left) is established by the mutually inhibitory relationship of sleep promoting structures [ventrolateral preoptic area (VLPO), median preoptic nucleus (MnPO)] and wake-promoting structures [dorsal raphe nucleus (DRN), median raphe nucleus (MRN), locus coeruleus (LC), tuberomamillary nucleus (TMN), parabrachial nucleus (PB) and the adjacent precoeruleus area (PC) and the ventral periaqueductal gray matter (vPAG)]. There is an also mutually inhibitory relationship between structures having REM-on- [laterodorsal tegmentum (LDT), pedunculopontine tegmentum (PPT), sublaterodorsal tegmentum (SLD), and PB/PC] and REM-off- [ventrolateral periaqueductal gray matter (vlPAG) and LPT] characteristic (at the lower right). The monoaminergic arousal neurons inhibit the VLPO during wakefulness, but also prevent the generation of REM sleep by inhibiting the REM-on neurons and exciting the REM-off neurons. Thus, the wake-REM sleep transition is practically impossible for normal individuals. In the stabilization of the “flip-flop switch” between non-REM and REM sleep as well as wakefulness, the orexin/hypocretin (Hcrt)- and melanin-concentrating hormone (MCH)-expressing neuron populations, intermingled in the hypothalamus, are considered to have a key role.
17 5.2.1. Brainstem
The importance of brainstem in the regulation of brain state and muscle tone is crucial: its extensive damage can cause coma, a state of unconsciousness and unresponsiveness. In the maintenance of wakefulness, two critical pathways originate from the brainstem (i) the ascending reticular activating system (ARAS) projecting to the thalamus, hypothalamus, basal forebrain (BF), and neocortex being important for cortical activation, and (ii) the descending pathway to the spinal cord being crucial for the maintenance of muscle tone [22] (Figure 3).
The ARAS comprises serotonergic neurons mostly from the dorsal and median raphe nuclei (DRN and MRN, respectively), noradrenergic neurons from the locus coeruleus (LC) and dopaminergic neurons from the area adjacent to the DRN, as well as cholinergic neurons from the pedunculopontine tegmental (PPT) and laterodorsal tegmental (LDT) nuclei. The ARAS also includes histaminergic neurons from the tuberomamillary nucleus (TMN), although this structure is localized in the posterior hypothalamus (PH, see later in section 5.2.4.2). The monoaminergic neurons, including DRN, LC and TMN neurons, show their highest firing rate at wakefulness, low rates during non-REM sleep while they nearly silent during REM sleep [23-25]. The relative small number of noradrenergic neurons in the LC (ca. 1500 in rat) innervates almost the entire CNS [26] and possibly has a role in generating arousal during conditions that needs high level of attention or activation of the sympathetic nervous system [23]. The importance of this structure is shown by the finding that optogenic stimulation of the noradrenergic neurons can lead to immediate awakening [27]. Moreover, noradrenergic release in the cortex is essential for the EEG desynchronization [28] (Figure 3).
The serotonergic neurons of the DRN and MRN project widely to the cortex and subcortical areas, including the BF, thalamus, hypothalamus and the preoptic area (POA). Besides its involvement in the regulation of vigilance, serotonin (5- hydroxytryptamine, 5-HT) has been shown to regulate many other aspects of behaviour such as appetite, mood, aggression and anxiety. Early studies suggested that 5-HT might promote non-REM sleep and possibly REM sleep, however, more recent studies have indicated that serotonin generally induces wakefulness and suppresses REM sleep (reviewed in [29]). In agreement with this role, agonists of the 5-HT1A, 5-HT1B, 5-HT2,
18
or 5-HT3 receptors elevate wakefulness [30-33]. Of clinical relevance, increased extracellular 5-HT concentration can be elicited by the application of selective serotonin reuptake inhibitor (SSRI) antidepressants, like fluoxetine or escitalopram, that agents had been shown to increase wakefulness while suppress REM sleep in both humans and rodents [34-36].
The LDT/PPT cholinergic neurons, comprising one of the two major cholinergic cell populations, send extensive projections to subcortical regions including the thalamus, lateral hypothalamus and BF [37]. In contrast to the monoaminergic components of the ARAS, cholinergic neurons show high firing rate during both wakefulness and REM sleep [38]. Thus, the cholinergic system seems to be linked to cortical EEG desynchronization typical during wakefulness and REM sleep, but not necessarily to behavioural arousal. The impact of the PPT is suggested by the fact that lesion of the cholinergic neurons of PPT causes significant reduction in the amount of REM sleep [39].
Also glutamatergic neurons from the rostral pons, localizing in the parabrachial nucleus and the adjacent precoeruleus area, have been postulated to participate in the maintenance of wakefulness (Figure 3). These neurons have been demonstrated to send projections to the cerebral cortex, BF and the lateral hypothalamus. Although the firing pattern of these neurons have not been investigated yet, studies with the early gene product Fos (see later in section 5.3) have found mostly wake- and REM sleep -active neurons in these regions [14, 20].
5.2.2. Basal forebrain
The cholinergic neurons of the BF give the primary source of cholinergic input to the cortex and the hippocampus, and in line with this, have a role in the cortical desynchronization. These cholinergic neurons, similarly to the LDT/PPT group, show their highest firing rate during wake and REM sleep, while in non-REM sleep their neuronal activity is minimal [40-42]. The BF also contains a large group of neurons that release the inhibitory neurotransmitter γ-aminobutyric acid (GABA), which neurons may activate the cortex by decreasing the activity of inhibitory cortical interneurons [43] (Figure 3). On the contrary, recent data suggest a dual function of BF in the
19
modulation of cortical activation and behavioural state, namely, populations of GABA- ergic BF neurons have been shown to facilitate cortical activation by modulating gamma or theta activity, while other subgroups decrease cortical activation by modulating irregular slow oscillations that normally occur during SWS [44].
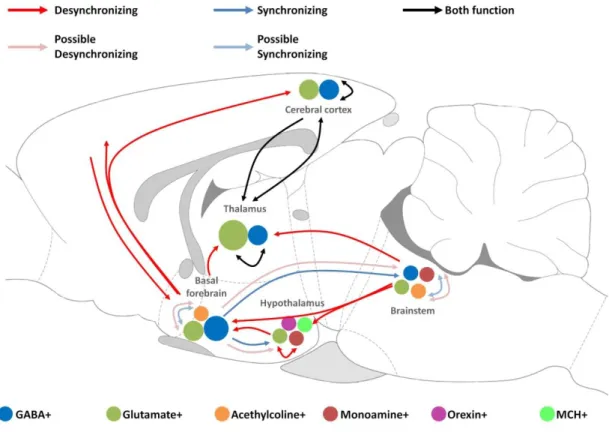
Figure 3. Schematic drawing illustrating the key circuits involved in the regulation of sleep and wakefulness in rat brain. Red and blue arrows indicate the major pathways of cortical desynchronization and synchronization, respectively. Black arrows demonstrate pathways that mediate both synchronization and desynchronization.
Possible pathways of desynchronization and synchronization are shown by light red and light blue arrows, respectively. Different cell types are illustrated by coloured circles in each brain areas. Abbreviations: GABA: gamma-aminobutyric acid, MCH: melanin- concentrating hormone (Based on Lee et al., 2012) [45].
5.2.3. Thalamus and cortex
Thalamus comprises the gateway of sensory input to the cortex and can directly influence state of the cortex. The highly interconnected thalamocortical, thalamic reticular and cortical neurons comprise the thalamocortical loop which has a crucial role
20
in setting the global brain state and in regulating the flow of sensory information [46, 47]. Thalamic neurons show distinct modes of firing in different vigilance stages demonstrating tonic spiking in alertness and rhythmic bursting in drowsiness or non- REM sleep [48]. Delta oscillation and spindles are generated in sleep or drowsiness by the intrinsic properties of the thalamocortical and thalamic reticular neurons and through their synaptic interactions [48]. Thalamus receives strong input from the ARAS and the BF [37, 49] comprising the major pathway through which the neuromodulatory system can influence cortical function [45] (Figure 3).
Cortical neurons can also influence the global state of the brain. In non-REM sleep, slow oscillations originate in the cortex [10], and cortico-cortical connections are sufficient for the synchronization of the oscillations across different brain areas [50].
Notably, in anesthetized rat, high-frequency burst firing of a single cortical neuron has been found to be sufficient to induce transition in the global brain state, either from a synchronized to desynchronized state or vica versa [51]. Cortical neurons are highly interconnected with thalamic neurons and can also exert strong influences on the global brain state. Neurons from the prefrontal cortex provide strong descending inputs to the neuromodulatory circuits in the BF [52]and the brainstem [45, 53]
5.2.4. Hypothalamus
The role of hypothalamus in the regulation sleep and wakefulness was first hypothesized during the epidemic encephalitis letargica around the time of the First World War by Constantin von Economo, who reported lesions in the preoptic region around the rostral end of the third ventricle in patients suffering from profound insomnia. A smaller part of patients suffering from encephalitis letargica showed opposite symptoms: they became insomniac and slept only for a few hours each day despite being extremely tired. These patients had lesions in the anterior hypothalamus and basal ganglia [54]. Recently, the crucial role of the hypothalamus in the regulation of sleep and wakefulness has been rediscovered, shifting the focus away from the thalamocortical system and the brainstem. As a key integrator centre of the brain, the hypothalamus expresses several neuropeptides and transmitters to synchronize the regulation of basic physiological functions of the body, like food intake, temperature,
21
energy homeostasis, stress response and reproduction with the circadian pacemaker of the body as well as the sleep-wake cycle [55].
5.2.4.1. The preoptic area
In the POA, two neuronal populations have been identified as sleep-promoting structures: the ventrolateral preoptic area (VLPO) and the median preoptic nucleus (MnPO) [56, 57]. The key property of VLPO neurons, that they have reciprocal innervations with several components of the ARAS, including DRN and adjacent ventral periaqueductal grey matter (vPAG), TMN, LC and parabrachial nucleus [20, 58]. The dense core of the VLPO innervates the histaminergic TMN, and includes GABA- and galanin neuropeptide-containing neurons that show their highest firing rate during non-REM sleep. However, a more diffuse population of VLPO, the extended VLPO, innervates DRN and LC [59, 60]. Cell-specific lesions of the VLPO core correlated most closely with non-REM sleep decrease, while the cell loss of the extended VLPO correlated rather with the decline of REM sleep [60]. The major input of VLPO is provided by the MnPO that contains mostly sleep-active GABAergic neurons that do not contain galanin [58, 61]. In contrast to VLPO, the neurons of which increase firing rate during sleep just from sleep onset, neurons of MnPO often fire in advance of sleep, suggesting a role in accumulating sleep pressure [61]. The mutual inhibition between sleep-active neurons of VLPO-MnPO and the ARAS-lateral hypothalamus led to the proposal of a flip-flop model (see in chapter 5.2, Figure 2) for sleep-wake switches [14].
5.2.4.2. The posterior hypothalamus
The involvement of PH was postulated by the early experiments of Nauta [62]
who demonstrated that large posterior hypothalamic lesions led to a continuous sleep- like state. Further research identified two arousal-related neuronal populations in the PH: a histaminergic cell group in the TMN [63] and an orexin/hypoctretin neuropeptide-containing cell population in the perifornical hypothalamic area (PFH, perifornical area and lateral hypothalamus).
Similarly to the monoaminergic components of ARAS (see before), histaminergic TMN neutrons show their maximal firing rates in wakefulness, though
22
silent during non-REM sleep [63, 64]. Many TMN neurons discharge robustly also during REM sleep suggesting a possibly stronger correlation with EEG desynchrony than with wakefulness itself. In line with this, axons from TMN neurons target predominantly the lateral hypothalamus, BF and the cerebral cortex, where they terminate, particularly in the prefrontal cortex [65]. Histaminergic TMN neurons, influence sleep-wake state through reciprocal interactions with sleep promoting systems in the anterior hypothalamus [66], BF and brainstem arousal systems.
5.2.4.3. The lateral hypothalamic area
The lateral hypothalamic area (LH), being an important integrator region of the brain, has been implicated in a wide variety of functions, such as energy homeostasis, regulation of motor activity as well as motivation and reward [67]. A growing body of evidence sustains the role of this area with the PH as a key centre in the regulation of vigilance [68-70]. The impact of LH in the regulation of sleep-wake cycle is shown by the fact that reversible inactivation of this area, using muscimol a GABAA agonist, completely abolishes REM sleep [71]. Moreover, neurons showing REM-specific firing pattern have been recorded from this area.
In the lateral hypothalamus and the adjacent perifornical area (PFA), just dorsal and rostral to the TMN histaminergic cell population, another arousal-related neuronal system has been identified, namely the orexin/hypocretin (Hcrt) neuropeptide-producing neurons. Hcrt neurons are essentials for the maintenance of waking, showing their highest firing rate during wakefulness, decreasing their activity in non-REM sleep, and being almost silent in REM sleep [72]. Partly intermingled (although not co-expressing) with the Hcrt neurons in the LH and PFA, the melanin-concentrating hormone (MCH)- containing neurons are localized [73, 74] playing an opposite role in the regulation of sleep-wake cycle promoting sleep, particularly REM sleep [72, 75-77]. For the connection between MCH and Hcrt neurons and their innervations, see Figure 4.
Notably, MCH and Hcrt neurons send parallel projections innervating almost the entire CNS, including the cortex, amygdala, hippocampus, nucleus accumbens, thalamus, hypothalamus, ventral tegmental area (VTA), LDT/PPT nuclei, raphe nuclei and LC suggesting common, integrative roles in the central regulation of vigilance, food intake and energy expenditure [70, 73, 78-80]. All MCH-containing neurons express a relative
23
novel neuropeptide, the nesfatin/NUCB2, identified in 2006 [81], however, the role of this peptide in the regulation of sleep-wake cycle had not been investigated until the beginning of our experiment.
Figure 4. Schematic illustration of the connection between the orexin/hypocretin (Hcrt) and the melanin-concentrating hormone (MCH)-containing neurons and their innervations. MCH neurons contain gamma-aminobutyric acid (GABA), cocaine-amphetamine-regulated transcript (CART), nesfatin and endocannabinoids, while Hcrt neurons express neuronal activity regulated pentraxin (Narp), dynorphyn and glutamate. In the interaction between MCH and Hcrt neurons, MCH neurons inhibit Hcrt neurons, while the influence of Hcrt neurons on MCH neurons can be excitatory or inhibitory. Abbreviations: noradrenaline (NA), serotonin (5-HT), acetylcholine (Ach), dopamine (DA), neuropeptide Y (NPY), corticotropin releasing factor (CRF). Red and green arrows show inhibitory or excitatory innervations, respectively, while yellow arrow means that both inhibitory and excitatory connection can be present. Based on Konadhohe et al., 2014 [82].
24 5.2.4.3.1. The hypocretins /orexins
The orexin A and B, also called hypocretin-1 and 2 (Hcrt) have been discovered by two groups independently [83, 84]. The term hypocretin (i.e. hypothalamus-specific secretin-like peptide) comes from the fact that Hcrt-positive neuronal somata have been reported only in the PFH [83], while the term orexin emphasizes their obvious role in the appetite regulation [84]. The importance of the Hcrt system in the sleep-wake regulation was suggested by the discovery of decreased expression of Hcrt peptides and Hcrt receptors in the background of narcolepsy both in humans and dogs [85, 86].
Additionally, narcolepsy-like phenotype has been reported in Hcrt knock-out mice [87]
and in rats with specific Hcrt-directed neurotoxic lesions [88]. Narcolepsy is characterized by the inability to sustain wakefulness, frequent state transitions and inappropriate intrusions of REM sleep-related phenomena (i.e. motor atonia) during wakefulness, suggesting the specific function of Hcrt neurons in ensuring the stability and maintenance of non-REM and REM sleep as well as wake stages [14]. Additionally, central administration of Hcrt has been shown to elevate wake and decrease non-REM and REM sleep [89], and blockade on Hcrt receptors promotes both non-REM and REM sleep at the expense of wakefulness [90]. This relative small neuron population (ca. 6700 neurons in the rat brain) [76] gives excitatory projections to all other arousal- and wake-related cell groups, including the cholinergic neurons in the BF, the histaminergic cells in the TMN as well as cholinergic and aminergic cells in the brainstem [91], suggesting the wake-executive property of Hcrt neurons in the regulation of vigilance [92]. Hcrt 1 and 2 are neuro-excitatory peptides, and binding to specific receptors (Hcrt-1R and Hcrt-2R) evoke excitatory post-synaptic effects when released from the glutamatergic Hcrt-neurons [78, 93]. In addition, nearly all Hcrt neurons also contain the neuropeptide dynorphin [94].
5.2.4.3.2. The melanin-concentrating hormone (MCH)
MCH is a 19-amino acid peptide, with a conservative structure that is identical in all mammals examined to date, including rabbits, rats, mice, and humans [95].The MCH-expressing neuronal population (ca. 10,000-12,000 in the rat brain), localizing in the zona incerta/subzona incerta (ZI), LH and the PFA [73]. A small number of MCH- containing neurons have also been demonstrated in the pontine reticular formation and
25
the olfactory tubercle in rat, as well as in the LDT and POA of female and lactating rats, respectively [73, 96, 97]. MCH-containing fibres are in close relationship with Hcrt neurons and vice versa, moreover, hypocretinergic receptors are present on MCH neurons, suggesting reciprocal synaptic contacts between MCH and Hcrt neurons as well as an important functional interaction between the two systems [98, 99]. Earlier studies have reported that Hcrt neurons increase MCH mRNA expression, directly exciting MCH neurons as well as elevating glutamate release onto them [75, 100].
However, recent optogenic data show that firing of Hcrt neurons exerts inhibitory effect on most MCH neurons via GABAA receptors, while bath-applied Hcrt caused excitation only in a minority of MCH neurons (Figure 4), providing evidence for a GABAergic microcircuit that, by a potential feed-forward loop, may stabilize the switch between sleep and wakefulness [101]. On the contrary, MCH neurons exert a unique inhibitory effect on hypocretinergic signaling as a way to fine-tune the output of these neurons [102] (Figure 4). To date, two receptor of MCH have been identified, the MCHR1 and MCHR2 that show 38% sequence homology [103, 104]. While binding of MCH to MCHR1 activates diverse intracellular signaling pathways by coupling to Gi, Gq and G0 proteins, MCHR2 is known to couple only to Gq [104, 105]. Similarly to centrally administered Hcrt, intracerebroventricularly (icv)-injected MCH has been demonstrated to stimulate feeding [84, 106]. Targeted deletion of either the MCH gene or melanin- concentrating hormone MCH1 receptor in mice led to hypophagic lean mice [107], while overexpression of the prepro-MCH resulted in obese mice [108]. Moreover, non- peptide MCHR1 antagonist has been found to abolish the MCH-induced feeding behaviour and diminished body weight [109].
Beyond the involvement of MCH in food intake, additional physiological evidence suggests its role in the regulation of sleep and wakefulness (reviewed in [110, 111]. While Hcrt neurons have a critical role in the maintenance of wakefulness, MCH neurons increase their firing rate during slow wave sleep (SWS) and show their maximal firing rate in REM sleep [72]. The implication of MCH in sleep-regulation is strengthened by the fact that centrally administered MCH elevated the time spent in REM sleep (~200%), and to a lesser degree, the amount of SWS [112], moreover, MCHR1 antagonists dose-dependently decreased SWS2, IS as well as REM sleep, while active and passive wake have been found to increase [113]. In addition,
26
optogenic activation of MCH neurons promotes REM sleep [114]. Interestingly, regarding the function of MCH-containing neurons, the action of MCH neuropeptide does not seem to be as important as GABA release from these neurons, causing inhibitory post-synaptic effect [70, 114].
In accordance with its role in promoting sleep, activity of MCH-containing neurons is regulated by components of the wake-promoting system. Namely, MCHergic neurons are hyperpolarized by noradrenaline (NA), serotonin, acetylcholine [100], while dopamine reduces the excitability of MCH-containing neurons by decreasing the membrane resistance without modifying the resting potential [115] (Figure 4).
Cannabinoids, being sleep-promoting neuromodulators, increase the firing rate of MCH-containing neurons by decreasing the activity of nearby GABAergic neurons via CB1 receptors [116].
In the MCH-containing cells, MCH is generated by the cleavage of the prepro- MCH precursor, which contains other neuropeptides besides MCH, such as neuropeptide EI (NEI) and neuropeptide GE (NGE) [73]. In addition to prepro-MCH- derived neuropeptides, other neurotransmitter and neuromodulators have been demonstrated to co-localize with MCH, like the anorexinergic cocaine- and amphetamine-regulated transcript (CART). In the ZI and the lateral hypothalamus of rat, 95% and 70% of the MCH-containing neurons co-express CART, respectively [117]. The MCH population, based on the CART positivity, can be separated functionally into two MCH subpopulations, namely, (i) the CART co-localizing MCH neurons sending ascending projections toward the septum and hippocampus, whereas (ii) the non-CART MCHergic neurons send descending projections toward the brainstem and spinal cord [118].
Considering physiological functions, MCH possesses an integrative role in energy conservation by decreasing metabolism and promoting sleep as well as food intake. In line with this, MCH reduces heart rate, temperature and metabolic rate by central actions, namely, it elevates the parasympathetic/sympathetic rate and diminishes the release of thyroid hormones [95]. The MCHergic system is thought to play a crucial role in special cases, when the energy conservation is indispensable. One example is hibernation, when the metabolism of the body decreases to 1-2% of the basal level.
27
Notably, the entrance to this stage is via SWS [119]. Another example is lactation, when activity of the MCHergic system is suggested to be high [111]. In lactation period, MCH expression in the medial preoptic area, a crucial region in the maternal behaviour, is very high [97]. Interestingly, milk ejection is preceded by EEG synchronization, and lactation period is accompanied by somnolence in rats [120]. In lactating humans also the increase of SWS has been reported [121].
According to preclinical studies, dysfunction of the MCH-system can be associated with many pathophysiological conditions. Shimida et al. [107] have reported that prepro-MCH knockout mice are anorectic and lean, while over-expression of MCH leads to obesity [108]. Wermter at al. have found association between single-nucleotide polymorphism in the MCHR1 gene and obesity investigating German children and adolescence [122]. Consequently, antagonists of the MCHR1 could be a potential therapeutic target in the treatment of obesity [123]. In addition, the involvement of MCH has also been suggested in the inflammatory processes of the intestine [124].
Regarding neuropsychiatric disorders, MCH evokes predominantly depression- like effect when injected into the DRN, while immunoneutralization of MCH had an antidepressive effect [125]. Similarly, antagonists on the MCHR1 evoked antidepressant effects in several model of depression and anxiety [109]. In line with its pro-depressive effect, MCH promotes the occurrence of REM sleep in animal studies [112], which sleep alteration is considered a characteristic feature in major depression disorder [35].
Taken together the above mentioned facts, MCHR1 antagonist can be potential drug targets in the treatment of depression and anxiety in the future.
Recent results has also associated MCH with the pathomechanism of narcolepsy.
Bergman et al. have identified an autoantibody in the sera of a group of narcoleptic patients that showed a selective binding to MCH/proopiomelanocortin (POMC) in the hypothalamus, and this autoantibody, when injected centrally, altered the sleep pattern of rats similarly to the effect of MCHR1 antagonists [21].
5.2.4.3.3. The nesfatin-1/NUCB2
The 82-amino acid nesfatin-1 protein is the posttranslational product from the cleavage of the prohormone NEFA (for DNA binding/EF-hand/acidic protein)
28
/nucleobinding-2 (NUCB2). The structure of nesfatin-1/NUCB2 (nesfatin), showing 85% homology, is highly conserved among mammalian species. The NUCB2 polypeptide, composed of 396 amino acids, is preceded by a 24-amino acid signal peptide, which protein consists of an N-terminal signal peptide, a Leu/Ile rich region, a DNA-binding domain, a nuclear targeting signal, two Ca2+-EF-hand motifs and a leucine zipper domain [126]. The suspected major fragments of processing are the nesfatin-1 (spanning residues 1-82), nesfatin-2 (residues 85-163) and nesfatin-3 (residues 166-369) [81]. Nesfatin-1 molecule consists of three domains: the N-terminal (N23), the middle part (M30) and the C-terminal (C29). Among these parts, the M30 active core seems to play the key role in physiological effects of nesfatin [81].
Nesfatin has been suggested to influence cross-binding of its presumptive receptor with various types of G protein, initially activating Gi, followed by the activation of Gs protein, although its receptor(s) has/have not been cloned yet [127].
Nesfatin has a wide distribution in the CNS, such as in the forebrain, the hindbrain, the brainstem and the spinal cord. Using immunohistochemistry (IHC), the largest nesfatin- immunoreactive (IR) population has been localized in the PFA and the lateral hypothalamus including the dorsolateral hypothalamus (DLH) and the ZI. In the hypothalamus, nesfatin-containing neurons can also be detected in the arcuate, paraventricular (PVN) and supraoptic nuclei (SON). The anterior and intermediate pituitary host a substantial number of nesfatin-positive neurons as well. Regarding areas outside the hypothalamus, nesfatin-IR neurons have been detected in the piriform and insular cortex, endopiriform and central amygdaloid nuclei, lateral septum, bed nucleus of the stria terminalis, medial preoptic area, raphe and ambiguous nuclei, ventrolateral medulla and gigantocellular reticular nucleus as well as the Purkinje cells in the cerebellum. Nesfatin-IR neurons have also been detected in the spinal cord in both sympathetic and parasympathetic preganglional neuronal groups, originating from thoracic, lumbar and sacral segments [126, 128-131].
In the LH, nesfatin is co-localized with several neuropeptides, like POMC, corticotrophin-releasing hormone (CRH), CART, neuropeptide Y (NPY), oxytocin and vasopressin [131, 132], as well as with neurotransmitters, like serotonin and NA. In the DLH and ZI, all MCH-containing neurons co-express nesfatin, and only a small portion
29
of nesfatin-IR neurons are MCH-negative [128]. In hypothalamic nuclei, nesfatin is also co-localized with a most recently identified peptide, the phoenixin (PNX) that shows a similar distribution like nesfatin [133]. Most of the above mentioned neuropeptides have also been involved in the regulation sleep-wake cycle, besides other roles, like stress-response or feeding, suggesting their integrative role in basic physiological functions.
Initial functional and neuroanatomical studies have supported the role of nesfatin as a satiety molecule. Central administration of the peptide has been shown to depress nocturnal food intake in rats in a dose-dependent manner. However, neither nesfatin-2 nor nesfatin-3 possesses this anorectic effect. Additionally, chronic icv infusion of nesfatin has been demonstrated to reduce body weight gain and the amount of white adipose tissue in rats [81, 130]. Beyond regulating food consumption, accumulating evidence proves that nesfatin plays an important role in the regulation of other physiological functions, like body temperature [134], blood pressure via the hypothalamus melanocortin 3/4 receptor (reviewed in [135]), operation of the reproductive axis [136], moreover, nesfatin has an anti-hyperglycaemic effect by regulating hepatic glucose production [137]. Nesfatin has also been involved in anxiety- and stress-related responses [138-141]. Acute 30-min restrain stress, involving physiological and physical stress components, has been shown to induce the activation of nesfatin-containing neurons in the PVN, SON, LC, ventrolateral medulla, NTS, DRN and rostral Raphe pallidus, although this relatively strong neuronal activation was not accompanied by an increased nesfatin level in the plasma [142, 143]. Another study has reported that icv administration of nesfatin-1 elevated the circulating level of adrenocorticotropin (ACTH) and corticosterone, indispensable elements of the hypothalamus-pituitary adrenal axis (HPA), suggesting the HPA-stimulating effect of nesfatin, moreover, bilateral adrenalectomy increase the expression of NUCB2 mRNA in the PVN [139] [143]. These data postulate nesfatin as a potential new player in the stress adaptation response, and thus, suggest the role of nesfatin in the pathology of stress-associated mood disorders, like anxiety and depression [141].
Anxiety is obviously a stress-related disorder, however, it has a profound effect on feeding behaviour as well [144]. The first evidence for the involvement of nesfatin in
30
anxiety has been demonstrated by Merali et al., indicating that icv administered nesfatin dose-dependently enhances anxiety- and fear-related behaviours in rat, as shown by different behavioural tests assessing the innate anxiety response and the conditioned fear response, through the activation of the melanocortin pathways [138] possibly inhibiting GABAergic neurons or hyperpolarizing NPY neurons in the nucleus arcuatus [145].
Nesfatin has also been associated with depression, that is, similarly to anxiety, also a common stress-related pathophysiology in humans with two-times higher incidence in women [146]. Ari et al. have reported a two-fold increase in plasma concentration of nesfatin in patients with major depressive disorder without any difference between genders [147]. In agreement with this, almost two-times higher NUCB2 mRNA level has been found in post mortem samples of rostroventral midbrain punches including the Edinger-Westphal nucleus of depressed suicide victims, compared to controls. In contrast to men, in female suicide victims, the expression was three-times lower, compared to female controls. Noteworthy, that basal expression of NUCB2 mRNA did not differ between males and females [148]. These finding suggest that nesfatin may play a role in the sex-specific pathobiology of depression. However, due to the limited number of studies, the causality has not been established yet [141].
From a clinical point of view, nesfatin can be a potential drug target in the treatment of depression or anxiety as well as metabolic disorders and obesity, particularly for patients taking antidepressive and antipsychotic medications, as resistance to leptin or some adipokines in these patients are common [149]. Another promising clinical application of nesfatin can be its use as a biomarker in epilepsy, since positive correlation has been found between nesfatin level in body fluids (plasma, saliva) and the course of epilepsy [150].
5.3. Fos expression as an indicator of neuronal activity
In neurobiology, Fos (also called c-Fos) protein, the product of one of the immediate early genes (IEGs) c-fos, is a widely used, reliable functional anatomical marker to visualize neuronal activity in the CNS. The expression of c-fos induces Fos
31
protein synthesis that returns to the nucleus after synthesis and acts as a transcription factor to regulate the expression of other genes. Synthesis of the Fos protein is induced in response to several extracellular signals such as growth factors, neurotransmitters (with the exception of GABA and gylcine), neuromodulators, drugs, thermal, visual and somatosensory stimuli [151, 152], while its level is low in the brain under basal conditions. Thus, the expression of c-fos (mRNA or the Fos protein) can be visualized by combining with various markers, including neuropeptides, proteins or retrograde tracers, etc. The expression of c-fos mRNA is induced in 20 minutes after stimulus, whereas the accumulation of Fos protein requires up to a 90-minute period [151, 153].
High levels of Fos protein are generally observed for hours and then decline progressively [154]. For instance, Fos protein reaches its peak level in the SCN in one- two hours after a five-minute light pulse and disappears within six hours [155]. Fos- induction is more effective when the stimulus is novel or when applied following a period of deprivation [151].
32
6. Objectives
Hypothalamus, the key integrator area of several physiological functions in the brain, has a crucial role also in the regulation of sleep. Thus, the role of neuron populations expressing different neuropeptides in the regulation of sleep-wake cycle is an intensively investigated area with countless new questions.
Several data support the role of MCH in the regulation of sleep, besides other important physiological functions [99, 110, 112, 118]. Former data from our laboratory showed a positive correlation between the time spent in REM sleep during ‘REM sleep rebound’ and the activation of MCH-containing neurons [77], although it was not investigated how the MCH populations of different hypothalamic structures respond to
‘REM sleep rebound’. It was also pending if an increased serotonergic-tone, known to suppress REM sleep even during the ‘REM sleep rebound’ is able to modify the activation of MCH neuron populations.
To examine this question, we applied a selective REM sleep deprivation followed by ‘REM sleep rebound’ to provoke increased neuronal activation of hypothalamic structures possibly involved in the regulation of REM sleep, parallel with the robust elevation in REM sleep. Neuromorphological examination of the brains enabled us to visualize the altered activation of different neuron populations as a result of ‘REM sleep rebound’.
All hypothalamic/thalamic MCH neurons co-express nesfatin-1/NUCB2 (nesfatin), the neuropeptide that has an opposite effect on many physiological functions, however, a relative smaller population of hypothalamic nesfatin-positive neurons does not contain MCH. As no literature data was available about the role of nesfatin in the regulation of vigilance, we aimed to investigate this issue using immunohistochemistry and electrophysiology.
33
Based on the above mentioned aspects, our aims were the followings:
1. We intended to investigate if ‘REM sleep rebound’ causes any difference in the activation of MCH neurons of different hypothalamic/thalamic nuclei, such as ZI, LH and PFA.
2. Considering that escitalopram, the extracellular serotonin level-increasing antidepressant, suppresses REM sleep, even during ‘REM sleep rebound’, how escitalopram treatment influences the neuronal activation of MCH-neuron population during ‘REM sleep rebound’ in the investigated hypothalamic/thalamic nuclei?
3. How the activation of the hypothalamic/thalamic nesfatin-positive neuron population is influenced by REM sleep deprivation and the following ‘REM sleep rebound’? Is there any difference between the activation of MCH-positive and -negative nesfatin–
neuron populations in different hypothalamic/thalamic nuclei?
4. How the exogenously (icv) administered nesfatin-1 peptide injected in the passive phase affects the architecture of sleep-wake cycle?
5. Does the icv injected nesfatin-1 alter the quantitative EEG spectra of different vigilance stages in passive phase?
6. Is there any similarity in the EEG spectral effect of icv-injected nesfatin-1 vs. 2 or 10 mg/kg escitalopram, suggesting a possible serotonergic component in the action of nesfatin-1 on vigilance?
34
7. Materials and methods 7.1. Housing of the animals
Experiments and housing conditions were performed according to the international regulations [European Communities Council Directive of 24 November 1986 (86/609/EEC)] and the “Principles of Laboratory Animal Care” (National Institute of Health). All experiments were approved by the National Scientific Ethical Committee on Animal Experimentation, and permitted by the government (Food Chain Safety and Animal Health Directorate of the Central Agricultural Office, Permit Number:
22.1/1375/7/2010).
Male Wistar rats (from the Semmelweis University, Animal Facility, Budapest, Hungary) weighing 300–350 g were used. Animals were kept under controlled environmental conditions, with light-dark cycle of 12:12 h (10:00 A.M.-10:00 P.M, daylight type fluorescent tubes, 18 W, approximately 300 lx) at room temperature (21±1°C), and had free access to standard rodent chow and tap water. Animals were habituated to the conditions in the experimental room at least for two weeks. All efforts were made to minimize pain and suffering during the experiments.
7.2. Neuromorphological studies: Experiment 1 and 2
7.2.1. REM sleep deprivation (flower pot) method
For REM sleep deprivation in Experiment 1 and 2, we used the classic flower pot (platform on water) method set up earlier in our laboratory [112, 156, 157]. Briefly, animals were placed onto small round platforms (=6.5 cm, called ‘small pot’) situated in the middle of a round water tank (=41 cm) for 72 h, at lights on. The surface of the platform was 0.5 cm above the water level. The control rats were kept single undisturbed in their single home cages (‘HC controls’). As lack of the muscle tone is typical in REM sleep, animals on the platforms fall into the water immediately as they switch to REM sleep. Following the 72h-long deprivation, one group of the animals had
35
been replaced into their singe cages and kept undisturbed for a 3h-long ‘REM sleep rebound’.
Rats on the platforms were fed ad libitum without restriction using a waterproof food supplier unit at a distance easy to approach. Body weight change and food intake of rats during the time spent on the platforms were measured.
7.2.2. Immunohistochemistry (IHC)
Following the procedure, rats anesthetized with sodium pentobarbital (Nembutal, 35 mg/kg, i.p.; CEVA-Phylaxia) were sacrificed by transcardial perfusion using 4% paraformaldehyde in 0.1 M phosphate buffered saline, pH = 7.4 (PBS). Fixed tissue was postfixed at 4 °C overnight and cryoprotected in 20% sucrose in 0.1M phosphate buffer pH = 7.4 (PB) overnight before freezing. Then, hypothalami were cut into 50-μm-thick serial coronal sections on a frigomobile (Frigomobile; Reichert-Jung, Vienna, Austria) for immunohistochemical procedure.
The morphometrical analysis in Experiment 1 and 2 was performed in the following hypothalamic areas (Paxinos and Watson 2007):
zona incerta/subzona incerta (ZI)
lateral hypothalamic area (LH)
perifornical area (PFA)
7.2.2.1. Experiment 1. - MCH/Fos double immunostaining and morphometry analysis First, sections were permeabilized with 0.5 % Triton X-100 for 1 h. The endogenous peroxidase activity and the nonspecific antigen binding sites were blocked with the incubation of the sections in 3 % hydrogen-peroxide solution and in 10%
normal goat serum for 15 min and for 1 h, respectively. For immunostaining, solutions were dissolved in PBS and the primary antibodies were applied for 2 days at 4 °C; all the other incubations were performed at room temperature for 1h. Between the incubation steps, sections were washed for 3×10 min in PB.
Following these steps, the sections were incubated in rabbit anti-Fos (1:30,000, in PB; Santa Cruz Biotechnology, Inc., Heidelberg, Germany) primary antibody, and then in biotinylated goat anti-rabbit IgG (1:1,000) and in avidin–biotin–peroxidise
36
complex (ABC, 1:500) for 1 h in both solutions (both from Vector Laboratories, Burlingame, CA, USA). The immunostaining was visualized by nickel-enhanced diaminobenzidine (NiDAB) chromogen resulting in a dark-blue reaction product. Then, MHC immunostainings were performed in the same way as the first one, but in this case using rabbit anti-MCH as primary antibody (1:10,000 in 3 % BSA/0.5 % Triton X-100 from Phoenix Europe GmbH, Karlsruhe, Germany) and DAB, with chromogen resulting a brown reaction product. Finally, the sections were collected on gelatin-coated slides, dehydrated, and mounted with DPX Mountant (Sigma-Aldrich, Budapest, Hungary) mounting medium.
During the morphomety analysis, we determined the quantity of total number of the MCH-immunoreactive (MCH-IR or MCH-positive) neurons and the total amount of the Fos-immunoreactive (Fos-IR or Fos-positive) nuclei as well as the total amount of the MCH/Fos double positive neurons bilaterally in the areas of interest. For that we used at least five 50-μm-thick coronal sections per animal between bregma −2.5 and
−3.5 mm caudally to bregma using a Visopan microscope (No. 361977; Reichert, Austria). In each section, four randomly selected non-overlapping areas were quantified (0.64 mm2 altogether) under a 40× objective by the same observer in all cases. Finally, the number of cells was calculated to cells per square millimeter values. For further analysis, we calculated the ratio of the activated (Fos-positive) portion of the MCH- immunoreactive (MCH-IR or MCH-positive) neurons, namely the percent of the MCH/Fos double positive neurons.
7.2.2.2. Experiment 2. - MCH/nesfatin/Fos triple immunolabeling and morphometry analysis
The starting steps of this immunostaining was performed similarly to Experiment 1, including blocking the endogenous peroxidase activity and non-specific binding sites (here in 1% BSA), increasing permeability of the cell membranes and diluting primary and other antibodies. Sections were washed 3×5 min in PBS following each incubation step. To block peroxidase enzyme used for visualization previously, and to prevent species cross-reactions caused by primary antibodies raised in the same hosts, sections were microwave-treated in 0.1 M citric-acid (pH = 6.0) for 5 min after each immunostaining [158]. Fos immunostaining was performed using rabbit anti-Fos primary antibody (1:30,000, Santa Cruz Biotechnology, Inc., Santa Cruz, CA, USA)
![Table 1. Basic EEG rhythms and the typical vigilance stages where the rhythms are most frequently occur in human and rat [8, 11, 12]](https://thumb-eu.123doks.com/thumbv2/9dokorg/1370815.112284/12.892.119.757.192.566/table-basic-rhythms-typical-vigilance-stages-rhythms-frequently.webp)