Effects of chronic escitalopram treatment on vigilance and quantitative EEG following REM-deprivation
and acute dosing of a 5-HT
2Creceptor antagonist
Ph.D. thesis
Diána Kostyalik
Semmelweis University
Doctoral School of Pharmaceutical Sciences
Supervisor: Dr. László Tóthfalusi, Ph.D.
Consultant: Dr. GyörgyBagdy, D.Sc.
Official reviewers: Dr. LászlóKöles, Ph.D.
Dr. IstvánHernádi, Ph.D.
Head of the Final Examination Committee:
Dr. ZoltánRihmer, D.Sc.
Members of the Final Examination Committee:
Dr. Al-Khrasani Mahmoud, Ph.D.
Dr. Rita Jakus, Ph.D.
Budapest
2015
1
1 Introduction
1.1 Sleep-wake cycle and theta oscillations
Electroencephalography (EEG) measures the difference between electrode potentials which originates from the summarized electrical activity of numerous, synchronously firing neurons located perpendicularly to the cortex.Electric signals of the rodent brain can be detected by electrodes implanted epidurally into the skull. Sleep can be divided into REM (rapid eye movement) and non-REM (NREM) sleep.
REM phase is characterized by the complete atonia of skeletal muscles;
hippocampal theta oscillations dominate on cortical EEG recordings in rodents. Theta waves are also frequent during wakefulness related to different mnemonic functions in humans, and during exploratory locomotor activity in rodents. Sleep-wake regulation is a very complex process, in which several neuronal systems are involved.Theserotonergic neurons fire most actively during wakefulness, decrease their activity during NREMS and fall silent during REMS. The relationship between wake- and sleep-promoting neurons appearsto be mutually inhibitory, if either side obtains a small advantage over the other; it turns the neurons off on the other side.
Transitions occur rapidly but not instantly, due to the large number of neurons; the time taken varies with species and complexity of the brain.
The balance between mutual inhibitions is influenced mainly by circadian and homeostatic factors.One of the most important properties of sleep-wake regulation is to ensure the stable state of sleep and wake.
1.2 Sleep and depression
Sleep disturbances are typical symptoms of depression. Sleep fragmentation and insomnia occur frequently, and the latter can be not only a symptom of, but also a risk factor for depression. So, this indicates a strong bi-directional relationship between the patomechanism of insomnia and depression. Furthermore, enhanced REM sleep pressure, namely increased time spent in REM andreduced REM sleep latencyare also characteristic symptoms of depression. Most antidepressant drugs decrease REM sleep, and REM sleep deprivation may alleviate the symptoms of depression. In order to maintain the
2
antidepressant effect of REM sleep deprivation, the therapy has to be applied for several days or weeks, which latency is the same as the one during antidepressant drug therapy; the adaptation of 5-HT1A receptors is supposed to be in the background of the therapeutic potential. Several serotonergic antidepressants and the 5-HT1A agonist pindolol enhanced the therapeutic effect of sleep deprivation and attenuated the occurrence of relapses following rebound sleep. Unfortunately, the mood improvement is only transient; relapseoccurring with the first episode of sleep is associatedwith high REM sleep pressure. In conclusion, REM sleep dysregulation may have a crucial role in the patomechanism of depression, however, its precise mechanism of action is still unknown.
According to the reciproc interaction hypothesis, depression is caused by the enhanced cholinergic sensitivity, by the cholinergic-aminergic imbalance, which may explain the REM sleep pressure. Additionally, it might be a rationale for the mood improvement after REM deprivation, since the elongation of wakefulness may prevent the cholinergic dominance during the night, and increase the monoaminergic activity inthe morning. In spite of the positive therapeutic effect, REM deprivation is not an adequate method in clinics, as it is difficult to carry on and its effect is not certain and only transient. Sleep suppression disturbs the homeostasis, produces typically bad mood, anxiety and cognitive decline in healthy individuals; it can play a role in the patomechanism of anxiety.
1.3 REM sleep deprivation in rodents, the “flower pot” method Sleep deprivation is difficult to investigate in humans, so methods applied in rodents are especially important to understand better the mechanisms of sleep. Sleep disturbances which are typical of depression can be often observed in rodent models of depression. In one of our experiments, we used the “flower pot” procedure to deprive REM sleep. During this method, when the animal reaches REM, it falls in the water due to the muscle atony, and awakes. Rebound sleep after REM deprivation is characterized by increased REM-pressure, which manifests in enhanced time spent in REM sleep and reduced REM latency. Besides REM deprivation, the „flower pot” method definitely causes a very stressful pathological condition due to isolation,
3
immobilization, falling into the water, soaking etc.; rats are under uncontrollable, inescapable, sub-chronic stress exposure. REM- deprivation is not a well-established modelof depression yet, although it influences several systems related to stress.The “flower pot” protocol has limitations, but it meets some of the criteria for a valid animal model, and has good face and construct validity.
1.4 SSRI antidepressants
The selective serotonin reuptake inhibitors (SSRIs:escitalopram, citalopram, fluoxetine, fluvoxamine, paroxetine, sertraline) are the most widely used antidepressants nowadays. According to the monoaminergic hypothesis of depression, the extracellular concentration of monoamines, such as serotonin (5-HT), may be deficient. Furthermore, the neurotransmitter receptor hypothesis proposes thatmonoaminergic receptors may be up-regulated (increase in the number and/or the sensitivity of receptors)which may lead toa depressed state. SSRIs enhance the extracellular concentration of 5-HT, since they interfere with the reuptake of it from the synaptic cleft. 5-HT accumulates mainly in the somatodenritic area of neurons, where binding to the 5-HT1A receptors decreases the neuronal activity. So, SSRIs acutely attenuate the serotonergic activity and cause anxiety. Due to the evaluation of their therapeutic effect and to the disappearing of the acute side effects, such as anxiety, several weeks of treatment is necessary. Decreases in the 5-HT1A, 5-HT1Bés 5-HT2C receptor functions may be especially important for the development of their therapeutic effectiveness. SSRIs reduce REM sleep and increase REM latency as well as wake time after acute dosing. The interruption of antidepressant drug therapy causes REM-rebound, for which the enhanced cholinergic activity is supposed to be responsible.
Escitalopram is the most selective and most effective SSRI, but not all patient responses for the treatment adequately.
1.5 The 5-HT2C receptor antagonists
The 5-HT2C receptor antagonists seem to be promising ligands for the augmentation of antidepressant activity and for the acute anxiolysis.
Decrease in 5-HT2C receptor responses after chronic SSRI treatment has
4
been found to disinhibit the mesolimbic dopamine system, which may play a crucial role in the development of the antidepressant action. In addition, several antidepressants (e.g. fluoxetine, ritanserine, agomelatine, trazodone) and most atypical antipsychotics have 5-HT2C
receptor antagonist property. Due to the earlier lack of subtype selective ligands with high affinity,profound investigation of 5-HT2C receptors has begun only recently. These receptors are widely distributed in the central nervous system and involved in the regulation of anxiety, sleep, learning, locomotor activity, hormone secretion and appetite. Some highly selective 5-HT2C receptor antagonists, such as SB-242084 had anxiolytic effect and elevated the power of theta waves (5-9 Hz) according to the quantitative sleep analysis (Q-EEG)in rodents.
Hippocampal theta rhythm is generated by the GABA (gamma- aminobutyric acid)-ergicand cholinergic neurons of the medial septum.
These neurons get strong serotonergic innervation from the raphe nuclei. In these brain areas, the 5-HT2C receptorsare located postsynaptically on serotonergic axon terminals and as somatodentriticheteroreceptors on GABAergic interneurons. Activation of these receptors exerts tonic inhibition on the theta waves via GABAergic interneurons.The 5-HT2C receptor antagonists elevate theta oscillations in rodents, which waves are strongly related to learning and memory processes.
2Aims
The focus of recent research was on the sleep effects of chronic escitalopram treatment in rats.
• Rebound sleep following the “flower pot” method has been extensivelyinvestigated earlier, but Markov chain analysis of the sleep architecture has not been studied yet. Furthermore, effects of chronic SSRI treatment on the rebound sleep are still lacking. In the first experiment(Escitalopram-Rebound), we examined (1)the macro- (2) and the micro-architecture (Markov chains) of sleep in the first 2 hours of the rebound period,following the 72-hour-long “flower pot”
procedure;(3)Q-EEG spectra were also analysed. In addition, we
5
explored (4)how the chronic escitalopram administration (10 mg/kg for 24 days, osmotic minipump) influencesthe sleep pattern changes.
• Changes in several 5-HT2C receptor functions after chronic antidepressant treatment have already been studied, but there is no information regarding theta oscillations. In the second experiment (Escitalopram-5-HT2Creceptor), we examined (5) how chronic escitalopram (10 mg/kg for 21 days, osmotic minipump)affects the theta-increasing activity of the acute (1 mg/kg, i.p.) 5-HT2C receptor antagonist SB-242084 in the first 3 hours of the passive phase in freely- moving rats,under undisturbed conditions.
3Materials and Methods
3.1Study design
Both experiments were carried out in male Wistar rats, which were equipped withfronto-parietal EEG and electromyographic (EMG) electrodes in the neck muscle. Motor activity was detected by the movement of the cable transferring the EEG and EMG signals. For the chronic escitalopram treatment an osmotic minipump(2ML4, ALZET, 2.5 µl/hour, 28 days, DURECT Corporation, USA) was implanted subcutaneously under the skin of the back of each animal. Minipumps were filled with escitalopram-oxalate solution (10 mg/kg/day, dissolved in solution of 0.3 N HCl in distilled water) or its solvent. Rats were habituated to the recording conditions before the experiments.
Escitalopram-Rebound
We explored how influences the chronic escitalopram treatment (for 24 days) the first 2 hours of rebound sleep following 3-day-long REM sleep deprivation. On the 21th day of escitalopram administration, at the beginning of the passive phase, each RD animal was placed on a platform situated in the middle of a round water tank. Food was available ad libitum during the whole procedure. At the end of the 72- hour-long REM deprivation, rats were removed from the platforms and they were placed into the recording cages, similarly to HC rats. The first
6
2 hours of rebound sleep were recorded.Rats were randomly divided into 4 groups on the basis of the chronic treatment [escitalopram (SSRI) or vehicle(VEH)] and REM sleep deprivation [(RD) or keeping in home cage (HC)]:
• HC-VEH; n=6
• HC-SSRI; n=7
• RD-VEH; n=7
• RD-SSRI; n=7
Escitalopram-5-HT2C receptor
In this experiment we investigated, how influences the chronic escitalopram pretreatment (21 days) the effects of the acute 5-HT2C
receptor antagonist SB-242084 (SB, 6-chloro-5- methyl-1-{[2-(2- methyl-3-pyridyl)oxy]-5-pyridyl carbamoyl}, 1 mg/kg, dissolved in 10
% (2-hydroxypropyl)-β-cyclodextrin)treatment on the Q-EEG spectra.
The acute intraperitoneal (i.p.) treatment was administered immediately at the beginning of the passive phase and then the 3-hour-long EEG recordingstarted.Rats were randomly divided into 4 groups on the basis of the chronic pretreatment (SSRI or VEH) and the acute treatment (SB- 242084 orvehicle, veh):
• VEH+veh; n=6
• VEH+SB; n=6
• SSRI+veh; n=7
• SSRI+SB; n=6
3.2 Sleep analysis and statistical evaluation
The EEG recordings were visually scored by the SleepSign forAnimal sleep analysis software (Kissei Comtec America, Inc., USA) for 4 s periods (epoch) as follows:
• AW (active wakefulness): the EEG is characterized by low amplitude activity at alpha (8-13 Hz), beta (14-30 Hz), gamma (30- 60 Hz) and theta (5-9 Hz) frequencies accompanied by high EMG and motor activity.
7
• PW (passive wakefulness): the EEG is characterized by low amplitude activity at alpha (8-13 Hz), beta (14-30 Hz), gamma (30- 60 Hz) and theta (5-9 Hz)frequencies accompanied by high EMG activity, and low motility.
• SWS-1 (light slow wave sleep): high voltage delta waves (0.5-4 Hz) interrupted by low voltage fast EEG activity (spindles 6-15 Hz) accompanied by reduced EMG and motor activity.
• SWS-2 (deep slow wave sleep): continuous, high amplitude slow cortical waves (0.5-4 Hz) with reduced EMG and motor activity.
• IS (intermediate stage of sleep):unusual association of theta waves (5-9Hz) and high-amplitude spindles (mean 12.5 Hz),appearing in brief periods just prior to or after REMsleep.
• REM (rapid eye movement) sleep: regular theta waves (5-9 Hz) accompanied by silent EMG and motor activity with occasional twitching.
Quantitative spectrum (Q-EEG) analyses of sleep were evaluated in both experiments. Q-EEG calculates the electric power in µV2 at each frequency by fast Fourier transformation. Epochs with artefacts were discarded from the analysis by visual inspection. Q-EEG was analysed in the frequency range of 1.25-60 Hz, and we particularly focused on the theta band (5-9 Hz).
Escitalopram-Rebound
Hypnograms were evaluated by the followingmethods:
- Descriptive statistical analysis, - Markov chain model,
- Q-EEG analysis.
Descriptive statistical analysis
Sleep parameters evaluated in the summarized first 2 hours of rebound sleep are the followings:
• Total time spent in stages;
8
• The number and average duration of vigilance stage episodes [(a stage episode was defined as a periodof stage lasting for ≥4 s (1 epoch)];
In the abovementioned parameters, sleep stages were classified as follows: Wake (AW and PW), NREM sleep (SWS-1, SWS-2 and IS), REM sleep and total sleep (NREM and REM sleep).
• Sleep fragmentation: the number of awakeningsthat disconnected any sleep periods;
• REM sleep latency: the time elapsed from the start of sleep until the occurence of the first REM sleep episode;
• Sleep latency: the time elapsed from the beginning of the passive phase until the first SWS-1 epoch;
• Length of the first REM item: the length of the first uninterrupted REM sleep period (IS epochs are permitted after REM);
Data were evaluated by two-way analysis of variance (ANOVA) statistics [factors: treatment (VEH or SSRI) and REM deprivation (HC or RD)], followed byTukey’s honest significant difference test.
p<0.05was defined as statistically significant. For statistical analysis and graphs, Prism 6 (GraphPad Software, Inc., USA) software was used.
Analysing hypnograms as Markov chains
We modelled hypnograms as time-continuous Markov chains. The Markov chain model is a nonlinear regression modelling technique based on numerical optimization.Our primary interests were not stage transition rates themselvesbut rather how different they are compared to thecontrol group. Therefore we normalized our data, so the reported rates are relative rates compared to the HC-VEH group (normalized transition rate, NTR). Instead of formal statistical tests, we used the confidence intervals to declare significance. If the confidence interval did not cover 1, we declared that the treatment effect is statistically significant at p<0.05 level compared to control. Also, if the confidence intervals of two groups are not overlapping, the groups significantly
9
differ at p<0.05 level. If a NTR>1, it indicates that the treatment accelerates the transitions from one state to another compared to the control group. If a NTR<1, the given treatment decelerates the transitions. There is another set of parameter of interest called sojourn time. Sojourn time is the expected average time span of an event between two jumps. Sojourn times are absolute values which are provided with the corresponding 95% confidence intervals. We declared that two sojourn times are statistically different if the confidence intervals were not overlapping. To achieve convergence, we faced limitations of the applied software. First, it had a constraint that the transition rates are constant and independent from time. This limitation could have been overcome by visually segmenting the data into two stationary periods, that is, when the observed stage frequencies were relatively constant: onset phase [the first 30 minutes of rebound sleep (0–2000 s)] and a subsequent steady phase [lasted about 90 minutes (2001–7200 s)] The second limitation was that we could achieve successful convergence only with two or three stage models, namely wake and sleep states in the onset phase, and wake, REM and NREM sleep in the steady phase. We used the freely available R program with the help of an R package called msn for the Markovian analysis.
Q-EEG analysis
Three-way repeated measures ANOVA was used with three main factors [treatment (non-repeated; VEH or SSRI) and rebound (HC or RD); theta (repeated; 5-9 Hz) and alpha (repeated;10-13 Hz) frequency bins in SWS-1, and theta(repeated; 5-9 Hz) bins in SWS-2], followed by Tukey’s honest significant difference test. p<0.05 was defined as statistically significant. For statistical analysis and graphs, Prism 6 (GraphPadSoftware, Inc., USA) software was used.
Escitalopram-5-HT2Creceptor Q-EEG analysis
Theta frequencies (5-9 Hz) were analysed in each hours of AW (1st, 2nd and 3rd hours) and REM sleep (solely 2nd and 3rd hours). The area under the curve (AUC) values of theta frequencies (5-9 Hz) were evaluated by two-way ANOVA statistics [factors: pretreatment (VEH
10
or SSRI) and treatment (veh or SB)] followed by Tukey’s honest significant difference test. In addition, to investigate the interrelation between group effects and theta frequencies, theta power values were submitted to repeated-measures ANOVA with two main fac [groups (non-repeated; VEH+veh, VEH+SB, SSRI+veh or SSRI+
and theta frequency bins (repeated; 5-9 Hz), followed by Tukey’s honest significant difference test. p<0.05 was defined as statistically significant. For statistical analysis and graphs, Statistica 7.0 (Statsoft Inc., Tulsa, OK, USA) software was used.
4Results
4.1 Escitalopram-Rebound
Descriptive statistical analysis of sleep parameters
Figure 1 REM sleep parameters in the summarized first 2 hours after 3 day REM sleep deprivation.Total time spent in REM sleep(A) REM
number(B) and duration (C), as well as REM latency (D). Data are presented as mean
± SEM of 6–7 animals per group. *: significant (p<0.05)post hoc effect group compared to the HC-VEH group; # and ##: significant (p<0.05
hoc effects of RD-SSRI group compared to HC-SSRI group.
followed by Tukey’s honest In addition, to investigate the interrelation between group effects and theta frequencies, theta power values were wo main factors:
VEH+veh, VEH+SB, SSRI+veh or SSRI+SB) 9 Hz), followed by Tukey’s
<0.05 was defined as statistically , Statistica 7.0 (Statsoft
hours after 3 day-long REM sleep episode . Data are presented as mean )post hoc effect of RD-VEH
<0.05 andp<0.01) post SSRI group.
11
REM sleep deprivation caused REM rebound compared to the control, as it elevated the total time spent in REM sleep and reduced the REM latency. The chronic SSRI treatment by itself did not affect parameters significantly. In addition, chronic escitalopram treatment only moderately attenuated the REM rebound (Figure 1).
Figure 2NREM sleep parametersin the summarized first 2 hours after 3 day REM sleep deprivation.Total time spent in NREM sleep (A)and
episode duration (B).Data are presented as mean ± SEM of 6–
group.*p<0.05 means significant post hoc effects of RD-VEH grou HC-VEH group;
REM sleep deprivation decreased the total time spent in NREM sleep compared to the control by the reduction of the average duration of NREM sleep episodes. Similarly to REM sleep parameters, escitalopram did not influenced the effects of REM sleep deprivation on NREM parameters (Figure 2).
REM sleep deprivation caused REM rebound compared to the REM sleep and reduced the did not affect REM parameters significantly. In addition, chronic escitalopram treatment
).
hours after 3 day-long and NREM sleep
–7 animals per VEH group compared to the
REM sleep deprivation decreased the total time spent in NREM reduction of the average duration of NREM sleep episodes. Similarly to REM sleep parameters, the effects of REM sleep deprivation on
12 Analysing hypnograms as Markov chains
Onset period (first 30 minutes of rebound sleep; 0 Figure 3 and 5)
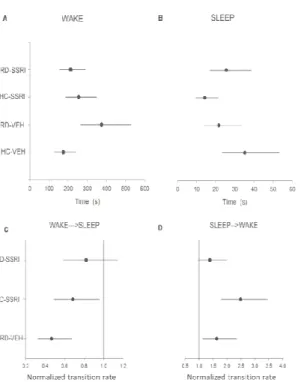
Figure 3 Sojourn times and normalized transition rates (NTR)
(0-2000) of rebound sleep. The estimated mean of the average time spent be two jumps (sojourn time) in WAKE (A) and SLEEP(B), and the normalized transition
rates (NTR, relative rates compared to the transition rate of HC-VEH group, which is 1) from WAKE to SLEEP (C)and from SLEEP to WAKE (D) states. Each point (
represents the mean values and the line segments show the 95% confide surrounding them.
Separately, both chronic escitalopram treatment and REM deprivation increased sleep fragmentation namely sleep sojourn decreased in HC-SSRI, wake sojourn enhanced in RD-
when the two interventions were applied together, these effects did not add but rather antagonized each other (Figure 3).
bound sleep; 0-2000 s;
in the onset phase The estimated mean of the average time spent between
, and the normalized transition VEH group, which is states. Each point (●) represents the mean values and the line segments show the 95% confidence interval
tely, both chronic escitalopram treatment and REM namely sleep sojourn -VEH; however, when the two interventions were applied together, these effects did not
13
Stable period (ca. 30-120 min of rebound sleep, 2001 Figure 4and 5)
Figure 4 Sojourn times and normalized transition rates (NTR) in the steady phase of rebound sleep (ca. 30–120 min; 2001–7200 sec;). The estimated mean of
the average time spent between two jumps (sojourn time) in WAKE
(B)and REM sleep(C), and the normalized transition rates (relative rates compared to the transition rate of HC-VEH group, which is 1) from WAKE to NREM
NREM to WAKE(E), from WAKE to REM(F), from REM to WAKE NREM to REM (H)and from REM to NREM (I)states. Each point (
mean values and the line segments show the 95% confidence interval surrounding them.
REM sleep deprivation caused REM fragmentation (decreased REM sojourn, doubled transition rates between NREM and REM
120 min of rebound sleep, 2001-7200 s;
Sojourn times and normalized transition rates (NTR) in the steady The estimated mean of ) in WAKE(A), NREM , and the normalized transition rates (relative rates compared to
VEH group, which is 1) from WAKE to NREM(D), from , from REM to WAKE(G), from states. Each point (●) represents the mean values and the line segments show the 95% confidence interval surrounding
REM fragmentation (decreased REM REM stages). In
14
the contrary, chronic escitalopram elongated the REM episodes (increased REM sojourn, decelerated jumps between NREM and REM stages), and prevented the changes occurring after REM deprivation (Figure 4).
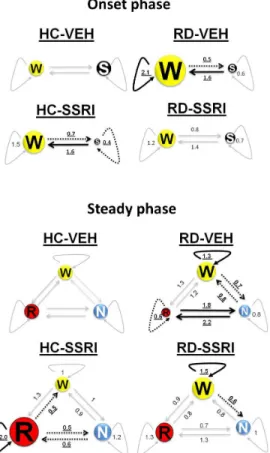
Figure 5 Illustrations of Markov chains during the onset (0-2000 s) and steady(2001-7200 s)phase.Numeric data represent the relative mean values of sojourn
times (curved lines) and normalized transition rates (staight lines) in the treatment groups compared to the mean values of the HC-VEH group (sojourn times and transition rates of the HC-VEH group are 1). The size of circles aligns the changes in
sojourn times compared to HC-VEH group. Thick, uninterrupted arrows represent significant increase, dashedarrows show significant decrease and slight arrows sign no
significant changes in sojourn and NTRvalues compared to the HC-VEH group.
Significant alterations are highlighted in bold, underlined characters.
15 Q-EEG
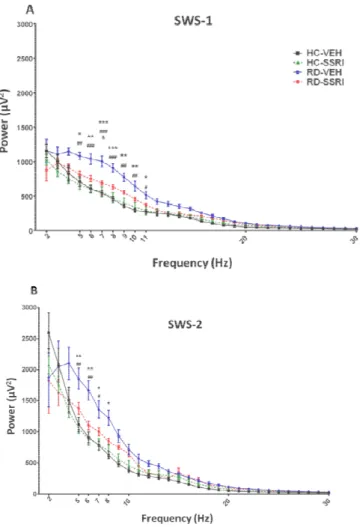
Figure 6 EEG spectra (Q-EEG) in the summarized first 2 hours of rebound sleep during slow-wave sleep stages. The theta (5–9 Hz) and alpha (10–
duringlight slow-wave sleep (SWS-1) (A) and deep slow-wave sleep (SWS Each point represents mean ± SEM values of 6–7 animals per group
significant (p<0.05, p<0.01 and p<0.001)Tukey’s post hoc effects of group compared to the HC-VEH group; # ## and ###: significant (p p<0.001)Tukey’s post hoc effects of RD-VEH group compared to HC
significant (p<0.05)Tukey’s post hoc effect of RD-SSRI group com group;
in the summarized first 2 hours of rebound sleep –13 Hz) frequencies wave sleep (SWS-2)(B).
per group. *, ** and ***:
post hoc effects of the RD-VEH p<0.05, p<0.01 and pared to HC-SSRI group; &:
SSRI group compared to RD-VEH
16
REM sleep deprivation markedly enhanced the power of theta waves(5-9 Hz) in SWS-1 and SWS-2 stages compared to the HC groups. Furthermore, REM deprivation elevated also the power of alpha frequencies (10-13 Hz) in SWS-1. The chronic SSRI treatment prevented the abovementioned effects of REM deprivation (Figure 6).
4.2 Escitalopram-5-HT2Creceptor Q-EEG
Figure 7 The power spectra of theta frequencies (5-9 Hz) during active wake (AW; A and B) and REM sleep (C and D) in the 2nd and 3rd hours after SB- 242084 treatment. Each point represents mean ± SEM values of 6–7 animals per group.*and**: significant (p <0.05 and p <0.01) Tukey’s post hoc differences between
SSRI+SB and VEH+veh groups; *** significant (p<0.001) Tukey’s post hoc difference between VEH+SB and VEH+veh groups;
The chronic escitalopram pretreatment did not affect the theta power-increasing activity of SB-242084 in the 2nd and 3rd hours of AW and REM sleep, since there was any significant interaction between the effects of pretreatment and treatment. The most prominent increase was
17
observed at 8 Hz in the 3rd hour of AW, caused by VEH+SB and SSRI+SB groups. In the case of REM sleep, we found the greatest increase at 8 Hz (2nd and 3rd hours) and at 9 Hz (3rd hour) in the SSRI+SB group.
5Conclusions
• Basedonourresults, wefound REM reboundaswellassleep and REM fragmentationinthefirst 2 hoursafter72-day-long „flowerpot”
method. Sinceenhanced REM sleeppressure and REM fragmentationarecharacteristicfeaturesin most depressedpatients and inseveralanimalmodels of depression, wecanconcludethatthesub-chronic
„flowerpot” paradigmmay be capabletomimicanxietyordepression, atleastregardingsleep.
• According to the results of Markov chain and Q-EEG analyses, the 24-day-long escitalopram treatment avoided most changesafter REM deprivation, so we suppose a good predictive validity of the sub- chronic „flower pot” protocol, as a model of depression. Normalization in sleep transitions potentially can be a characteristic feature of SSRIs and also other antidepressants which draws attention to the applicability of Markov chain model in sleep research. The appliedtime-continuous Markov-model is a powerful statistical tool which might allow analysing hypnograms in finer granularity and with higher statistical power than the standard sleep metrics; however, currently the method is not without any limitations.
• Sincethe 21-day-long escitalopram
treatmentdidnotinfluencethethetaactivity-increasingeffect of SB- 242084duringactivewakefulness and REM sleep, wecanassumethat5- HT2Creceptors, which play a roleintheregulation of thetawaves,arenotinvolvedintheadaptivemechanismscausedbythe SSRI.
Takinginto account
thatthetaoscillationsarestronglyassociatedwithlearning and memoryprocesses, theseresultscanhypothesizethatthesupposedmemory-
18
enhancingproperty of 5-HT2C receptor
antagonistsmightremainduringchronicantidepressanttreatment.
6List of publications
6.1 Publications used for the thesis
1.Kostyalik D,Katai Z, Vas S, Pap D, Petschner P, Molnar E, Gyertyan I, Kalmar L, Tothfalusi L, Bagdy G (2014a) Chronic escitalopram treatment caused dissociative adaptation in serotonin (5-HT) 2C receptor antagonist-induced effects in REM sleep, wake and theta wave activity. Experimental brain research 232:935-946.
2. Kostyalik D, Vas S, Katai Z, Kitka T, Gyertyan I, Bagdy G, Tothfalusi L (2014b) Chronic escitalopram treatment attenuated the accelerated rapid eye movement sleep transitions after selective rapid eye movement sleep deprivation: a model-based analysis using Markov chains. BMC Neurosci 15:120.
6.2 Other publications
1. Bergman P, Adori C, Vas S, Kai-Larsen Y, Sarkanen T, Cederlund A, Agerberth B, Julkunen I, Horvath B, Kostyalik D, Kalmar L, Bagdy G, Huutoniemi A, Partinen M, Hokfelt T (2014) Narcolepsy patients have antibodies that stain distinct cell populations in rat brain and influence sleep patterns. ProcNatlAcadSci U S A 111:E3735-3744.
2. Katai Z, Adori C, Kitka T, Vas S, Kalmar L, Kostyalik D, Tothfalusi L, Palkovits M, Bagdy G (2013) Acute escitalopram treatment inhibits REM sleep rebound and activation of MCH-expressing neurons in the lateral hypothalamus after long term selective REM sleep deprivation.
Psychopharmacology (Berl) 228:439-449.
3. Vas S, Katai Z, Kostyalik D, Pap D, Molnar E, Petschner P, Kalmar L, Bagdy G (2013) Differential adaptation of REM sleep latency, intermediate stage and theta power effects of escitalopram after chronic treatment. J Neural Transm 120:169-176.
19
4. Volk B, Nagy BJ, Vas S, Kostyalik D, Simig G, Bagdy G (2010) Medicinal chemistry of 5-HT5A receptor ligands: a receptor subtype with unique therapeutical potential. Curr Top Med Chem 10:554-578.