https://doi.org/10.1007/s00408-019-00195-7 SLEEP
Association Between Serum Lipid Profile and Obstructive Respiratory Events During REM and Non-REM Sleep
Andras Bikov1 · Zsofia Lazar1 · Peter Horvath1 · David Laszlo Tarnoki2 · Adam Domonkos Tarnoki2 · Luca Fesus1 · Marton Horvath1 · Martina Meszaros1 · Gyorgy Losonczy1 · Laszlo Kunos1
Received: 10 September 2018 / Accepted: 12 January 2019 / Published online: 2 February 2019
© The Author(s) 2019
Abstract
Purpose Obstructive sleep apnoea (OSA) represents a risk for dyslipidaemia. Obstructive respiratory events during rapid eye movement (REM) sleep are more strongly related to the development of hypertension and diabetes than in non-REM.
However, the relationship between sleep phases and serum lipid profile is unclear. We aimed to analyse the relationship between obstructive respiratory events in REM and non-REM sleep as well as serum lipid profile.
Methods Polysomnography was performed in 94 adult subjects who did not take any lipid-modifying medications. Fasting venous blood sample was taken the following morning for total cholesterol, triglyceride, high-density lipoprotein cholesterol (HDL-C), low-density lipoprotein cholesterol, lipoprotein(a), apoprotein A1 (ApoA1) and for apoprotein B (ApoB) measure- ments. Lipid profiles were correlated with apnoea–hypopnoea index (AHI) during REM (AHIREM) and non-REM (AHINREM) stages in all subjects. In addition, lipid profiles were compared between REM-dependent OSA patients (AHIREM ≥ 5/h, but AHINREM < 5/h) and control subjects (both AHIREM and AHINREM < 5/h).
Results AHIREM correlated only with triglyceride concentrations (p = 0.04, Spearman’s rho, ρ = 0.21). In contrast, there was a significant association between AHINREM and triglyceride (p = 0.02, ρ = 0.23), ApoB (p = 0.03, ρ = 0.21), HDL-C (p < 0.01, ρ = − 0.32) as well as ApoA1 levels (p = 0.04, ρ = − 0.21). However, these correlations were not present after adjustment for BMI (all p > 0.05). There was no difference in the lipid profile of REM-dependent OSA subjects and healthy controls (p > 0.05).
Conclusions Altered serum lipid profile is equally associated with a disturbed REM and non-REM sleep in OSA. Obesity must be considered as a strong covariate when interpreting lipid data in sleep apnoea.
Keywords Apolipoproteins · Dyslipidaemia · Lipids · Obstructive sleep apnoea · REM sleep
Introduction
Obstructive sleep apnoea (OSA) is a common disorder which is characterised by the repetitive episodes of total or partial collapse of pharynx leading to intermittent hypoxia and frequent micro-arousals. On one hand, patients with OSA commonly report daytime sleepiness and impaired performance in daily activities. On the other hand, this dis- order is associated with the development and worsening of
cardiovascular and cognitive diseases as well as metabolic dysfunction [1] such as dyslipidaemia [2, 3].
Dyslipidaemia is a major risk factor in the development of cardiovascular diseases [4]. Although traditionally, total cholesterol, low-density lipoprotein cholesterol (LDL-C), high-density lipoprotein cholesterol (HDL-C) and triglycer- ide (TG) are the main lipid components measured in clinical practice, guidelines recommend the analysis of additional components including apoprotein A1 (ApoA1), apoprotein B (ApoB) and lipoprotein(a) (LPA) when assessing dyslipi- daemia [4]. Dyslipidaemia is highly prevalent in OSA [5]
and large cohort studies showed elevated total cholesterol and TG as well as lowered HDL-C levels [6, 7].
Chronic intermittent hypoxia and fragmented sleep architecture contribute to dyslipidaemia independently [1].
Chronic intermittent hypoxia blocks lipoprotein lipase via
* Andras Bikov
andras.bikov@gmail.com
1 Department of Pulmonology, Semmelweis University, 1/C Dios arok, Budapest 1125, Hungary
2 Department of Radiology, Semmelweis University, 78/A Ulloi ut, Budapest 1082, Hungary
hypoxia-inducible factor leading to increased levels of TG [1]. Furthermore, inflammation and oxidative stress in OSA result in altered structure of visceral white adipose tissue [8].
Of note, sleep fragmentation increases adipocyte number and size [1]. OSA also shifts appetite towards increased con- sumption of fat and carbohydrate by reducing the concentra- tion of leptin and elevating the level of ghrelin in plasma [1, 9]. An increase in sympathetic activity, a consequence of hypoxia and micro-arousals may liberate cholesterol and TG from adipocytes [10]. Moreover, oxidative stress burden in OSA accelerates the development of cardiovascular disease related to lipid dysfunction [3]. Finally, OSA induces altera- tions in the production of thyroid [11] and growth hormones [12], which influence lipid metabolism.
Recent evidence suggests that the association between OSA and the development of comorbidities, such as cardio- vascular disease [13], hypertension [14–16], atherosclerosis [17, 18] and diabetes [19], strongly depends on the num- ber of apnoeic events and desaturations during rapid eye movement (REM) sleep. It is known that the production of growth hormone (GH), cortisol or thyroid hormones during night shows variability between REM or non-REM sleep [11, 20]. In addition, compared to non-REM sleep, REM sleep is characterised by higher sympathetic tone [21] in all subjects and longer apnoeic periods as well as greater oxy- gen desaturations in patients with OSA [22]. As hypoxia and augmented sympathetic activity may exaggerate dyslipidae- mia [3], one would expect that REM sleep-related obstruc- tive respiratory events induce more prominent changes in the lipid profile compared to the non-REM sleep. However, this has not been investigated before.
Therefore, the aim of our study was to analyse the rela- tionship between obstructive respiratory events during REM and non-REM sleep on the lipid profile.
Methods
Study Design and Subjects
Ninety-four adult volunteers were recruited for the study [49 ± 16 years, 30 men, body mass index (BMI) of 26.4 ± 5.2 kg/m2]. 13 subjects (14%) were current or ex- smokers, 41 (44%) volunteers had hypertension and 12 (13%) were treated with diabetes. Subjects taking any anti- lipid treatment, including statins, fibrates or nicotinic acid, being on ketogenic diet and those with known primary dys- lipidaemia were excluded. None of the patients had been diagnosed with OSA and had not used continuous positive airway pressure (CPAP) or oral appliance device.
After taking medical history and filling out the Epworth sleepiness scale (ESS), subjects attended a full-night poly- somnography. The following morning, fasting venous blood
was collected for C-reactive protein (CRP), total cholesterol, TG, HDL-C, LDL-C, LPA, ApoA1 as well as ApoB meas- urements before taking any medications.
The study was approved by the local Ethics Committee (Semmelweis University, TUKEB 30/2014) and informed consent was obtained from all participating volunteers. The study was conducted according to the Declaration of Hel- sinki (as revised in Brazil 2013).
Polysomnography
Polysomnography was performed as described previously [23] using SOMNOscreen Plus Tele PSG (SOMNOmed- ics GMBH Germany). Briefly, electroencephalogram, elec- trooculogram and electromyogram, thoracic and abdomi- nal respiratory excursions, breath sounds, nasal pressure, electrocardiogram and oxygen saturation were registered [24]. Sleep stages, movements and cardiopulmonary events were scored manually according to the American Academy of Sleep Medicine (AASM) guidelines [25]. Total sleep time (TST), sleep period time (SPT), percentage of total sleep time spent in rapid eye movement stage (REM%), percentage of total sleep time spent with saturation below 90% (TST90%) and minimal O2 saturation (minSatO2) were recorded; Apnoea-hypopnoea index (AHI), oxygen desaturation index (ODI) and arousal index (AI) were cal- culated. AHI was evaluated both during REM (AHIREM) and non-REM (AHINREM) sleep. Obstructive sleep apnoea was defined as having an AHI ≥ 5/h, while REM-dependent OSA as having an AHIREM ≥ 5/h, but AHINREM < 5/h.
Statistical Analysis
Statistica 12 (StatSoft, Inc., Tulsa, OK) software was used for statistical analysis. Data normality was tested with the Kolmogorov–Smirnov’s test. Categorical parameters were compared with Chi-square test. Lipid profile was compared between the OSA and non-OSA groups (AHI < 5/h) as well REM-dependent OSA and controls (both AHIREM and AHINREM < 5/h) using the Mann–Whitney test. The Spear- man’s test was used to correlate lipids with clinical param- eters. The effects of BMI, age and gender as co-variates were assessed with multivariate analyses and the general mixed linear model. A p value < 0.05 was considered statistically significant.
Results
Patient Characteristics
Following polysomnography, the volunteers were divided into OSA (n = 41) and non-OSA (n = 53) groups. Patients
with OSA were classified into mild (AHI 5–14.9 events/h, n = 21), moderate (AHI 15–29.9 events/h, n = 13) and severe (AHI > 30 events/h, n = 7) subgroups. The patients were sig- nificantly older, had higher BMI, had higher prevalence of males and hypertension (all p < 0.05). They also had longer total sleep time and sleep period time, higher AHI, ODI, TST90% and lower MinSatO2 (all p < 0.05). There was no difference in the prevalence of smokers or patients with diabetes, CRP, ESS, REM% or AI (all p > 0.05) between the two groups. Subjects’ characteristics are summarised in Table 1.
The Lipid Profile in the OSA and Control Groups Serum triglyceride and ApoB levels were higher, while serum HDL-C levels were lower in OSA (all p < 0.05).
There was a trend for lower ApoA1 concentrations in OSA (p = 0.07). There was no difference in total cholesterol, LDL-C or LPA between the two groups (p > 0.05, Table 1).
Correlation between the elements of lipid profile and clinical variables is shown in Table 2.
Differences in serum triglyceride, ApoB and HDL-C levels between OSA and control groups were adjusted for BMI, age and gender. After adjustment for BMI, the differ- ences between the two groups for the three lipid parameters became insignificant (all p > 0.05). Adjustment for male gen- der significantly affected the difference in HDL-C, while adjustment for age did not influence any of the inter-group differences.
Relationship Between Lipid Profile and AHIREM as well as AHINREM
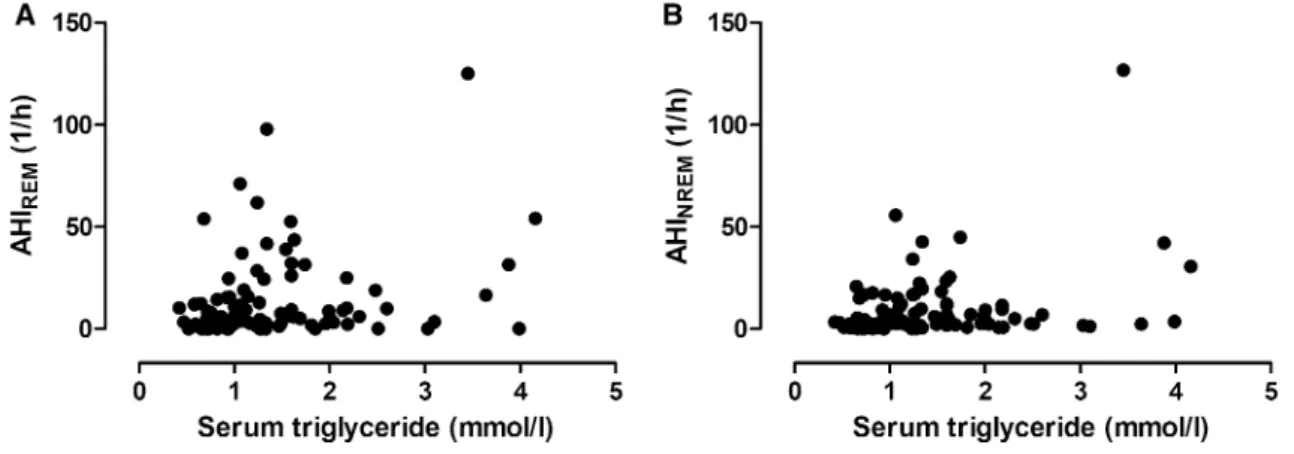
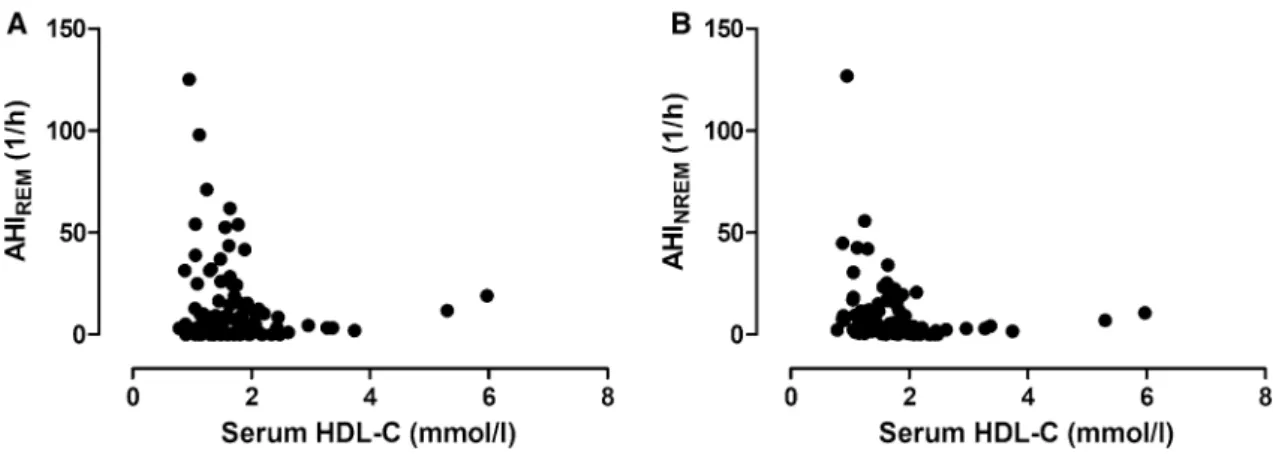
There was a significant correlation between AHIREM and TG levels (p = 0.04, ρ = 0.21, Fig. 1a), but not with any other lipid components (Fig. 2a). In contrast, AHINREM correlated directly with TG (p = 0.02, ρ = 0.23, Fig. 1b) and ApoB (p = 0.03, ρ = 0.22), and indirectly with HDL-C (p < 0.01, ρ = − 0.32, Fig. 2b) and ApoA1 (p = 0.04, ρ = − 0.21).
Adjusting for BMI, all the relationships above became insignificant (p > 0.05). After adjustment for male gender the relationships between AHINREM and ApoA1, ApoB and HDL-C became insignificant, but this did not affect the asso- ciations between TG and AHIREM or AHINREM. Adjustment for age did not affect the relationship between AHIREM and TG, AHINREM and TG as well as AHINREM and HDL-C.
Differences Between REM‑Dependent OSA and Control Groups
From all volunteers, 16 were diagnosed with REM-depend- ent OSA. Their lipid profile was compared with control
subjects (n = 39). There was no difference in any of the investigated lipid parameters (all p > 0.05, data not shown).
Discussion
In this study, we evaluated the relationship between obstruc- tive respiratory events during REM versus non-REM sleep and lipid profile. We found that TG levels related to AHI irrespective of REM or non-REM phase, while HDL-C, ApoA1 and ApoB were associated with AHI only during non-REM stage. In contrast to cardiovascular disease, hyper- tension and diabetes, the presence of dyslipidaemia in OSA
Table 1 Subject’s characteristics
The data are expressed as mean ± standard deviation for parametric and median (range) for non-parametric variables. Significant differ- ences are presented in bold
BMI body mass index, CRP C-reactive protein, HDL-C high-density lipoprotein cholesterol, LDL-C low-density lipoprotein cholesterol, TG triglyceride, ApoA1 apolipoprotein A1, ApoB apolipoprotein B, LPA lipoprotein (a), TST total sleep time, SPT sleep period time, REM% percentage of total sleep time spent in rapid eye movement stage, AHI apnoea–hypopnoea index, ODI oxygen desaturation index, TST90% percentage of total sleep time spent with saturation below 90%, MinSatO2 minimal O2 saturation, AI arousal index
Control (n = 53) OSA (n = 41) p Value Gender (male/
female) 12/41 18/23 0.02
Age (years) 45 (20–74) 60 (29–74) < 0.01 BMI (kg/m2) 24.6 ± 3.6 28.7 ± 6.1 < 0.01
Hypertension (%) 21 61 < 0.01
Diabetes (%) 17 9 0.27
Smokers (%) 20 9 0.16
Epworth sleepiness
scale 6 (1–14) 6 (0–14) 0.62
CRP (mg/ml) 1.8 (0.2–73.2) 2.3 (0.2–49.5) 0.58 Total cholesterol
(mmol/l) 5.30 (3.50–8.50) 5.40 (3.40–8.50) 0.73 HDL-C (mmol/l) 1.72 (0.79–3.74) 1.48 (0.88–5.97) < 0.01 LDL-C (mmol/l) 3.03 (1.09–5.43) 3.11 (1.36–5.57) 0.50 TG (mmol/l) 1.00 (0.42–3.99) 1.34 (0.65–4.16) < 0.01 ApoA1 (g/l) 1.62 (0.00–2.10) 1.51 (0.84–2.29) 0.07 ApoB (g/l) 1.06 (0.45–3.22) 1.23 (0.69–2.12) 0.04 LPA (g/l) 0.12 (0.00–1.13) 0.31 (0.00–1.13) 0.32
TST (min) 383 ± 57 412 ± 35 < 0.01
SPT (min) 418 ± 50 447 ± 36 < 0.01
REM% 15.6 ± 7.0 16.3 ± 6.7 0.64
AHI (1/h) 2.3 (0.0–4.8) 14.6 (5.0–126.5) < 0.01 ODI (1/h) 0.9 (0.0–4.3) 11.3 (1.5–120.60) < 0.01
TST90% 1.5 ± 6.7 7.9 ± 19.5 < 0.01
MinSatO2 90.7 ± 3.3 83.0 ± 8.4 < 0.01
AI (1/h) 46.8 ± 20.1 47.0 ± 20.8 0.91
may not be influenced by the timely occurrence of respira- tory events.
The need for biomarkers which predict OSA-related mortality has been emphasised [26], and the measurement of serum lipids may have additional clinical value when predicting long-term consequences such as cardiovascular morbidity and mortality. Dyslipidaemia is a major factor in the development of cardiovascular diseases, and OSA is associated with altered lipid profile. According to the European Society of Cardiology/European Atherosclerosis
Society, dyslipidaemia should be evaluated based on the profile of multiple lipids and lipoproteins [4]. The meas- urement of apoA1 and apoB have advantages over con- ventional analyses of lipids, namely, that the assays do not require fasting conditions and are not influenced by high TG levels [4]. ApoB is the major constituent of the atherogenic lipoproteins, such as LDL, very low-density lipoprotein and intermediate density lipoprotein, while apoA1 is the main component of HDL. Despite the afore- mentioned methodological advantage, it seems that the
Table 2 Relationships between serum lipid levels and clinical variables
Spearman’s rho are presented for significant relationships in bold. Non-significant associations are marked as NS
HDL-C high-density lipoprotein cholesterol, LDL-C low-density lipoprotein cholesterol, TG triglyceride, ApoA1 apolipoprotein A1, ApoB apoli- poprotein B, LPA lipoprotein (a), BMI body mass index, CRP C-reactive protein, ESS Epworth sleepiness scale, TST total sleep time, SPT sleep period time, REM% percentage of total sleep time spent in rapid eye movement stage, AHI apnoea–hypopnoea index, ODI oxygen desaturation index, TST90% percentage of total sleep time spent with saturation below 90%, MinSatO2 minimal O2 saturation, AI arousal index
Total cholesterol
(mmol/l) HDL-C (mmol/l) LDL-C (mmol/l) TG (mmol/) ApoA1 (g/l) ApoB (g/l) LPA (g/l)
Gender (male) NS − 0.46 NS 0.25 − 0.32 NS NS
Age (years) 0.28 NS NS 0.23 NS 0.23 NS
BMI (kg/m2) 0.21 − 0.42 0.33 0.49 NS 0.32 NS
Hypertension NS − 0.26 NS 0.42 NS NS NS
Diabetes NS NS NS 0.27 NS 0.31 NS
Smoker NS NS NS NS NS NS NS
ESS NS NS NS 0.26 NS NS NS
CRP (mg/ml) 0.33 − 0.27 0.36 0.35 NS 0.46 NS
TST (min) NS NS NS 0.31 NS NS NS
SPT (min) NS NS NS NS NS NS NS
REM% NS NS NS NS NS NS NS
AHI (1/h) NS − 0.29 NS 0.26 NS 0.21 NS
ODI (1/h) NS − 0.38 NS 0.39 NS 0.29 NS
TST90% 0.25 − 0.23 0.22 0.35 NS 0.29 NS
MinSatO2 − 0.29 0.31 − 0.33 − 0.37 NS − 0.31 NS
AI (1/h) NS NS − 0.24 NS NS NS NS
Fig. 1 Relationship between serum triglyceride levels and AHIREM (a) as well as AHINREM (b). There was a significant correlation between TG levels and AHIREM (p = 0.04, ρ = 0.21, a) and AHINREM (p = 0.02, ρ = 0.23, b)
measurement of apoA1 and apoB does not provide additive clinical value over traditional lipid levels [4]. LPA has a similar structure to LDL; however, it contains a unique apolipoprotein, the apolipoprotein (a). It may pose further risk for cardiovascular disease in subjects with family his- tory of thromboembolic events [4].
Studies investigating serum lipid profile in OSA are con- tradictory. In general, reports finding no association analysed data from a limited number of subjects [27]. However, in case–control studies recruiting many volunteers, the rela- tionship between OSA severity and lipid levels was signifi- cant, but it was also weak [6, 7] and non-linear [2]. A meta- regression analysis by Nadeem et al. concluded that OSA is associated with high total cholesterol, LDL-C and TG and low HDL-C [28]. Nevertheless, even if a study did not find a difference in lipid or apolipoprotein concentrations, dysfunctionality of HDL was reported, suggesting qualita- tive rather than quantitative alterations in lipid profile [29].
A study involving more than 500 subjects demonstrated a direct relationship between AHI and apoB levels but no rela- tionship with apoA1 [30]. On contrary, Guan et al. reported a direct relationship with apoB and an indirect association with apoA1 in nearly 3000 volunteers [2]. Considering all previous data, the difference in serum lipid and apoprotein concentrations between the OSA and control groups is small and may be statistically significant only when increasing the number of subjects [28]. We found a significant differ- ence in TG, HDL-C and ApoB, while ApoA1 tended to be lower in OSA. Interestingly, there was a significant associa- tion between markers of hypoxaemia and LDL-C as well as total cholesterol, while these lipids did not relate to AHI or ODI. These confirm the previous data that hypoxia is more strongly related to dyslipidaemia than to the apnoeic periods [7, 30]. In line with previous reports [2], LPA levels were unaltered in OSA in the current study. Confirming the recent data on the association between systemic inflammation and
dyslipidaemia in OSA [31], lipid markers except for ApoA1 and LPA correlated with CRP.
Although animal models show that chronic intermittent hypoxia and sleep fragmentation may independently induce lipid dysfunction [1], this has not been confirmed by the present study. Only LDL-C correlated with arousal index, suggesting that a more fragmented sleep is associated with lower LDL-C. These surprising associations need to be con- firmed in an independent cohort.
The significance of obesity as a covariate is frequently disputed [1]. In experimental OSA models, dyslipidaemia was induced in non-obese animals [1], and in some human studies the relationship between OSA severity and dyslipi- daemia existed even after adjustment for BMI [2, 7, 30]. A recent study involving more than 8000 participants reported that paradoxically, morbid obesity may be associated with lower TG and higher HDL-C [7]. As OSA severity is directly related to BMI [32], obesity is likely to be a bias for the relationship between OSA and lipids. In the current work, similarly to a recent study conducted on 2983 patients [2], obesity was found to be a significant covariate; however, the extent of its effect needs to be estimated in larger cohorts.
Of note, the relationship between obesity and OSA is bidi- rectional. On one hand, obesity worsens OSA by inducing accumulation of fat tissue around upper airways and influ- encing ventilatory control [33]. On the other hand, sleep fragmentation promotes hyperphagia and increases the number and size of adipocytes, while chronic intermittent hypoxia induces lipolysis and inflammation in fat tissue [1].
Nevertheless, after the adjustment for BMI, all correlations between OSA severity and lipid markers became insignifi- cant. Waist circumference may a better estimate for obesity than BMI [34]. However, we have not measured that in this study.
The lipid profile shows geographic, racial, gender- and age-related variability [34]. In addition, OSA is more
Fig. 2 Relationship between serum HDL-C levels and AHIREM (a) as well as AHINREM (b). There was no correlation between HDL-C and AHIREM (p > 0.05, a), while there was a significant relationship between HDL-C and AHINREM (p < 0.01, ρ = − 0.32, b)
strongly related to metabolic syndrome in younger age [35].
However, adjustment for age influenced our results only mar- ginally, while only the relationships between AHI and TG remained significant after adjustment for gender.
Because of the prominent effect of BMI, the conclusions on AHIREM as well as AHINREM need to be interpreted care- fully. Previous studies finding AHIREM dependence of hyper- tension and insulin resistance concluded that the prominent effect of REM sleep may be due to increased sympathetic tone [14–16, 19]. In fact, increased sympathetic activity may induce lipolysis liberating circulating lipids [3]. How- ever, it seems that this effect is marginal in OSA as non- REM-related sleep disturbances were more closely related to dyslipidaemia. This is in line with the previous results showing that although CPAP reduces sympathetic activity, it has only a minor effect on the metabolic profile [36]. Apart from the sympathetic activity, significant sleep phase-related differences exist also in the production of hormones which may affect lipid metabolism. It is known that GH is mainly produced during stage N3 sleep [20] and OSA is associated with decreased levels of GH [12]. Exogenous GH has been reported to increase HDL-C in growth hormone-deficient patients [37] suggesting a direct relationship between GH and HDL-C. Additionally to intermittent hypoxia and sleep fragmentation, the increased production of free fatty acids in OSA may itself decrease GH production [12]. The release of another hormone, the thyrotropin also peaks during early, non-REM dominant stages of sleep with a significant reduc- tion during sleep deprivation [11]. The resulting hypothy- roidism may lead to hyperlipidaemia even at subclinical stages [38]. Reduction in the levels of GH and thyrotropin during disturbed non-REM sleep may explain our findings.
However, this needs to be confirmed by simultaneous meas- urement of hormones and lipids.
Studies finding differences in REM versus non-REM OSA in the risk for cardiovascular disease, hypertension and diabetes had important clinical implications about the effect of CPAP compliance on comorbidities [14–16, 19]. Theo- retically, because REM phase occurs predominantly during the latter stages of sleep, too short (< 4 h) CPAP usage at the beginning of sleep may have markedly lesser beneficial effect on comorbidities. Dorkova et al. compared the effect of 8-week CPAP treatment on lipid profile in patients who daily used their device for more or less than 4 h [39]. Longer CPAP usage had significantly greater effect on total choles- terol, TG, LDL-C and apoB, while no difference was seen on ApoB1 and HDL-C [39]. Although our findings suggest that non-REM sleep has a more pronounced effect on lipid profile, it should still be recommended to use CPAP as long as possible due to two reasons. Firstly, our study did not dif- ferentiate between early and late night non-REM sleep, and secondly, REM sleep was also significantly associated with lipid profile, however less strongly than non-REM.
In summary, we found that AHI during REM is as strongly associated with dyslipidaemia as obstructive events in non-REM sleep. Our findings may at least partly explain previous contradictions between studies analysing lipids and apolipoproteins in OSA and may facilitate further research.
Acknowledgements Open access funding provided by Semmelweis University (SE). The study was supported by Hungarian Respiratory Society grants to Andras Bikov, Peter Horvath and David L. Tarnoki as well as Semmelweis University grant to Laszlo Kunos. This pub- lication was supported by the Janos Bolyai Research Scholarship of the Hungarian Academy of Sciences to Andras Bikov. The authors are also grateful to Elektro-Oxigén Inc. for providing polysomnographic devices and Mrs. Monika Banlaky for her assistance in polysomno- graphic measurements.
Compliance with Ethical Standards
Conflict of interest The authors declare that they have no conflict of interest.
Ethical Approval All procedures performed in studies involving human participants were in accordance with the ethical standards of the insti- tutional and/or national research committee and with the 1964 Helsinki Declaration and its later amendments or comparable ethical standards.
Informed Consent Informed consent was obtained from all individual participants included in the study.
Open Access This article is distributed under the terms of the Crea- tive Commons Attribution 4.0 International License (http://creat iveco mmons .org/licen ses/by/4.0/), which permits unrestricted use, distribu- tion, and reproduction in any medium, provided you give appropriate credit to the original author(s) and the source, provide a link to the Creative Commons license, and indicate if changes were made.
References
1. Gileles-Hillel A, Kheirandish-Gozal L, Gozal D (2016) Biologi- cal plausibility linking sleep apnoea and metabolic dysfunction.
Nat Rev Endocrinol 12(5):290–298. https ://doi.org/10.1038/nrend o.2016.22
2. Guan J, Yi H, Zou J, Meng L, Tang X, Zhu H, Yu D, Zhou H, Su K, Yang M, Chen H, Shi Y, Wang Y, Wang J, Yin S, Shanghai Sleep Health Study Research G (2016) Distinct severity stages of obstructive sleep apnoea are correlated with unique dyslipidae- mia: large-scale observational study. Thorax 71(4):347–355. https ://doi.org/10.1136/thora xjnl-2015-20740 3
3. Adedayo AM, Olafiranye O, Smith D, Hill A, Zizi F, Brown C, Jean-Louis G (2014) Obstructive sleep apnea and dyslipidemia:
evidence and underlying mechanism. Sleep Breath Schlaf Atmung 18(1):13–18. https ://doi.org/10.1007/s1132 5-012-0760-9 4. Catapano AL, Graham I, De Backer G, Wiklund O, Chapman MJ,
Drexel H, Hoes AW, Jennings CS, Landmesser U, Pedersen TR, Reiner Z, Riccardi G, Taskinen MR, Tokgozoglu L, Verschuren WM, Vlachopoulos C, Wood DA, Zamorano JL (2016) 2016 ESC/
EAS guidelines for the management of dyslipidaemias: the Task Force for the Management of Dyslipidaemias of the European Society of Cardiology (ESC) and European Atherosclerosis Soci- ety (EAS) developed with the special contribution of the European
Assocciation for Cardiovascular Prevention & Rehabilitation (EACPR). Atherosclerosis 253:281–344. https ://doi.org/10.1016/j.
ather oscle rosis .2016.08.018
5. Wu WT, Tsai SS, Shih TS, Lin MH, Chou TC, Ting H, Wu TN, Liou SH (2015) The association between obstructive sleep apnea and metabolic markers and lipid profiles. PLoS ONE 10(6):e0130279. https ://doi.org/10.1371/journ al.pone.01302 79 6. Roche F, Sforza E, Pichot V, Maudoux D, Garcin A, Celle S, Pic-
ard-Kossovsky M, Gaspoz JM, Barthelemy JC, Group PS (2009) Obstructive sleep apnoea/hypopnea influences high-density lipo- protein cholesterol in the elderly. Sleep Med 10(8):882–886. https ://doi.org/10.1016/j.sleep .2008.07.017
7. Gunduz C, Basoglu OK, Hedner J, Zou D, Bonsignore MR, Hein H, Staats R, Pataka A, Barbe F, Sliwinski P, Kent BD, Pepin JL, Grote L (2018) Obstructive sleep apnoea independently predicts lipid levels: data from the European Sleep Apnea Data- base. Respirology 23(12):1180–1189. https ://doi.org/10.1111/
resp.13372
8. Pasarica M, Sereda OR, Redman LM, Albarado DC, Hymel DT, Roan LE, Rood JC, Burk DH, Smith SR (2009) Reduced adipose tissue oxygenation in human obesity: evidence for rarefaction, macrophage chemotaxis, and inflammation without an angio- genic response. Diabetes 58(3):718–725. https ://doi.org/10.2337/
db08-1098
9. Spiegel K, Tasali E, Penev P, Van Cauter E (2004) Brief com- munication: sleep curtailment in healthy young men is associated with decreased leptin levels, elevated ghrelin levels, and increased hunger and appetite. Ann Intern Med 141(11):846–850
10. Leren P, Eide I, Foss OP, Helgeland A, Hjermann I, Holme I, Kjeldsen SE, Lund-Larsen PG (1982) Antihypertensive drugs and blood lipids: the Oslo study. Br J Clin Pharmacol 13(S2):441S–444S
11. Spiegel K, Leproult R, Van Cauter E (1999) Impact of sleep debt on metabolic and endocrine function. Lancet 354(9188):1435–
1439. https ://doi.org/10.1016/S0140 -6736(99)01376 -8
12. Lanfranco F, Motta G, Minetto MA, Ghigo E, Maccario M (2010) Growth hormone/insulin-like growth factor-I axis in obstruc- tive sleep apnea syndrome: an update. J Endocrinol Investig 33(3):192–196. https ://doi.org/10.1007/BF033 46580
13. Aurora RN, Crainiceanu C, Gottlieb DJ, Kim JS, Punjabi NM (2018) Obstructive sleep apnea during REM sleep and cardiovas- cular disease. Am J Respir Crit Care Med 197(5):653–660. https ://doi.org/10.1164/rccm.20170 6-1112O C
14. Appleton SL, Vakulin A, Martin SA, Lang CJ, Wittert GA, Taylor AW, McEvoy RD, Antic NA, Catcheside PG, Adams RJ (2016) Hypertension is associated with undiagnosed OSA dur- ing rapid eye movement sleep. Chest 150(3):495–505. https ://doi.
org/10.1016/j.chest .2016.03.010
15. Mokhlesi B, Finn LA, Hagen EW, Young T, Hla KM, Van Cau- ter E, Peppard PE (2014) Obstructive sleep apnea during REM sleep and hypertension. Results of the Wisconsin Sleep Cohort.
Am J Respir Crit Care Med 190(10):1158–1167. https ://doi.
org/10.1164/rccm.20140 6-1136O C
16. Mokhlesi B, Hagen EW, Finn LA, Hla KM, Carter JR, Peppard PE (2015) Obstructive sleep apnoea during REM sleep and incident non-dipping of nocturnal blood pressure: a longitudinal analysis of the Wisconsin Sleep Cohort. Thorax 70(11):1062–1069. https ://doi.org/10.1136/thora xjnl-2015-20723 1
17. Ljunggren M, Lindberg E, Franklin KA, Ohagen P, Larsson M, Theorell-Haglow J, Naessen T (2018) Obstructive sleep apnea during rapid eye movement sleep is associated with early signs of atherosclerosis in women. Sleep. https ://doi.org/10.1093/sleep /zsy09 9
18. Lin CY, Ho CS, Tsai WC, Chen JY (2018) Different effects of apnea during rapid eye movement period on peripheral arterial
stiffness in obstructive sleep apnea. Atherosclerosis 269:166–171.
https ://doi.org/10.1016/j.ather oscle rosis .2018.01.008
19. Grimaldi D, Beccuti G, Touma C, Van Cauter E, Mokhlesi B (2014) Association of obstructive sleep apnea in rapid eye move- ment sleep with reduced glycemic control in type 2 diabetes:
therapeutic implications. Diabetes Care 37(2):355–363. https ://
doi.org/10.2337/dc13-0933
20. Takahashi Y, Kipnis DM, Daughaday WH (1968) Growth hor- mone secretion during sleep. J Clin Investig 47(9):2079–2090.
https ://doi.org/10.1172/JCI10 5893
21. Somers VK, Dyken ME, Mark AL, Abboud FM (1993) Sym- pathetic-nerve activity during sleep in normal subjects. N Engl J Med 328(5):303–307. https ://doi.org/10.1056/NEJM1 99302 04328 0502
22. Findley LJ, Wilhoit SC, Suratt PM (1985) Apnea duration and hypoxemia during REM sleep in patients with obstructive sleep apnea. Chest 87(4):432–436
23. Bikov A, Kunos L, Pallinger E, Lazar Z, Kis A, Horvath G, Losonczy G, Komlosi ZI (2017) Diurnal variation of circulating microvesicles is associated with the severity of obstructive sleep apnoea. Sleep Breath Schlaf Atmung 21(3):595–600. https ://doi.
org/10.1007/s1132 5-017-1464-y
24. Kushida CA, Littner MR, Morgenthaler T, Alessi CA, Bailey D, Coleman J Jr, Friedman L, Hirshkowitz M, Kapen S, Kramer M, Lee-Chiong T, Loube DL, Owens J, Pancer JP, Wise M (2005) Practice parameters for the indications for polysom- nography and related procedures: an update for 2005. Sleep 28(4):499–521
25. Berry RB, Budhiraja R, Gottlieb DJ, Gozal D, Iber C, Kapur VK, Marcus CL, Mehra R, Parthasarathy S, Quan SF, Redline S, Strohl KP, Davidson Ward SL, Tangredi MM (2012) Rules for scoring respiratory events in sleep: update of the 2007 AASM manual for the scoring of sleep and associated events. Deliberations of the Sleep Apnea Definitions Task Force of the American Academy of Sleep Medicine. J Clin Sleep Med 8(5):597–619. https ://doi.
org/10.5664/jcsm.2172
26. Mullington JM, Abbott SM, Carroll JE, Davis CJ, Dijk DJ, Dinges DF, Gehrman PR, Ginsburg GS, Gozal D, Haack M, Lim DC, Macrea M, Pack AI, Plante DT, Teske JA, Zee PC (2016) Devel- oping biomarker arrays predicting sleep and circadian-coupled risks to health. Sleep 39(4):727–736. https ://doi.org/10.5665/sleep .5616
27. Drager LF, Jun J, Polotsky VY (2010) Obstructive sleep apnea and dyslipidemia: implications for atherosclerosis. Curr Opin Endo- crinol Diabetes Obes 17 (2):161–165. https ://doi.org/10.1097/
MED.0b013 e3283 37362 4
28. Nadeem R, Singh M, Nida M, Waheed I, Khan A, Ahmed S, Naseem J, Champeau D (2014) Effect of obstructive sleep apnea hypopnea syndrome on lipid profile: a meta-regression analysis. J Clin Sleep Med 10(5):475–489. https ://doi.org/10.5664/jcsm.3690 29. Tan KC, Chow WS, Lam JC, Lam B, Wong WK, Tam S, Ip MS
(2006) HDL dysfunction in obstructive sleep apnea. Atheroscle- rosis 184(2):377–382. https ://doi.org/10.1016/j.ather oscle rosis .2005.04.024
30. Tisko R, Sopkova Z, Habalova V, Dorkova Z, Slaba E, Javorsky M, Tkac I, Riha RL, Tkacova R (2014) Effects of apolipoprotein E genotype on serum lipids in obstructive sleep apnoea. Eur Respir J 43(4):1097–1105. https ://doi.org/10.1183/09031 936.00098 513 31. Horvath P, Tarnoki DL, Tarnoki AD, Karlinger K, Lazar Z,
Losonczy G, Kunos L, Bikov A (2018) Complement system activation in obstructive sleep apnea. J Sleep Res. https ://doi.
org/10.1111/jsr.12674
32. Landry SA, Joosten SA (2018) Obstructive sleep apnoea and cho- lesterol: independence in context. Respirology 23(12):1092–1093.
https ://doi.org/10.1111/resp.13405
33. Wolk R, Shamsuzzaman AS, Somers VK (2003) Obesity, sleep apnea, and hypertension. Hypertension 42(6):1067–1074. https ://
doi.org/10.1161/01.HYP.00001 01686 .98973 .A3
34. Ford ES, Giles WH, Dietz WH (2002) Prevalence of the meta- bolic syndrome among US adults: findings from the third National Health and Nutrition Examination Survey. JAMA 287(3):356–359 35. Gaines J, Vgontzas AN, Fernandez-Mendoza J, Bixler EO (2018)
Obstructive sleep apnea and the metabolic syndrome: the road to clinically-meaningful phenotyping, improved prognosis, and personalized treatment. Sleep Med Rev 42:211–219. https ://doi.
org/10.1016/j.smrv.2018.08.009
36. Jullian-Desayes I, Joyeux-Faure M, Tamisier R, Launois S, Borel AL, Levy P, Pepin JL (2015) Impact of obstructive sleep apnea treatment by continuous positive airway pressure on
cardiometabolic biomarkers: a systematic review from sham CPAP randomized controlled trials. Sleep Med Rev 21:23–38.
https ://doi.org/10.1016/j.smrv.2014.07.004
37. Eden S, Wiklund O, Oscarsson J, Rosen T, Bengtsson BA (1993) Growth hormone treatment of growth hormone-deficient adults results in a marked increase in Lp(a) and HDL cholesterol con- centrations. Arterioscler Thromb Vasc Biol 13(2):296–301 38. Pucci E, Chiovato L, Pinchera A (2000) Thyroid and lipid metabo-
lism. Int J Obes 24(S2):S109–S112
39. Dorkova Z, Petrasova D, Molcanyiova A, Popovnakova M, Tka- cova R (2008) Effects of continuous positive airway pressure on cardiovascular risk profile in patients with severe obstructive sleep apnea and metabolic syndrome. Chest 134(4):686–692. https ://
doi.org/10.1378/chest .08-0556