Cholinergic basal forebrain structures are not essential for mediation of the arousing action of glutamate
Z O L T AN L E L K E S
1, S H A M S I I A T A B D U R A K H M A N O V A
2and T A R J A P O R K K A - H E I S K A N E N
31Department of Physiology, Faculty of Medicine, University of Szeged, Szeged, Hungary;2Department of Anatomy, University of Helsinki, Helsinki, Finland;3Department of Physiology, University of Helsinki, Helsinki, Finland
Keywords
cholinergic lesion, awakening action, electrocorticogram, excitatory amino acid agonist
Correspondence
Dr Zoltan Lelkes, Department of Physiology, Faculty of Medicine, University of Szeged, Dom ter 10, H-6720 Szeged, Hungary.
Tel.: +36-62-544985;
fax: +36-62-545842;
e-mail: lelkes.zoltan@med.u-szeged.hu Accepted in revised form 3 August 2017;
received 16 May 2017revised July 27, 2017 DOI: 10.1111/jsr.12605
SUMMARY
The cholinergic basal forebrain contributes to cortical activation and receives rich innervations from the ascending activating system. It is involved in the mediation of the arousing actions of noradrenaline and histamine. Glutamatergic stimulation in the basal forebrain results in cortical acetylcholine release and suppression of sleep. However, it is not known to what extent the cholinergic versus non-cholinergic basal forebrain projection neurones contribute to the arousing action of glutamate. To clarify this question, we administered N-methyl-D- aspartate (NMDA), a glutamate agonist, into the basal forebrain in intact rats and after destruction of the cholinergic cells in the basal forebrain with 192 immunoglobulin (Ig)G-saporin. In eight Han–Wistar rats with implanted electroencephalogram/electromyogram (EEG/EMG) elec- trodes and guide cannulas for microdialysis probes, 0.23lg 192 IgG- saporin was administered into the basal forebrain, while the eight control animals received artificial cerebrospinal fluid. Two weeks later, a microdialysis probe targeted into the basal forebrain was perfused with cerebrospinalfluid on the baseline day and for 3 h with 0.3 mMNMDA on the subsequent day. Sleep–wake activity was recorded for 24 h on both days. NMDA exhibited a robust arousing effect in both the intact and the lesioned rats. Wakefulness was increased and both non-REM and REM sleep were decreased significantly during the 3-h NMDA perfusion.
Destruction of the basal forebrain cholinergic neurones did not abolish the wake-enhancing action of NMDA. Thus, the cholinergic basal forebrain structures are not essential for the mediation of the arousing action of glutamate.
I N T R O D U C T I O N
Projections from the brain stem reticular formation ascend into the forebrain and stimulate the cortical activity via a dorsal relay in the thalamus and a ventral one through the hypothalamus and the basal forebrain (BF). The BF is both a critical relay in the mediation of cortical arousal (Fulleret al., 2011; Jones, 2005) and a key area in the regulation of the sleep–wake cycle (Szymusiak, 1995). The BF influences cortical activity via cholinergic, gamma-aminobutyric acid (GABA)ergic and glutamatergic direct pathways projecting to the cerebral cortex (Henny and Jones, 2008) and also indirectly, e.g. via pathways projecting to the thalamus (Detari et al., 1999). The cortical release of acetylcholine is enhanced during cortical activation (Detari et al., 1999;
Szerb, 1967; Szymusiak, 1995). The rate of discharge of the cholinergic BF cells is maximal during wakefulness (W) and rapid eye movement (REM) sleep, i.e. when the cortical electroencephalogram (EEG) is desynchronized (Hassani et al., 2009). The wake-associated increase in the activity of these cells is also related closely to the mechanism of recovery sleep following a prolonged W period (Kalinchuk et al., 2008; Porkka-Heiskanen et al., 1997). Some of the non-cholinergic neurones also increase their activity during W and REM sleep (Hassani et al., 2009). Cholinergic and non-cholinergic neurones in the BF function jointly in the control of cortical activation (Fulleret al., 2011).
Fibres from the ascending activating system (Fulleret al., 2011; Jones, 2005; Szymusiak, 1995) innervating the BF terminate on most cell types, making it difficult to evaluate
Animal research
their specific roles. However, the function of the cholinergic neurones has been addressed by using the immunotoxin 192 immunoglobulin (Ig)G-saporin (SAP) to destroy the choliner- gic cells specifically (Pizzo et al., 1999). It has been found that the cortical activation by both histamine and nora- drenaline is mediated via the BF cholinergic cells (Lelkes et al., 2013; Zantet al., 2012), whereas these neurones do not seem to be important for the arousing action of hypocretin (Blanco-Centurionet al., 2006).
Glutamatergic neurones form the backbone of the cortical- activating and behavioural-arousal systems (Jones, 2005).
BF receives glutamatergic innervations from various areas, including the cortex, the amygdala and some regions of the brain stem (Fuller et al., 2011; Sarter and Bruno, 1999).
Glutamate (GLUT) receptors are expressed in the BF (De Souza Silva et al., 2006; Martin et al., 1993), and local application of GLUT agonists into the BF results in EEG activation, W enhancement (Cape and Jones, 2000; Manfridi et al., 1999; Wigrenet al., 2007) and an increase in cortical acetylcholine release. The amount of acetylcholine released correlates with the gamma power in the EEG, indicating that BF cholinergic neurones may participate in the mediation of arousal (Fournier et al., 2004). However, both cholinergic and non-cholinergic neurones in the BF are innervated by glutamatergicfibres and activated by GLUT agonists (Cape and Jones, 2000; Huret al., 2009), and it is not clear to what extent BF cholinergic versus non-cholinergic cells contribute to the mediation of the arousing effect of GLUT. The aim of the present study was to clarify the role of BF cholinergic neurones in the mediation of the arousing effect of GLUT on cortical activity. We administered N-methyl-D-aspartate (NMDA), a GLUT agonist locally into the BF, in the vicinity of the horizontal diagonal band (HDB), substantia innominata (SI) and magnocellular pre-optic nucleus (MCPO), and recorded the sleep–wake activity before and after the administration of NMDA in intact rats and also after selective destruction of the BF cholinergic cells by means of a microinjection of the immunotoxin SAP.
M E T H O D S
Animals and surgery
Under general anaesthesia with isoflurane (FarmaPlus AS, Oslo, Norway; induction: 3–5% in an induction chamber, maintenance: 1.5% delivered by mask inhalation), after the infiltration of 1% lidocaine (Orion Oy, Espoo, Finland) into the tissues over the skull, male Han–Wistar rats (370–400 g;
n=16; Harlan Laboratories, Venray, the Netherlands) were implanted with EEG (gold-plated screws, epidurally over the frontal and parietal cortices) and electromyogram (EMG) electrodes (silver wires covered by Teflon, into the neck muscles). A unilateral microdialysis guide cannula (CMA/11 Guide; CMA/Microdialysis, Stockholm, Sweden) was implanted in such a way that the tip was located 2 mm above the target area in the BF (HDB/SI/MCPO; AP= 0.3;
ML =2.0; V=6.5; Paxinos and Watson, 1998). After the surgery, the rats were housed individually under conditions of controlled temperature (22 +1 °C) and light (lights on: 8:30–
20:30 hours) with access to food and water ad libitum. All procedures were approved by the Ethics Committee for Animal Experiments at the University of Helsinki and the provincial Government of Uusimaa, Finland (ESAVI-5028- 04.10.07-2014), and were in accordance with the relevant Finnish and European Union laws. All efforts were made to minimize the number of animals used and their suffering.
Recording
The EEG and EMG signals were amplified, filtered (high- pass: 0.3 and 10 Hz for the EEG and EMG, respectively;
low-pass: 100 Hz) and sampled at 278 and 139 Hz for the EEG and EMG, respectively. Vigilance states [W, non-REM (NREM) and REM sleep] were scored manually in 4-s epochs according to standard criteria, as described previ- ously (Lelkeset al., 2013); in addition, power spectra values were calculated by fast-Fourier transformation for consecu- tive 4-s epochs with the aid of the Spike2 program version 6 (Cambridge Electronic Devices, Cambridge, UK) using the script Sleepscore version 1.01. Vigilance-state-specific EEG delta (1–4 Hz), low theta (4–6 Hz), high theta (6–9 Hz), alpha (9–13 Hz) and beta (13–30 Hz) powers were calculated.
Microdialysis and NMDA administration
Under isoflurane anaesthesia, microdialysis probes (CMA/
Microdialysis, Kista, Sweden; CMA 11, 6000 Da, membrane length 2 mm, diameter 0.24 mm) were inserted through the guide cannula into the HDB/SI/MCPO (AP = 0.3; ML=2.0;
V=8.5; Paxinos and Watson, 1998) at least 2 days before the start of thefirst experiment. The rats were then connected to the microdialysis tubing (and also to the recording leads) and remained connected continuously until the end of the experiments. The microdialysis tubing was connected to a microdialysis pump between 09:30 and 10:00 hours, and continuous perfusion was started at 10:00 hours and termi- nated at 20:00 hours, the tubing then being disconnected from the microdialysis pump. Artificial cerebrospinal fluid (CSF; NaCl 147 mM; KCl 3 mM; CaCl2 1.2 mM; MgCl2
1.0 mM) or NMDA (Sigma-Aldrich, Co., St Louis, MO, USA;
0.3 mM, dissolved in CSF) was pumped through the micro- dialysis probe (1 lL/min) according to the experimental schedule (see below). This relatively long-lasting perfusion prevented blocking of the probe and tubing.
Lesioning of BF cholinergic structures by administration of the immunotoxin SAP
In eight rats, SAP (0.23 lg in 1lL, flow rate: 0.1lL/min;
Chemicon International, Inc., Temecula, CA, USA; batch
#0703054253) was injected into the HDB/SI/MCPO as
described previously (Kalinchuk et al., 2008). The eight control (intact) rats received the same volume of vehicle.
Experimental schedule
After the surgery, SAP (n =8, lesioned animals) or vehicle [n=8, control (intact) animals] was injected into the BF. Two weeks later, after recovery and adaptation to the recording conditions, the microdialysis probe targeted into the BF was perfused with CSF during the period 10:00–20:00 hours on the baseline day and with NMDA during the period 10:00–
13:00 hours, and then with CSF until the end of perfusion (13:00–20:00 hours) on the subsequent NMDA day. The sleep–wake activity was recorded for 24 h, starting at 10:00 hours on both days.
Histological verification of probe locations and SAP lesioning
After thefinal experiment, the animals received a lethal dose of pentobarbital [100 mg/kg; Mebunatintraperitoneally (i.p.);
Orion Pharma Oy, Espoo, Finland]. Ink was injected through a modified microdialysis probe inserted into the guide cannula. To verify only the probe location, the brain was removed, stored at 80, cut, stained with Toluidine blue and inspected visually, as described previously (Lelkes et al., 2013; Fig. 1). In case of cholinergic lesion by SAP, the loss of cells was verified by choline acetyltransferase (ChAT) stain- ing. Under deep anaesthesia (100 mg/kg pentobarbital) the animals were perfused transcardially with 0.9% saline followed by 4% paraformaldehyde (PFA) in 0.1 M PBS, pH 7.4. The brains were then removed, submerged overnight in 4% PFA and then in 30% sucrose solution for 4 days, cut and stained. The sample preparation and immunohistochemistry with goat anti-ChAT antibody (Chemicon; AB144P, 1 : 250) were performed as conducted by Borgeset al.(2013). The number of ChAT-positive cells on the SAP treated side was compared to that on the untreated control side (Fig. 1).
Statistics
All statistical analyses were performed on 3-h values of the states of vigilance and those of the powers of the various EEG frequency bands with the Statistica 12 program (StatSoft Inc., Tulsa, OK, USA). The baseline day data of the control versus those of the lesioned rats and the baseline versus NMDA day data of the control and lesioned animals were compared by two- and three-way analysis of variance (ANOVA) for repeated measures in the vigilance state and power density data, respectively. In general, theF-statistics are reported only for the treatment effect and the interactions with the treatment effect when the differences proved to be statistically significant. The Tukey test was used forpost-hoc comparisons to test the effects of NMDA in the various 3-h time bins. To test the influence of SAP lesioning on the effects of NMDA, when NMDA induced significant changes
(sleep: initial 3-h values, power density values: second and third 3-h values), data were compared among the baseline and NMDA days of the control (intact) and the SAP-lesioned animals by means of two- and four-wayANOVAs for repeated measures in the sleep and power density data, respectively.
Values ofP<0.05 were considered to be significant.
R E S U L T S
Distribution of vigilance states
In the control (intact) animals, NMDA exhibited a robust arousal effect during the perfusion of the drug (10–13 h, shown in Fig. 2). The daily distributions of W, NREM and REM sleep were changed significantly (ANOVA, time of day9treatment interaction; W: F(7,49)=9.325, P<0.05; NREM: F(7,49)= 9.692, P<0.05; REM: F(7,49)=4.645, P<0.05). W was enhanced (baseline day: 29.73.1%, NMDA day:
71.74.5%) and NREM (baseline day: 59.6 2.1%, NMDA day: 26.0 4.0%) and REM (baseline day: 10.71.3, NMDA day: 2.4 0.8%) were suppressed by NMDA in the initial 3-h period, i.e. during the NMDA perfusion (Tukey:
P<0.05). This arousal effect was followed by an opposite reaction, resulting in the tendency to decrease in W and increase in NREM and REM sleep.
The lesioning of the cholinergic structures in the BF by SAP did not change the baseline sleep–wake activity significantly; nor was the arousing effect of NMDA modified greatly. The daily distribution of W was changed (ANOVA, time of day9treatment interaction:F(7,49)=8.286,P<0.05) and W was enhanced by NMDA (ANOVA,F(1,7) =7.735,P<0.05), the increase proving significant in the initial 3-h period (baseline day: 26.8 5.1%, NMDA day: 71.9 4.5%), i.e.
also in the lesioned animals during the NMDA perfusion (Tukey:P<0.05). The daily distribution of NREM and REM sleep was also changed significantly (ANOVA, time of day9treatment interaction; NREM: F(7,49)=13.681, P<0.05; REM:F(7,49)=7.929,P<0.05). NREM (baseline day: 61.6 3.6%, NMDA day: 25.2 4.2%) and REM (baseline day: 11.51.8%, NMDA day: 2.1 0.7%) were also suppressed by NMDA in the initial 3-h period, i.e. during the NMDA perfusion (Tukey:P<0.05) in the lesioned rats. In contrast to the changes in the control (intact) rats, in the lesioned animals this arousal effect was not followed by an opposite reaction immediately; the tendency to decrease in W and increase in NREM and REM sleep was noted only later.
As NMDA enhanced W and suppressed NREM and REM sleep in the initial 3-h period (i.e. during the NMDA perfusion), these 3-h values [baseline and NMDA days in the control (intact) and the lesioned rats] were compared by ANOVA. NMDA enhanced W (F(1,14)=87.272, P<0.05) and sup- pressed NREM (F(1,14)=84.815, P<0.05) and REM (F(1,14)=47.756, P<0.05), but the lesioning with SAP did not influence these effects of NMDA significantly (there were no lesion9treatment interactions).
Power spectrum analysis
In the control (intact) rats, NMDA perfusion did not result in any significant change in the power spectra of the EEG during W (ANOVA); however, significant alterations were found during NREM sleep. The distribution of power across the various frequency bands (ANOVAfrequency band9treatment interaction:F(4,28)=4.615, P<0.05) and the daily distribu- tion of power in the various frequency bands (ANOVA, time of day9treatment interaction: F(7,49)=4.665, P<0.05; time of day9frequency band9treatment interaction:F(28,196)= 3.072,P<0.05) were changed. Delta power was increased significantly during the third 3-h period (16–19 h in Fig. 3) of the recording (Tukey: P<0.05), i.e. following the suppres- sion of sleep. Thus, during the NMDA perfusion only tendency-like changes were noted; the most characteristic was a tendency towards an increase in the high-frequency theta band (which corresponds to the frequency range of the
rhythmic hippocampal theta activity) during W. A significant change, an increase in delta power during NREMS, was observed only in the post-NMDA period, i.e. following the suppression of sleep by NMDA.
The lesioning of cholinergic structures in the BF by SAP did not change the baseline EEG power spectra significantly (ANOVA); nor were the effects of NMDA modified greatly.
During W, NMDA did not change the power density values significantly (ANOVA). During NREM sleep the daily distribution of power in the various frequency bands were changed (ANOVA, time of day9treatment interaction: F(7,49)=8.83, P<0.05; time of day9frequency band9treatment inter- action:F(28,196)=6.258,P<0.05). Theta power, in both the low- and high-frequency theta bands, was increased in the second 3-h period (13–16 h in Fig. 3) and delta, alpha and beta powers were enhanced in the third 3-h period (16–19 h in Fig. 3; i.e. significant changes were noted in the post- NMDA period; Tukey:P<0.05).
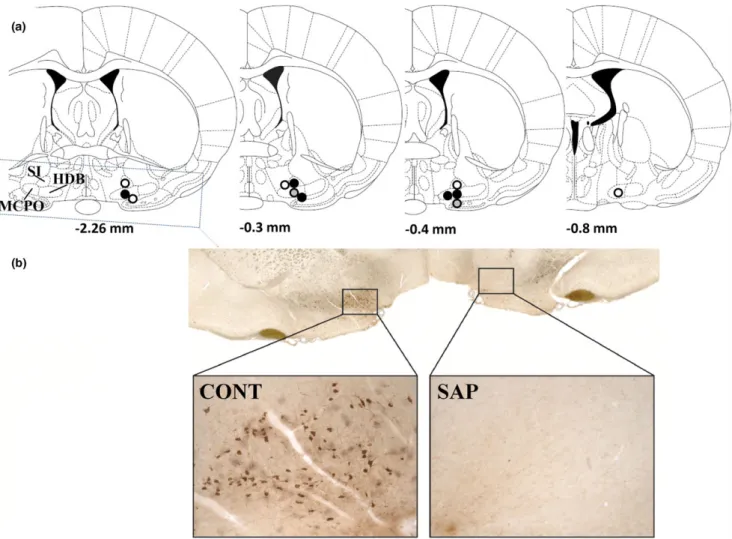
Figure 1.(a) Probe tip locations. All probe tips were located between 0.26 and 0.80 mm from the bregma (Paxinos and Watson, 1998). The circles indicate the locations of the probe tips; if more than one tip was located in the same place, only one representative circle is depicted;
open symbols: locations in control (intact) animals; closed black symbols: locations in lesioned animals; closed grey symbols: the same location in a control (intact) and a lesioned animal. (b) Effect of saporin (SAP) treatment on the number of choline acetyltransferase (ChAT)-positive cells in the basal forebrain (BF). On the SAP-treated side the number of ChAT-positive cells was 3.1% of that on the control side. CONT: control side;
SAP: SAP-treated side.
Because, during NREM sleep, NMDA induced significant changes in the power of the individual frequency bands during the second and third 3-h periods (i.e. in post-NMDA periods), changes in power density values in these time- periods were compared between the groups of control (intact) and lesioned rats by ANOVA. The distribution of power throughout the various frequency bands was changed by NMDA (ANOVA, frequency band9treatment interaction:
F(4,56)=38.633, P<0.05; time of day9frequency band9treatment interaction:F(4,56)=3.755,P<0.05), but there was no statistical difference in this action between the control (intact) and lesioned rats, and only some tendencies to differ were noted. The enhancement of delta power by NMDA tended to be greater in the control (intact) animals than in the lesioned animals. In the lesioned rats the increase in power appeared to be shifted a little to the lower frequency bands. The enhancement of power in the theta, alpha and beta ranges reached the level of statistical significance only in the lesioned rats (Fig. 3).
D I S C U S S I O N
We have reported previously that the local administration of SAP into the BF destroyed the cholinergic cells effectively and selectively (Kalinchuket al., 2008); now the same dose of SAP was administered using exactly the same procedure.
The main finding of the present study was that specific destruction of the BF cholinergic neurones by SAP did not prevent cortical arousal induced by NMDA administration in the BF, indicating that the effects of GLUT are mediated by projection neurones other than the cholinergic ones.
Local administration of NMDA via microdialysis enhanced W. Usually, administration of substances via microdialysis effects tissues near the probe. The concentration of the administered substance declines sharply with increasing the distance from the probe. The BF is a relatively large brain area, so we have reason to believe that NMDA acted locally there. NMDA administered into the BF via another route (microinjection) also has an arousing action (Cape and Figure 2.Effects of N-methyl-D-aspartate (NMDA) perfusion on sleep–wake activity in control (intact) rats and after the selective lesioning of the cholinergic cells in the basal forebrain (BF) by the microinjection of saporin (SAP). The horizontal grey bars at the top indicate the NMDA perfusion (0.3 mM) in the BF on the NMDA day; cerebrospinalfluid (CSF) was perfused on the control day. The curves display the daily patterns of W, non-rapid eye movement (NREMS) and rapid eye movement (REMS) sleep. The data are computed for consecutive 3-h bins and expressed as percentages of the recording time [mean valuesstandard error (SE)]. Open symbols: baseline (CSF) day; closed symbols:
NMDA day. The light and dark horizontal bars on thex-axis indicate light and dark phases, respectively. Asterisks denote significant differences from the baseline (Tukey,P<0.05).
Jones, 2000), and optogenetic and chemogenetic stimulation of the BF cells can enhance W (Anaclet et al., 2015; Xu et al., 2015; Zant et al., 2016). An increase in adenosine level was detected during administration of NMDA into the BF via microdialysis (Wigren et al., 2007). These lines of evidence support the view that NMDA acted locally in the BF, and the enhancement of W was due exclusively, or to a large extent, to this local action. However, we could not measure the NMDA concentrations in the tissues and thus cannot exclude completely the possibility that low
concentrations of NMDA also reached brain areas outside the BF. Intrahypothalamic administration of NMDA can also enhance W (Kostinet al., 2014). Ourfindings of increased W and decreased NREM and REM sleep by NMDA adminis- tration in intact rats are consistent with our earlier observa- tions (Wigren et al., 2007) and with those of Manfridi et al.
(1999) and Cape and Jones (2000), and they are also in line with the role of glutamatergic transmission and the BF NMDA receptors in the mediation of the effects of the ascending activating system. Similarly to the awakening action of Figure 3.Effects of N-methyl-D-aspartate (NMDA) perfusion on the vigilance-state specific electroencephalogram (EEG) power spectrum in control (intact) rats and after the selective lesioning of the cholinergic cells in the BF by the microinjection of saporin (SAP). The horizontal grey bars at the top indicate the NMDA perfusion. The curves display changes in the power of the various frequency bands compared to the corresponding baseline values. The data are computed for consecutive 3-h bins and expressed as percentages of the baseline values [mean valuesstandard error (SE)]. Open symbols: control (intact) rats; closed symbols: lesioned rats. The light and dark horizontal bars on thex- axis indicate light and dark phases, respectively. Circles above the symbols denote significant differences from the baseline; open circles:
control (intact) rats; closed circles: lesioned rats (Tukey,P<0.05).
NMDA, the cortical activation induced by the administration of hypocretin into the BF was reported not to be abolished by the destruction of the cholinergic neurones (Blanco-Centurion et al., 2006).
Interestingly, similar experiments involving the administra- tion of histamine (Zant et al., 2012) or a noradrenaline agonist, methoxamine (Lelkes et al., 2013), into the BF revealed that, while the administration of these drugs into intact rats effectively induced cortical arousal, after destruc- tion of the BF cholinergic cells with SAP these effects were abolished, indicating that the arousing effects of both histamine and noradrenaline are mediated by BF cholinergic cells.
As shown by the present study, the integrity of the non- cholinergic neurones in the BF is sufficient for the induction of cortical activation by NMDA. Cortically projecting GABAergic and/or glutamatergic neurones in the BF may mediate the arousing action of NMDA. While it appears that cholinergic neurones are not essential in NMDA-induced cortical arousal, there is clear evidence that GLUT regulates the BF cholinergic cells: administration of GLUT agonists into the BF activates the cholinergic cells (as shown by the enhancement of c-Fos expression) and increases cortical acetylcholine release, which correlates with the gamma power in the EEG (Cape and Jones, 2000; Fournier et al., 2004). Parvalbumin-containing GABAergic neurones in the BF enhance W and are excited by cholinergic cells (Anaclet et al., 2015; Xu et al., 2015; Yang et al., 2014). The W- promoting action of BF cholinergic neurones is mediated by cortically projecting BF non-cholinergic cells (Zant et al., 2016). However, parvalbumin-containing GABAergic neu- rones can also be excited directly by glutamatergic cells (Xu et al., 2015). Thus, this can be an alternative route for mediating the arousing action of GLUT without the contri- bution of BF cholinergic neurones. The baseline sleep was little affected by the BF cholinergic lesion. Thisfinding is in line with our earlier observation (Lelkes et al., 2013) and also with that of Kauret al.(2008), who reported only small transient changes in sleep after BF SAP lesion. BF non- cholinergic neurones alone are enough for maintaining normal sleep–wake activity in baseline conditions when sleep is not disturbed, but not for mediating all types of arousing action from the ascending activating system. For example, the integrity of the cholinergic structures in the BF is important for mediation of the arousing effect of nora- drenaline and histamine (Lelkes et al., 2013; Zant et al., 2012).
All these lines of evidence support the view that both cholinergic and non-cholinergic neurones in the BF operate jointly in the control of cortical activation (Fulleret al., 2011) and in mediation of the effects of the ascending activating system.
The cholinergic neurones in the BF have a particular role in the induction of recovery sleep. Recovery sleep is the additional sleep experienced after a prolonged W period, and is regarded as a sign of the homeostatic regulation of
sleep (Borbely, 1982). In response to a lesion that specif- ically destroys the cholinergic cells in this area, a prolonged W period is no longer able to induce increases in either sleep duration or slow wave activity (Kalinchuket al., 2008;
Porkka-Heiskanen et al., 1997). In the present study, suppression of NREM and REM sleep by NMDA in the intact rats was followed by an increase in EEG delta activity during NREM sleep and rebound-like tendencies to increase NREM and REM sleep shortly after cessation of the deprivation. A similar increase in EEG delta activity follow- ing administration of NMDA into the BF has already been reported (Wigren et al., 2007). BF administration of NMDA results in an increased release of adenosine (Wigrenet al., 2007), which may be involved in the mechanism of recovery sleep (Porkka-Heiskanen et al., 1997). All these lines of evidence indicate the activation of homeostatic regulatory mechanisms. EEG delta activity was also enhanced in the SAP-lesioned animals; however, no rebound-like tendencies to increase sleep were observed immediately after the suppression of sleep, though small compensatory increases in NREM and REM sleep were noted later. In previous studies with histamine and noradrenaline agonists, the compensatory increases were abolished by the cholinergic lesion in the histamine-treated animals (Zant et al., 2012;
personal communication), while some rebound-like tenden- cies were still present after the lesion in the methoxamine- treated animals (Lelkes et al., 2013). Observations that the SAP lesion abolished the rebound-like increases of sleep following histamine administration and the compensatory tendency to increase sleep immediately after the NMDA- induced sleep suppression are in line with the role of BF cholinergic cells in the homeostatic sleep regulatory mech- anisms. However, the presence of enhancement in delta power, the late tendency to compensatory increase in sleep following the NMDA-induced sleep suppression and the tendency to compensatory increase in sleep following the methoxamine-induced sleep suppression in the lesioned rats may indicate that non-cholinergic mechanisms are also involved in the mechanism of recovery sleep.
A C K N O W L E D G E M E N T S
We thank David Durham for revising the English of the manuscript. The work was supported by the Academy of Finland.
C O N F L I C T O F I N T E R E S T
We have nofinancial interests to disclose and no conflicts of interest.
A U T H O R C O N T R I B U T I O N S
ZL and TP-H designed the study and wrote the paper. ZL conducted the experiments, SA performed the histological verification of the SAP lesioning.
R E F E R E N C E S
Anaclet, C., Pedersen, N. P., Ferrari, L. L. et al.Basal forebrain control of wakefulness and cortical rhythms.Nat. Commun., 2015, 6: 8744.
Blanco-Centurion, C. A., Shiromani, A., Winston, E. and Shiromani, P. J. Effects of hypocretin-1 in 192-IgG-saporin-lesioned rats.Eur.
J. Neurosci., 2006, 24: 2084–2088.
Borbely, A. A. A two process model of sleep regulation. Hum.
Neurobiol., 1982, 1: 195–204.
Borges, S., Coimbra, B., Soares-Cunha, C. et al. Glucocorticoid programing of the mesopontine cholinergic system.Front. Endo- crinol., 2013, 4: 190.
Cape, E. G. and Jones, B. E. Effects of glutamate agonist versus procaine microinjections into the basal forebrain cholinergic cell area upon gamma and theta EEG activity and sleep–wake state.
Eur. J. Neurosci., 2000, 12: 2166–2184.
De Souza Silva, M. A., Dolga, A., Pieri, I.et al.Cholinergic cells in the nucleus basalis of mice express the N-methyl-d-aspartate-receptor subunit NR2C and its replacement by the NR2B subunit enhances frontal and amygdaloid acetylcholine levels.Genes Brain Behav., 2006, 5: 552–560.
Detari, L., Rasmusson, D. D. and Semba, K. The role of basal forebrain neurons in tonic and phasic activation of the cerebral cortex.Prog. Neurobiol., 1999, 58: 249–277.
Fournier, G. N., Materi, L. M., Semba, K. and Rasmusson, D. D.
Cortical acetylcholine release and electroencephalogram activa- tion evoked by ionotropic glutamate receptor agonists in the rat basal forebrain.Neuroscience, 2004, 123: 785–792.
Fuller, P., Sherman, D., Pedersen, N. P., Saper, C. B. and Lu, J.
Reassessment of the structural basis of the ascending arousal system.J. Comp. Neurol., 2011, 519: 933–956.
Hassani, O. K., Lee, M. G., Henny, P. and Jones, B. E. Discharge profiles of identified GABAergic in comparison to cholinergic and putative glutamatergic basal forebrain neurons across the sleep- wake cycle.J. Neurosci., 2009, 29: 11828–11840.
Henny, P. and Jones, B. E. Projections from basal forebrain to prefrontal cortex comprise cholinergic, GABAergic and glutamater- gic inputs to pyramidal cells or interneurons. Eur. J. Neurosci., 2008, 27: 654–670.
Hur, E. E., Edwards, R. H., Rommer, E. and Zaborszky, L. Vesicular glutamate transporter 1 and vesicular glutamate transporter 2 synapses on cholinergic neurons in the sublenticular gray of the rat basal forebrain: a double-label electron microscopic study.Neuro- science, 2009, 164: 1721–1731.
Jones, B. E. From waking to sleeping: neuronal and chemical substrates.Trends Pharmacol. Sci., 2005, 26: 578–586.
Kalinchuk, A. V., McCarley, R. W., Stenberg, D., Porkka-Heiskanen, T. and Basheer, R. The role of cholinergic basal forebrain neurons in adenosine-mediated homeostatic control of sleep: lessons from 192 IgG-saporin lesions.Neuroscience, 2008, 157: 238–253.
Kaur, S., Junek, A., Black, M. A. and Semba, K. Effects of ibotenate and 192IgG-saporin lesions of the nucleus basalis magnocellularis/
substantia innominata on spontaneous sleep and wake states and on recovery sleep after sleep deprivation in rats. J. Neurosci., 2008, 28: 491–504.
Kostin, A., Siegel, L. M. and Alam, N. Lack of hypocretin attenuates behavioral changes produced by glutamatergic activation of the perifornical-lateral hypothalamic area. Sleep, 2014, 37: 1011– 1020.
Lelkes, Z., Porkka-Heiskanen, T. and Stenberg, D. Cholinergic basal forebrain structures are involved in the mediation of the arousal effect of noradrenaline.J. Sleep Res., 2013, 22: 721–726.
Manfridi, A., Brambilla, D. and Mancia, M. Stimulation of NMDA and AMPA receptors in the rat nucleus basalis of Meynert affects sleep.
Am. J. Physiol. Regul. Integr. Comp. Physiol., 1999, 277: R1488– R1492.
Martin, L. J., Blackstone, C. D., Levey, A. I., Huganir, R. L. and Price, D. L. Cellular localizations of AMPA glutamate receptors within the basal forebrain magnocellular complex of rat and monkey. J.
Neurosci., 1993, 13: 2249–2263.
Paxinos, G. and Watson, C.The Rat Brain In Stereotaxic Coordi- nates. Academic Press, San Diego, CA, 1998.
Pizzo, D. P., Waite, J. J., Thal, L. J. and Winkler, J. Intraparenchymal infusions of 192 IgG-saporin: development of a method for selective and discrete lesioning of cholinergic basal forebrain nuclei.J. Neurosci. Methods, 1999, 91: 9–19.
Porkka-Heiskanen, T., Strecker, R. E., Thakkar, M., Bjorkum, A. A., Greene, R. W. and McCarley, R. W. Adenosine: a mediator of the sleep-inducing effects of prolonged wakefulness.Science, 1997, 276: 1265–1268.
Sarter, M. and Bruno, J. P. Cortical cholinergic inputs mediating arousal, attentional processing and dreaming: differential afferent regulation of the basal forebrain by telencephalic and brainstem afferents.Neuroscience, 1999, 95: 933–952.
Szerb, J. C. Cortical acetylcholine release and electroencephalo- graphic arousal.J. Physiol., 1967, 192: 329–343.
Szymusiak, R. Magnocellular nuclei of the basal forebrain: substrates of sleep and arousal regulation.Sleep, 1995, 18: 478–500.
Wigren, H. K., Schepens, M., Matto, V., Stenberg, D. and Porkka- Heiskanen, T. Glutamatergic stimulation of the basal forebrain elevates extracellular adenosine and increases the subsequent sleep.Neuroscience, 2007, 147: 811–823.
Xu, M., Chung, S., Zhang, S.et al.Basal forebrain circuit for sleep– wake control.Nat. Neurosci., 2015, 18: 1641–1647.
Yang, C., McKenna, J. T., Zant, J. C., Winston, S., Basheer, R. and Brown, R. E. Cholinergic neurons excite cortically projecting basal forebrain GABAergic neurons.J. Neurosci., 2014, 34: 2832–2844.
Zant, J. C., Rozov, S., Wigren, H. K., Panula, P. and Porkka- Heiskanen, T. Histamine release in the basal forebrain mediates cortical activation through cholinergic neurons.J. Neurosci., 2012, 32: 13244–13254.
Zant, J. C., Kim, T., Prokai, L.et al.Cholinergic neurons in the basal forebrain promote wakefulness by actions on neighboring non- cholinergic neurons: an opto-dialysis study.J. Neurosci., 2016, 36:
2057–2067.