E
DUCATIONAL ACHIEVEMENT IN SOCIAL AND INTERNATIONAL CONTEXTSBenő Csapó, József Balázs Fejes, László Kinyó and Edit Tóth
Hungary has participated in international educational surveys from the very beginning in the 1970s, and so changes in educational achievement may be analysed over several decades. In this chapter, we first review changes in ed- ucational outcomes and compare them to results from other countries. In the second part, we explore data that indicate crucial educational issues in the so- cial context, highlighting the weak contribution that education makes to re- ducing social inequalities and improving the job-market prospects of children in disadvantaged social groups.
1. Achievement among Hungarian students in the international context From the 1970s until early in the new century, the main frame of reference used in educational assessment was the International Association for the Eval- uation of Educational Achievement (IEA). Its first and second mathematics and science assessments (in 1970–71 and 1980–84) were followed by the Third International Mathematic and Science Study (TIMSS). In 1995, the en- tire programme was renamed the Trends in International Mathematics and Sci- ence Study (maintaining the same acronym); it assessed fourth- and eighth- grade students. The Progress in International Reading Literacy Study (PIRLS) surveys are also run by IEA; they assess reading comprehension at Grade 4.
The most comprehensive international educational assessment programme is the Programme for International Student Assessment (PISA), which was launched by the OECD in 2000. It explores 15-year-old students’ knowledge and skills in reading, mathematics and science. Each assessment cycle con- centrates on one domain in particular (e.g. reading in 2000, mathematics in 2003, science in 2006, etc.); that domain receives more attention (is covered by more items), which provides an opportunity to analyse progress in sub- domains. This allows more precise scales to be created and developmental trends to be estimated more accurately.
TIMSS and PISA are based on different assessment philosophies, use different assessment methods (e.g. grade-based vs. age-based sampling) and have dif- ferent groups of participating countries. The results thus offer differing feed- back on education policy and practice among participants. The content of IEA tests is close to school curricula, whereas PISA places greater emphasis on relevant aspects of students’ knowledge and on the competencies that young people need in modern societies. PISA data may be added to the OECD’s rich social and economic statistical databases, thus allowing sophisticated analysis of relationships using a number of contextual variables.
Beyond assessing knowledge, each assessment programme collects data on students in other, non-cognitive domains (e.g. learning strategies, motivation and attitudes), as well as on schools and the social background of families. An aggregated index (Index of Economic Social and Cultural Status) was created out of several variables (e.g. parents’ educational attainment and the number of books possessed by a family) to represent students’ socio-economic status with a single variable.
1.1 Reading
The concept of ‘knowledge’ – the interpretation of what reading actually means in the reading tests assessed by the IEA – has been constantly evolving since the 1970s. Earlier on (1970–71), reading was perceived as essentially linguistic ability. However, since the second IEA assessment (1990–91), it has also been viewed as a cultural asset; and since the turn of the century, the focus of PIRLS assessments for 10-year-olds has shifted increasingly towards meas- uring applicable, transferable knowledge (D. Molnár et al., 2012).
The first IEA reading assessment (1970–71) painted a depressing picture of Hungarian students’ reading skills (among 10-, 14- and 17-year-olds): our stu- dents were last or next to last in the rankings (Kádárné, 1979). Our fourth- grade students scored 459 points in the IEA’s reading assessment in 1991. The 2001 assessment (now known as PIRLS) introduced a new scale, employing a mean of 500 (with a standard deviation of 100). In this 2001 assessment, Hungarian students scored 543 points (475 points on the old scale), marking a significant improvement in their performance (Martin et al., 2003). In 2006, they achieved 551 points (Mullis et al., 2007), demonstrating a further im- provement in reading skills. However, the results of the 2011 PIRLS assess- ment were less encouraging (539 points) (Mullis et al., 2012b). In the most recent assessment (2016), the results were almost the same as in 2006 (554 points).
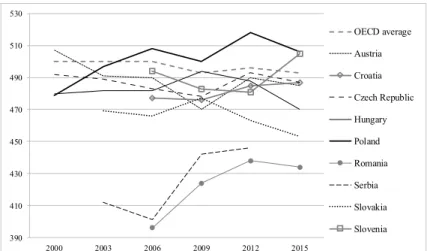
Figure 1 Reading results for Hungary and its neighbours in the OECD PISA assessments between 2000 and 2015
Source: OECD (2001; 2004; 2007; 2010a; 2013a; 2016).
The OECD’s PISA reading results are a cause for concern. The Hungarian results were below the OECD average in 2000, 2003 and 2006 (480, 482 and 482 points, respectively) (Figure 1). The distribution of students’ performance was also disappointing: the proportion of students with lower levels of profi- ciency was higher than the OECD average – and even those with a higher proficiency level did not reach the OECD average. In the 2009 assessment, our reading performance improved to 494 points, and the performance of stu- dents with a lower or higher proficiency level also improved (Balázsi et al., 2010).
Assessments in 2012 indicated a slight drop (to 488 points), but the effects of the previous improvement could still be felt. In 2015, however, the decline in students’ performance continued, and the average score of 470 points was the lowest ever measured in the history of the PISA assessments in Hungary.
Of the Visegrád countries and Hungary’s other near neighbours, Poland shows the best results. Although in the first assessment the level of perfor- mance of Polish students was the same as ours, the Polish education system has improved greatly. Up until 2012, the Czech Republic, Austria and Croatia were at roughly the same level as Hungary (OECD, 2013a). In 2015, while performance fell among Hungary’s neighbours generally, Slovenia managed to reverse a negative trend to rank as the best of the neighbouring countries;
390 410 430 450 470 490 510 530
2000 2003 2006 2009 2012 2015
OECD average Austria Croatia Czech Republic Hungary Poland Romania Serbia Slovakia Slovenia
meanwhile, the results from Hungary were still only (albeit significantly) bet- ter than those of Slovakia and Romania (Figure 1).
1.2 Mathematics
Hungary first participated in the IEA’s mathematics assessments during the Second International Mathematics Study (SIMS), run between 1979 and 1983.
There were two target groups: 13-year-olds (Grade 8) and students in the last year of high school. In Hungary, the older group consisted of students in both academically oriented secondary schools and vocational schools, whereas in many other countries only students from the former were selected. The results were promising: 13-year-old Hungarian students ranked fifth among the 14 participating countries (Robitaille and Garden, 1989).
In 1995, TIMSS was launched in its current format; the performance of Hungarian fourth-grade students was above average in that survey and has remained above ever since. Our fourth-graders’ results did not change signif- icantly in the next assessment (2003); however, in the 2007 assessment, their performance dropped significantly (by almost 20 points) and did not improve in 2011. Their average score in 2015 was 529 points – not significantly differ- ent from 1995 and 2003.
As for Grade 8 Hungarian students, they performed quite well in 1995 (an average score of 527 points, with a TIMSS average of 500 points); however, the results from the Czech Republic (564 points) and Slovakia (547 points) were even better (Vári and Krolopp, 1997). This TIMSS assessment in 1995 already predicted those areas in which Hungarian students would struggle in the OECD PISA assessments five years later. Not surprisingly, these included mathematical problem-solving tasks, which could not be solved ‘by rote’
(Csíkos and Vidákovich, 2012).
Hungary’s results in the next two TIMSS assessments (1999 and 2003) did not differ significantly from those of 1995 (Mullis et al., 2000; Martin et al., 2004); however, the results have been deteriorating since 2007 (Mullis et al., 2008; Mullis et al., 2012a; Mullis et al., 2016a; 2016b).
Our eighth-graders scored 505 points on average in the 2011 TIMSS as- sessment – the worst result ever in Hungary’s history of TIMSS assessments (Mullis et al., 2012a). The latest TIMSS assessments show no significant change in Hungary’s performance; thus, this negative tendency is a serious cause for concern in mathematics teaching in Hungary.
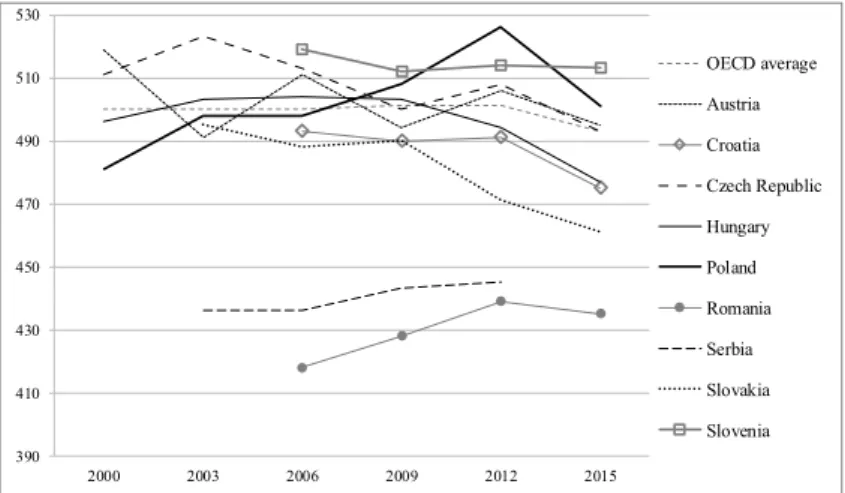
Figure 2 Mathematics results for Hungary and its neighbours in the OECD PISA assessments between 2000 and 2015
Source: OECD (2001; 2004; 2007; 2010a; 2013a; 2016).
The OECD PISA results came as quite a shock after the good results in earlier IEA assessments. In PISA, 15-year-old Hungarian students have consistently scored below the OECD average (Figure 2). The low score in the 2012 assess- ment (477 points) even placed Hungary on the (imaginary) border between developed and developing countries participating in PISA. Nor did we manage to improve on this unfortunate position in 2015, which suggests that the Hun- garian education system may have started on a downward spiral.
Hungary’s performance is significantly lower than that of its neighbours Austria, Slovenia, Poland and the Czech Republic. Only Croatia and Romania rank lower in the region (Figure 2).
1.3 Science
Hungary has participated in all IEA science assessments over the past 40 years. The first science assessment (1970–71) was a great success: our stu- dents were at the forefront in all age groups (Grades 4, 8 and 12). Furthermore, in the second assessment (1983–84) they performed even better: they drew ahead of Japan and Sweden to rank first among the participating countries (Keeves, 1992).
However, in the 1995 TIMSS assessment, third- and fourth-grade Hungar- ian students showed only average performance (Martin et al., 1997). Since
390 410 430 450 470 490 510 530
2000 2003 2006 2009 2012 2015
OECD average Austria Croatia Czech Republic Hungary Poland Romania Serbia Slovakia Slovenia
2003, performance among fourth-graders has been above average, and in the most recent assessment (2015) students scored 542 points. The eighth-graders performed slightly better in 1999; however, the assessments in 2003, 2007 and 2011 displayed a steady decline in performance (Martin et al., 2008, 2016).
Based on the results from the 2011 TIMSS assessment and the negative trend since 1995, we can say that Hungary’s science performance bears a resem- blance to its performance in mathematics. That is, over the past 20 years, Hun- gary’s science results have deteriorated considerably, and especially in the older age groups this negative trend has prevailed since the 1980s. Among European countries, the top positions have been occupied by Russia, Slovenia and England (Martin et al., 2012; Martin et al., 2016a).
Examining the PISA science assessments, we can see the same as in math- ematics. Hungary’s performance stagnated between 2000 and 2009, and then the next assessment showed a drop (Figure 3).
Figure 3 Science results for Hungary and its neighbours in the OECD PISA assessments between 2000 and 2015
Source: OECD (2001; 2004; 2007; 2010a; 2013a; 2016).
Although the science results were slightly better than those for reading and mathematics, Hungary’s performance in 2012 was below the OECD average, and this was followed by a steep decline in 2015. Hungary pulled ahead of its neighbours Romania and Slovakia; however, Poland, the Czech Republic, Austria and Slovenia all performed significantly better than we did (Figure 3).
390 410 430 450 470 490 510 530
2000 2003 2006 2009 2012 2015
OECD average Austria Croatia Czech Republic Hungary Poland Romania Serbia Slovakia Slovenia
Slovenia is worth noting: since it joined the PISA assessments, it has per- formed consistently well, and is top of the list of Hungary’s neighbours.
1.4 Countries exhibiting considerable development
In the PISA assessments, the results for two European countries – Germany and Poland – have improved considerably over just a few years, confirming that bold steps taken nationally can significantly boost student performance within a relatively short period of time. These countries provide good exam- ples of how disappointing trends can be changed in education.
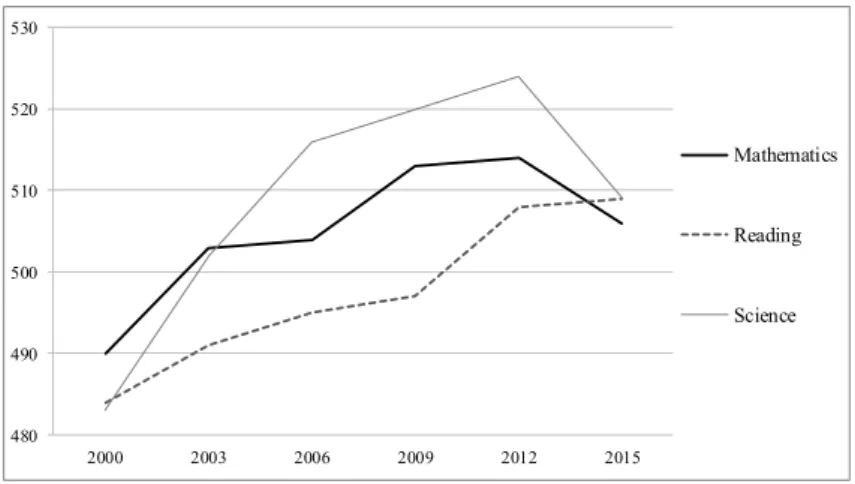
When Germany participated in the PISA assessment for the first time in 2000, German society was completely taken aback by the results: German stu- dents’ performance was nowhere near as good in an international context as had been thought. The results showed only a middle-level performance. This sparked discussion on the problems of the German education system in both academia and society. The Max Planck Institute for Human Development in Berlin undertook important educational research projects and performed a number of analyses after the PISA results were published. Numerous improve- ment programmes were launched both to help low-achieving students catch up and to develop more effective ways of teaching reading and science. As a result, German students’ performance improved steadily in all three domains – reading, mathematics and science – until 2012 (Figure 4).
The country witnessed the most meteoric improvement in science perfor- mance in the history of PISA assessments: in 2000, Germany was below the OECD average; by 2003, German students had reached that average; thereaf- ter – in the next three assessments – they performed significantly better than the average (B. Németh et al., 2012). Although this trend came to a halt in mathematics and science in 2015, reading results improved further (Figure 4).
While the countries of Poland and Hungary are similar with respect to his- tory and social and economic conditions, their results in the PISA assessments are quite different. Polish students comprehensively outperform Hungarian students: a smaller number drop out of school; the proportion of Polish stu- dents who perform at the highest proficiency level is more than double the proportion of Hungarian students; and while 20 per cent of Hungarian students are illiterate, the figure is only 10 per cent in Poland. The improvement in the performance of Polish students is most significant in mathematics: their results improved by 50 points between 2000 and 2012 (while among 15-year-old Hungarians, the results fell by 10 points in the same period). The Polish results can be attributed to a consistent educational development programme, whose impacts were just starting to show when the PISA assessments were launched.
Polish success is, for the most part, down to the fact that since the end of the 1990s the whole population of 15-year-olds has attended the same type of school.
Figure 4 Germany’s results in the main domains of the OECD PISA assessments between 2000 and 2015 (average scores)
Source: OECD (2001; 2004; 2007; 2010a; 2013a; 2016).
Examining the PISA results from a broader international perspective, we can see that some developing countries, such as Turkey, Kazakhstan, Malaysia, Brazil and China, are catching up quickly. Countries in East Asia seem to have understood the importance of investing in education and have made it a top economic priority to improve their education systems. Furthermore, even peo- ple on the margins of society clearly grasp that learning is the key to both success and mobility in society. The success of these countries can partly be explained by their flexibility and prompt willingness to reform their pedagog- ical culture: their previous, so-called ‘Prussian’ approach, which relied solely on rote learning and memorization, was quickly replaced with a practice-ori- ented model that focused on problem-solving. Vietnam, which participated in PISA for the first time in 2012, when it outshone a number of countries (in- cluding Hungary) in all three domains, is a typical example of this.
Among the European countries, Estonia is worth noting. Following their independence, Estonians launched an educational reform programme, intro- duced several elements of the Finnish model and reformed their teacher train- ing. The upshot is that Estonians ranked higher than their role model Finland in mathematics in 2012 and in both mathematics and science in 2015 (OECD, 2016).
480 490 500 510 520 530
2000 2003 2006 2009 2012 2015
Mathematics
Reading
Science
2. The role of schooling in promoting equity and social and economic progress
All over the world, most students with a lower socio-economic background perform below average at school. However, equity is an important character- istic of well-functioning school systems. In other words, these systems help students with lower socio-economic status to overcome their disadvantages;
educational systems with a lower level of equity cannot compensate for stu- dents’ disadvantages. Furthermore, those disadvantages increase over the years. Supporting low-achieving students to catch up goes far beyond the issue of equity: since basic reading skills and mathematical knowledge are essential if students are to progress in education and on the labour market, helping them gain those skills is fundamental to the economic interests of every nation.
There is no school system in the world with complete equity; however, some countries get much closer to it than others. When exploring the issue of equity in education, we rely primarily on PISA assessments, since they tend to pay special attention to it.
2.1 The impact of family background
One way of approaching equity in education is to compare the relationship between students’ economic, social and cultural status (ESCS) and their per- formance to that of other participating countries. The 2015 PISA assessment underlines what previous assessments had already confirmed: in Hungary, family background has an especially strong influence on students’ perfor- mance (OECD, 2004; 2007; 2010a; 2013c; 2016). Variables on the ESCS in- dex explain 21.6 per cent of the difference between Hungarian students’ per- formance in science. This is the second-highest percentage of all the 72 coun- tries and economies that participated in PISA in 2015. Moreover, it is well above the OECD average of 12.9 per cent (OECD, 2016).
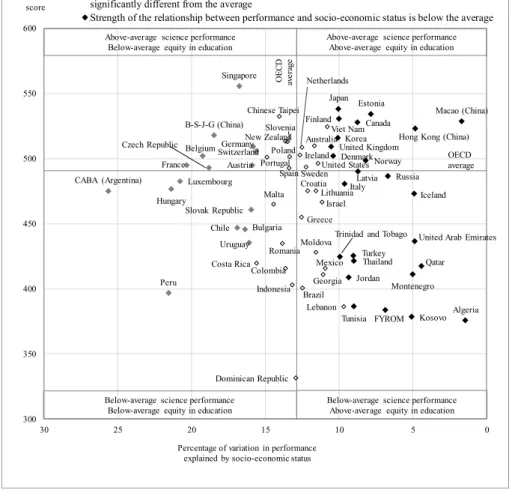
Figure 5 shows the relationship between the ESCS index and science per- formance in the 2015 assessment. School systems are grouped into four cate- gories, based on equity and performance. This is illustrated by dividing Figure 5 into four sections.
Figure 5 Mean performance in science and strength of the socio-economic gradient
Notes: The correlation between a country’s/economy’s mean science score and the strength of the socio- economic gradient is 0.17. Only countries and economies with available data are shown. B-S-J-G (China):
Beijing-Shanghai-Jiangsu-Guangdong; CABA (Argentina): Autonomous City of Buenos Aires.
Source: OECD (2016: 218).
The upper-right quadrant shows countries whose students performed above average, but where the influence of their family background on their perfor- mance was below average. The lower-left quadrant shows countries (includ- ing Hungary) where there is a strong relationship between family background
Singapore
B-S-J-G (China) Germany Switzerland Belgium
Austria France
Czech Republic
Luxembourg Hungary CABA (Argentina)
Slovak Republic Chile Bulgaria
Uruguay
Peru
Chinese Taipei
Viet Nam New ZealandSlovenia
Australia Netherlands
Ireland Poland
Portugal United States Sweden Spain
Lithuania Croatia
Israel Malta
Greece
RomaniaMoldova Costa Rica
Colombia Mexico Georgia Indonesia
Brazil Lebanon
Dominican Republic
Japan Estonia
Finland Macao (China)
Canada
Hong Kong (China) Korea
United Kingdom DenmarkNorway
Latvia Russia Italy
Iceland
United Arab Emirates Turkey
Trinidad and Tobago
Thailand Qatar Montenegro Jordan
Tunisia FYROM Kosovo Algeria
300 350 400 450 500 550 600
0 5
10 15
20 25
30 Mean science
score
Percentage of variation in performance explained by socio-economic status
Strength of the relationship between performance and socio-economic status is above the average Strength of the relationship between performance and socio-economic status is not statistically significantly different from the average
Strength of the relationship between performance and socio-economic status is below the average
OECD average
OECD average Above-average science performance
Below-average equity in education Above-average science performance Above-average equity in education
Below-average science performance Below-average equity in education
Below-average science performance Above-average equity in education
and student performance, and where performance is below average. Of the European countries, only Slovakia, Bulgaria and Luxembourg feature along- side Hungary in this quadrant. Reinforcing previous findings, this figure clearly indicates that above-average performance and a high level of equity are not mutually exclusive. The majority of those countries that perform well in PISA are ahead of others in supporting equity in education (OECD, 2016).
2.2 School differences in student achievement
One way of examining the selectivity of a school system is to examine stu- dents’ performance and family backgrounds between schools and within a par- ticular school. If schools admit students with divergent socio-economic status without substantial selection, then no major differences can be identified be- tween schools. However, if schools do select according to socio-economic background, they become more homogeneous and the gaps between schools increase.
The first time it became evident in an international context that the Hungar- ian school system is highly selective was when the data from the 2000 PISA assessment were analysed (OECD, 2001). More data analysis followed (OECD, 2004; 2007; 2010a; 2013c; 2016), as did Hungarian research, which reinforced this finding (e.g. Csapó, 2002; Kertesi and Kézdi, 2005; 2009;
2012; Tóth et al., 2010). The latest analysis of the PISA results once again confirms that even from an international perspective, the Hungarian school system is extremely selective. The ESCS index plays a negligible role in ex- plaining the differences within a particular school in Hungary in terms of sci- ence (0.3 per cent); however, 80.1 per cent of the gaps between schools can be attributed to students’ socio-economic background. Not only is this signif- icantly higher than the OECD average of 62.6 per cent, but it is also the highest rate of all the countries and economies participating in the 2015 assessments (OECD, 2016).
This suggests that the impact of socio-economic status on students’ perfor- mance prevails through the average student composition of schools, as in seg- regated schools students have less opportunity to interact with peers with dif- ferent backgrounds. As a result of selective mechanisms, ever more learning problems arise; teaching resources and school financial resources are stretched; adverse selection appears among teachers; and demotivational pro- cesses start to emerge. As a consequence, the disadvantages already present at the start of schooling are amplified in those schools where the proportion of disadvantaged students is high (see Fejes, 2012; Hermann, 2010; Kertesi and Kézdi, 2016; Papp, 2012; Varga, 2009). Segregation definitely plays a crucial
role: while there is a five-year difference in cognitive skills in the same cohort of students entering the school system in Hungary, this gap has doubled by the time students reach Grade 10 (Nagy, 1980; 2009).
The differences between schools also show up in the PIRLS and TIMSS assessments, which highlight the huge performance gaps between students even at Grade 4. The results of the latest TIMSS assessment show that for mathematics these differences are higher in Hungary than in any other partic- ipating European country (Mullis et al., 2016b). Analysing the IEA assess- ment data, we can explore how the disparities between schools have changed over the years. If we look at the data between 1991 and 2006, we can see that even before the turn of the century, there were significant differences in Hun- gary; these have hardly changed since. There are bigger gaps among older age groups, which again shows that instead of compensating for inequalities, the Hungarian school system further increases them. Inequalities also grow over the years in top-performing countries as well. But whereas in the best-per- forming countries a five-year gap in skills development has opened up by the end of primary school, as mentioned above Hungarian students actually enter the school system with this gap (Csapó et al., 2008).
The disparities are greater with respect to skills that are loosely related to the curriculum and are smaller with respect to subject-matter knowledge. This means that Hungarian schools are less effective at compensating for the dif- ferences in applicable knowledge and problem-solving skills (measured by PISA) than at compensating for less complex, curriculum-related knowledge (measured by IEA) (Csapó et al., 2008).
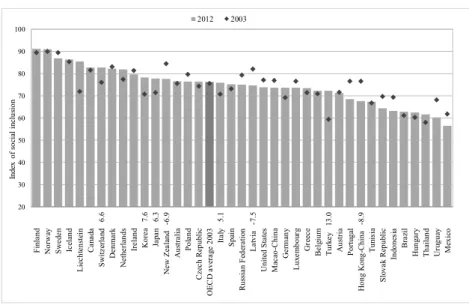
International assessments clearly indicate that Hungary is characterized by an extreme level of selectivity. The 2012 PISA report compares the ‘social inclusion index’ computed from the mathematics assessment results and ESCS for 2003 and 2012. This index represents the variance in the socio-eco- nomic status of students within schools. The results indicate no significant difference between the two years compared (Figure 6). Recent Hungarian re- search in the field has detected a strengthening of selectivity, especially in the case of Roma students (e.g. Civil Közoktatási Platform, 2016; Varga et al., 2017; Kertesi and Kézdi, 2012).
Figure 6 Change in social inclusion between 2003 and 2012
Notes: Only countries and economies with comparable data from PISA 2003 and 2012 are shown.
The index of social inclusion is the percentage of total variation in student socio-economic status found within schools. The percentage-point difference in the index of social inclusion is shown above the country/econ- omy name. Only statistically significant differences are shown.
Source: OECD (2013b: 60).
2.3 Low-achieving students
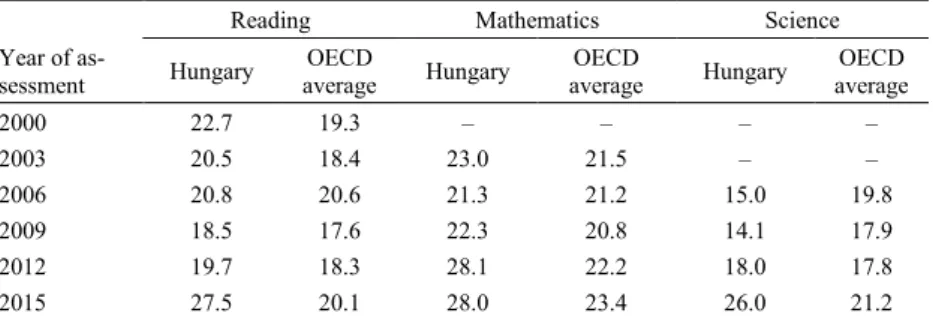
By looking at students’ performance according to proficiency levels, we can explore how well balanced a country’s education system is – that is, what pro- portion of its students leave school with useful, competitive knowledge. PISA reports highlight the importance of proficiency level 2 as the minimum level of knowledge required for an individual to be able to participate actively in modern society (Table 1).
The proportion of Hungarian students who failed in reading (achieved be- low level 2) declined up until 2009; however, since 2012 we have seen an increase. In the period between 2012 and 2015, this rise was dramatic – almost 8 per cent. Hungary’s mathematics results improved between 2003 and 2006;
however, the results since 2009 have seen a downturn again – the nadir was reached in 2012, when the proportion of low-achieving students rose by ap- proximately 6 per cent, which is much higher than the OECD average. The
20 30 40 50 60 70 80 90 100
Finland Norway Sweden Iceland Liechtenstein Canada Switzerland 6.6 Denmark Netherlands Ireland Korea 7.6 Japan 6.3 New Zealand -6.9 Australia Poland Czech Republic OECD average 2003 Italy 5.1 Spain Russian Federation Latvia -7.5 United States Macao-China Germany Luxembourg Greece Belgium Turkey 13.0 Austria Portugal Hong Kong-China -8.9 Tunisia Slovak Republic Indonesia Brazil Hungary Thailand Uruguay Mexico
Index of social inclusion
2012 2003
2015 mathematics results show no significant change. As for science, the pro- portion of low-achieving students fell slightly between 2006 and 2009; how- ever, the figure rose significantly in 2012, and again increased markedly in 2015 to well above the OECD average.
Table 1 Proportion of low-achieving students in the PISA assessments in the three domains between 2000 and 2015 (per cent)
Year of as- sessment
Reading Mathematics Science
Hungary OECD
average Hungary OECD
average Hungary OECD average
2000 22.7 19.3 – – – –
2003 20.5 18.4 23.0 21.5 – –
2006 20.8 20.6 21.3 21.2 15.0 19.8
2009 18.5 17.6 22.3 20.8 14.1 17.9
2012 19.7 18.3 28.1 22.2 18.0 17.8
2015 27.5 20.1 28.0 23.4 26.0 21.2
Note: Proficiency levels were recorded for each domain when the domains were major domains in an as- sessment cycle; therefore, entry dates for data related to a domain differ.
Source: OECD (2001; 2004; 2007; 2010a; 2013b; 2016).
Between the 2009 and the 2015 PISA assessments, Hungary saw a significant increase (6–12 per cent) in the proportion of low-achieving students in all three domains. When evaluating these results, we should note that the propor- tion of low-achieving students was actually one of the indicators in the Euro- pean Union Education and Training 2010 strategic framework. This frame- work aimed to reduce the proportion of low-achieving 15-year-old students to fewer than 15 per cent in all three domains by 2010. Unfortunately, Hungary is moving in the opposite direction in all three domains, but especially in read- ing.
2.4 Resilient students
Resilient students are disadvantaged students who perform at a high level, de- spite their circumstances. By comparing the proportion of resilient students across participating countries, we gain an insight into how school systems around the world support social mobility. The report on the 2015 PISA results classified a student as ‘resilient’ if he/she was in the bottom quarter of the PISA ESCS index in the country/economy of assessment, but still performed in the top 25 per cent of students across all countries/economies once account
is taken of socio-economic status. According to this definition, the average proportion of resilient students in science in the OECD countries is 29.2 per cent. The proportion is highest in the East Asia region – for example, Vietnam (75.5 per cent), Macao (China) (64.6 per cent), Hong Kong (China) (61.8 per cent) and Singapore (48.8 per cent), which are among the top-performing countries/economies. The proportion of resilient students among the top-per- forming European countries is above the OECD average: 48.3 per cent in Es- tonia and 42.8 per cent in Finland. The percentage is 19.3 per cent in Hungary.
With this result, we are ahead of Greece (18.1 per cent), Slovakia (17.5 per cent), Iceland (17.0 per cent), Israel (15.7 per cent), Chile (14.6 per cent) and Mexico (12.8 per cent) among the OECD countries (OECD, 2016). The 2012 PISA report on mathematics results was similar with respect to the top-per- forming countries and the relative position of Hungary (OECD, 2013b).
Information is also available on changes in the proportion of resilient stu- dents over the years. No significant change occurred in terms of mathematics between 2003 and 2012. The proportion of resilient students dropped in sci- ence in only two OECD countries between 2006 and 2015: Finland (-10.4 per cent, though that still leaves the country second in Europe) and Hungary (-6.7 per cent) (Figure 7).
Figure 7 Change in student resilience between 2006 and 2015 (based on science data)
Notes: Only countries/economies with available data are shown. The percentage point difference between 2006 and 2015 in the share of resilient students is indicated next to the name of the country/economy. Only statistically significant differences are displayed.
Source: OECD (2016: 236).
0 10 20 30 40 50 60 70
Macao (China) 6 Hong Kong (China) Japan 8 Estonia Chinese Taipei Finland -10 Korea Spain 11 Canada Portugal United Kingdom 5 Latvia 6 Slovenia 4 Poland Germany 9 Australia United States 12 Netherlands New Zealand Ireland OECD average 2 Switzerland Denmark 8 Belgium France Italy Norway 9 Austria Russia Czech Republic Sweden Croatia Lithuania Turkey Luxembourg Hungary -7 Thailand -5 Greece Slovak Republic Iceland Israel Chile Uruguay Bulgaria 4 Mexico Colombia Romania 5 Indonesia Brazil Montenegro Jordan -7 Qatar 5 Tunisia -12
2015 2006 Percentage of resilient students
If we consider Hungary from the perspective of the OECD countries, the pro- portion of resilient students was low in 2006 and had declined further by 2015 (OECD, 2013b; 2016).
2.5 Socio-economic consequences
If disadvantaged students leave the education system possessing knowledge that is of little or no value on the labour market, this has far-reaching economic consequences: they are then unable to make a decent contribution to the public coffers, while they generate extra expenditure for society in the form of un- employment assistance, welfare allowances, health care outlays and law-en- forcement costs, for example.
Shrewd investment in education definitely pays off. Hanushek and Woess- mann’s PISA analysis (2009), for example, estimated that the economies of countries where student results improved showed steadier growth. An analysis based on the available PISA results estimates that if Hungary were to reach the performance level of Finland in the next 20 years, its net worth for today’s newest generation would be five or six times the current national income (OECD, 2010b). The social benefits are especially important in the case of disadvantaged students, as their educational success determines whether they become reliable taxpayers or a burden on the welfare system. This issue is of high priority in Hungary, as workers with a low level of education seem to struggle more on the labour market here than in other modern economies. This is due to a low level of literacy and lack of work experience, the presence of which could at least help them maintain their basic skills (Köllő, 2009).
The positive impacts of education are not limited to improving a country’s economic productivity. A high-quality education system contributes to social well-being in a number of ways. But if we restrict ourselves to the issue of equity in education, we can conclude that the potential economic, social and cultural capital that parents accumulate through having their children acquire a higher level of education will have a significant impact on the development and school career of those children, and that this positive impact will prevail among future generations as well. Moreover, from Hungary’s perspective, eq- uity in education could significantly mitigate the serious social conflicts with the marginalized Roma minority, whose marginalization is indeed closely as- sociated with the selective nature of the Hungarian education system.
3. Summary
In this chapter we explored two main aspects of the Hungarian educational system. First, we reviewed the main achievement indicators in an international and historical context, focusing on some relevant comparisons (e.g. with the Visegrád countries). Then we examined some characteristics of the system describing equity and equality, among these the impact of socio-economic sta- tus on achievement and the changes in how education supports students’ re- silience.
For a historically long period, when education was accessible only to a smaller proportion of the population, quality and equity of education seemed like diverging aims, which could not be ‘squared’. On the other hand, recent large-scale international comparative assessment programmes, like TIMSS and PISA have indicated that quality and equity are not mutually exclusive, as a number of education systems may promote both at the same time; and cur- rent results suggest that the best education systems are good both at improving academic achievements and at promoting equity.
As the first international assessment programmes showed, the Hungarian ed- ucation system was very strong in the 1970s and 1980s in mathematics and science, but by the mid-1990s it had dropped back to the middle of the field.
Since then, there has been an overall negative tendency: the mean achieve- ments are decreasing while the proportion of low achievers is growing.
Analysis of achievements and their relationship with students’ socio-eco- nomic status clearly indicates that in the case of Hungary, quality and equity are also linked, but in a very awkward way: equity indicators are deteriorating in parallel with a decline in achievement. To change these negative trends, a number of interventions are needed to reduce the selectiveness of the educa- tion system and change the teaching methods.
ACKNOWLEDGEMENT
József Balázs Fejes and László Kinyó received funding through a János Bolyai Research Grant from the Hungarian Academy of Sciences.
REFERENCES
B. Németh, M., E. Korom and L. Nagy (2012). A természettudományos tudás nemzetközi és hazai vizsgá- lata [Examination of science knowledge in international and national contexts]. In: B. Csapó (ed.), Mérlegen a magyar iskola The Hungarian School System Measured. Nemzeti Tankönyvkiadó: Bu- dapest.
Balázsi, I., L. Ostorics, B. Szalay and I. Szepesi (2010). Összefoglaló jelentés. Szövegértés tíz év távlatában
A Report on Hungarian Students’ Reading Comprehension in the Past Decade. Oktatási Hivatal:
Budapest.
Civil Közoktatási Platform (2016). Kockás könyv. Kiút az oktatási katasztrófából [Chequered Book: A way out of an educational disaster]. Civil Közoktatási Platform: Budapest.
Csapó, B. (2002). Az iskolai szelekció hatásának elemzése a képességek fejlődésének számítógépes szimulációja segítségével [Analysing the impact of school selection by a simulation of cognitive deve- lopmental processes]. Magyar Pszichológiai Szemle [Hungarian Psychology Review], 57(1), pp. 211–
27.
Csapó, B., G. Molnár and L. Kinyó (2008). Analysis of the selectiveness of the Hungarian educational system in international context. The 3rd IEA International Research Conference, Taipei, 16–20 Sep- tember.
Csíkos, Cs. and T. Vidákovich (2012). A matematikatudás alakulása az empirikus vizsgálatok tükrében [Changes in mathematics knowledge revealed by empirical studies]. In: B. Csapó (ed.), Mérlegen a magyar iskola The Hungarian School System Measured. Nemzeti Tankönyvkiadó: Budapest.
D. Molnár, É., E. K. Molnár and K. Józsa (2012). Az olvasásvizsgálatok eredményei The results of reading surveys. In: B. Csapó (ed.), Mérlegen a magyar iskola The Hungarian School System Measured.
Nemzeti Tankönyvkiadó: Budapest.
Fejes, J.B. (2012). Learning motivation of disadvantaged students. In: N.M. Seel (ed.), Encyclopedia of the Sciences of Learning. Springer: New York.
Hanushek, E. A. and L. Woessmann (2009). Do better schools lead to more growth? Cognitive skills, eco- nomic outcomes, and causation. NBER Working Paper No. 14633. National Bureau of Economic Re- search, Cambridge, MA.
Hermann, Z. (2010). Az önkormányzatok költségvetési helyzete és a kompetenciamérési eredmények települések közötti különbségei [Financial conditions of municipalities and the differences between the results of the Assessment of Basic Competencies]. In: T. Kolosi and I. Gy. Tóth (eds), Társadalmi Riport 2010 Social Report 2010. TÁRKI: Budapest.
Kádárné, F. J. (1979). Olvasástanításunk eredményei – szövegmegértés [Results of teaching reading – Reading comprehension]. In: Á. Kiss, S. Nagy and J. Szarka (eds), Tanulmányok a neveléstudomány köréből 1975–1976 [Studies in Educational Sciences]. Akadémiai Kiadó: Budapest.
Keeves, J. P. (1992). Learning Science in a Changing World: Cross-national studies of science achieve- ment: 1970 to 1984. IEA: Amsterdam.
Kertesi, G. and G. Kézdi (2005). Általános iskolai szegregáció. Okok és következmények [Segregation in primary school: Causes and consequences]. In: G. Kertesi (ed.), A társadalom peremén [On the Margin of Society]. Osiris Kiadó: Budapest.
Kertesi, G. and G. Kézdi (2009). Általános iskolai szegregáció Magyarországon az ezredforduló után [School segregation in Hungary after the turn of the millennium]. Közgazdasági Szemle [Economic Review], 56(11), pp. 959–1000.
Kertesi, G. and G. Kézdi (2012). Ethnic segregation between Hungarian schools: Long-run trends and ge- ographical distribution, Hungarian Statistical Review, Special No. 16, pp. 18–45.
Kertesi, G. and G. Kézdi (2016). On the test score gap between Roma and non-Roma students in Hungary and its potential causes. Economics of Transition, 24(1), pp. 135–62.
Köllő, J. (2009). Kiszorulás az olvasás- és írásigényes munkahelyekről [Dropping out from jobs requiring reading and writing skills]. In: K. Fazekas (ed.), Oktatás és foglalkoztatás [Education and Employa- bility]. MTA KTI: Budapest.
Martin, M.O., I.V.S. Mullis and P. Foy (2008). TIMSS 2007 International Science Report: Findings from IEA’s trends in International Mathematics and Science Study at the fourth and eighth grades. Boston College: Chestnut Hill.
Martin, M.O., I.V.S. Mullis, P. Foy and G.M. Stanco (2012). TIMSS 2011 International Results in Science.
Boston College: Chestnut Hill.
Martin, M. O., Mullis, I. V. S., Foy, P. and M. Hooper (2016). TIMSS 2015 International Results in Science, Boston College: Chestnut Hill.
Martin, M.O., I.V.S. Mullis, E.J. Gonzalez and S.J. Chrostowski (2004). TIMSS 2003 International Science Report: Findings from IEA’s trends in International Mathematics and Science Study at the fourth and eighth grades. Boston College: Chestnut Hill.
Martin, M.O., I.V.S. Mullis, E.J. Gonzalez and A.M. Kennedy (2003). Trends in Children’s Reading Lit- eracy Achievement 1991–2001. Boston College: Chestnut Hill.
Martin, M.O., I.V.S. Mullis, A.E. Beaton, E.J. Gonzalez, T.A. Smith and D.K. Kelly (1997). Science Achievement in the Primary School Years: IEA’s Third International Mathematics and Science Study (TIMSS). Boston College: Chestnut Hill.
Mullis, I.V.S., Martin, M.O., Gonzalez, E.J., Gregory, K.D., Garden, R.A., O’Connor, K.M., Chrostowski, S.J., and T. A. Smith (2000). TIMSS 1999 International Mathematics Report: Findings from IEA’s Repeat of the Third International Mathematics and Science Study at the Eighth Grade, Boston College:
Chestnut Hill.
Mullis, I.V.S., M.O. Martin, P. Foy and A. Arora (2012a). TIMSS 2011 International Results in Mathemat- ics. Boston College: Chestnut Hill.
Mullis, I.V.S., M.O. Martin, P. Foy and K.T. Drucker (2012b). PIRLS 2011 International Results in Read- ing. Boston College: Chestnut Hill.
Mullis, I.V.S., M.O. Martin, P. Foy and M. Hooper (2016a). TIMSS 2015 International Results in Science.
Boston College, Chestnut Hill.
Mullis, I.V.S., M.O. Martin, P. Foy and M. Hooper (2016b). TIMSS 2015 International Results in Mathe- matics. Boston College: Chestnut Hill.
Mullis, I.V.S., M.O. Martin, A.M. Kennedy and P. Foy (2007). PIRLS 2006 International Report. Boston College: Chestnut Hill.
Mullis, I.V.S., M.O. Martin, P. Foy, J.F. Olson, C. Preuschoff, E. Erberber, A. Arora and J. Galia (2008).
TIMSS 2007 International Mathematics Report: Findings from IEA’s trends in International Mathe- matics and Science Study at the fourth and eighth grades. Boston College: Chestnut Hill.
Mullis, I.V.S., M.O. Martin, E.J. Gonzales, K.D. Gregory, R.A. Garden, K.M. O’Connor, S.J. Chrostowski and T.A. Smith (2000). TIMSS 1999 International Mathematics Report: Findings from IEA’s repeat of the Third International Mathematics and Science Study at the eighth grade. Boston College: Chestnut Hill.
Nagy, J. (1980). 5–6 éves gyermekeink iskolakészültsége [School Readiness of our 5–6-year-old Children].
Akadémiai Kiadó: Budapest.
Nagy, J. (2009). Renewing primary education. In: K. Fazekas, J. Köllő and J. Varga (eds), Green Book:
For the renewal of public education in Hungary. Ecostat: Budapest.
OECD (2001). Knowledge and Skills for Life: First results from the OECD Programme for International Students Assessment (PISA) 2000. OECD: Paris.
OECD (2004). Learning for Tomorrow’s World: First results from PISA 2003. OECD: Paris.
OECD (2007). PISA 2006: Science competencies for tomorrow’s world. OECD: Paris.
OECD (2010a). PISA 2009 Results: Executive summary. OECD: Paris.
OECD (2010b). The High Costs of Low Educational Performance: The long-run economic impact of im- proving PISA outcomes. OECD: Paris.
OECD (2013a). PISA 2012 Results. Vol. I: What Students Know and Can Do: Student performance in mathematics, reading and science. OECD: Paris.
OECD (2013b). PISA 2012 Results. Vol. II: Excellence through Equity: Giving every student the chance to succeed. OECD: Paris.
OECD (2013c). PISA 2012 Results. Vol. III: Ready to Learn: Students’ engagement, drive and self-beliefs.
OECD: Paris.
OECD (2016). PISA 2015 Results. Vol. I: Excellence and Equity in Education. OECD: Paris.
Papp, Z.A. (2012). The results of competency tests in relation with the proportion of Roma students in Hungary. In: J. Pénzes and Zs. Radics (eds), Roma population on the peripheries of the Visegrad coun- tries: Integration issues and possible solutions. Didakt Kiadó: Debrecen.
Robitaille, D.F. and R.A. Garden (1989). The IEA Study of Mathematics Vol. II: Contexts and Outcomes of School Mathematics. Pergamon Press: Oxford.
Tóth, E., B. Csapó and L. Székely (2010). Az iskolák és osztályok közötti különbségek alakulása a magyar iskolarendszerben. Egy longitudinális vizsgálat eredményei [Changes in between-school differences:
The results of a longitudinal survey]. Közgazdasági Szemle [Economic Review], 57(9), pp. 798–814.
Varga, J. (2009). Institutional structure and funding in education. In: K. Fazekas, J. Köllő and J. Varga (eds), Green Book: For the renewal of public education in Hungary. Ecostat: Budapest.
Varga, J., T. Hajdu, Z. Hermann and D. Horn (2017). A közoktatás indikátorrendszere 2017 [Indicators of the Hungarian Education System]. MTA KRTK KTI: Budapest.
Vári, P. and J. Krolopp (1997). Egy nemzetközi felmérés főbb eredményei (TIMSS) [The main results of an international survey (TIMSS)]. Új Pedagógiai Szemle [New Pedagogical Review], 47(4), pp.57–76.