doi: 10.3389/fpsyg.2019.01368
Edited by:
Ronny Scherer, University of Oslo, Norway
Reviewed by:
Alison Margaret Gilmore, University of Otago, New Zealand Andreas Rausch, Universität Mannheim, Germany
*Correspondence:
Gyöngyvér Molnár gymolnar@edpsy.u-szeged.hu
Specialty section:
This article was submitted to Educational Psychology, a section of the journal Frontiers in Psychology
Received:07 December 2018 Accepted:27 May 2019 Published:10 June 2019
Citation:
Molnár G and Csapó B (2019) Making the Psychological Dimension of Learning Visible: Using Technology-Based Assessment to Monitor Students’ Cognitive Development.
Front. Psychol. 10:1368.
doi: 10.3389/fpsyg.2019.01368
Making the Psychological Dimension of Learning Visible: Using
Technology-Based Assessment to Monitor Students’ Cognitive
Development
Gyöngyvér Molnár1* and Ben ˝o Csapó2
1Department of Learning and Instruction, University of Szeged, Szeged, Hungary,2MTA–SZTE Research Group on the Development of Competencies, University of Szeged, Szeged, Hungary
Technology-based assessment offers unique opportunities to collect data on students’
cognitive development and to use that data to provide both students and teachers with feedback to improve learning. The aim of this study was to show how the psychological dimension of learning can be assessed in everyday educational practice through technology-based assessment in reading, mathematics and science. We analyzed three related aspects of the assessments: cognitive development, gender differences and vertical scaling. The sample for the study was drawn from primary school students in Grades 1–8 (ages 7 to 14) in Hungary. There were 1500 to 2000 students in each grade cohort. Online tests were constructed from 1638 items from the reading, mathematics, and science domains in the eDia system. The results confirmed that the disciplinary, application and psychological dimensions of learning can be distinguished empirically. Students’ cognitive development was the most steady (and effective) in mathematics, where the greatest development occurred in the first years of schooling.
Path models suggested that the psychological dimension of learning can be predicted at a moderate level based on students’ level of school knowledge consisting of the disciplinary and application dimensions of learning as latent constructs. The predictive power was almost the same in both dimensions. Generally, girls developed faster in the psychological dimension of reading, mathematics and science learning; however, the size of gender differences varied by age and domain. This study (1) provides evidence that the psychological dimension of learning can be made visible even in an educational context, (2) highlights the importance of the explicit development of the psychological dimension of learning during school lessons, and (3) shows that there are gender differences in the developmental level of the psychological dimension of learning in favor of girls but that this varies by grade and domain.
Keywords: technology-based assessment, online assessment, assessment for learning, visible learning, cognitive development
INTRODUCTION
Improving students’ cognitive abilities has always been a goal of schooling since the very beginning of formalized education (Hattie and Anderman, 2013). However, despite the theoretical foundations, assessment instruments and pedagogical practices that have evolved over time, this aim has not yet been met;
in many school systems students’ cognitive abilities are not optimally enhanced. In the 20th century, several research schools and paradigms sought to conceptualize cognition, define its key constructs and make them measurable (see e.g.,Binet and Simon, 1916; Inhelder and Piaget, 1958; Adey, 2007). Among these, research on intelligence and the related psychometric tradition, Piaget and his school, and the cognitive revolution have all had a major impact on redefining the goals of education.
The implications of the research within these paradigms were drawn for educational practice, and a number of mostly stand- alone programs were initiated in the 1970s, outside classroom instruction (Feuerstein et al., 1980;Klauer, 1989a,b, 1991, 1993, 1997). Later on, in the 1990s, developmental effects were embedded in school subjects using the content of learning (Adey and Shayer, 1994; Shayer, 1999; Adey et al., 2001;
Shayer and Adey, 2002;Shayer and Adhami, 2007). The related research, including a number of experiments, resulted in a better understanding of the role that cognitive processes play in school learning, but it has had a modest impact on educational practice.
At the beginning of this millennium, more or less the same ideas emerged in a new wave of teaching 21st-century skills.
Several projects sought to define, operationalize, measure and teach these skills (see e.g., Trilling and Fadel, 2009; Griffin and Care, 2014), but the same constraints appeared to hinder progress in putting these ideas into practice in mass education as with previous similar attempts. There were no proper tools for assessing and monitoring changes in students’ cognition.
The availability of appropriate assessment instruments is a necessary condition for any pre-test – post-test experimental design as well. However, what can be created and applied in specific experimental conditions cannot always be scaled up for broader practical applications. Similarly, the roots of a number of practical educational challenges can be traced back to the fact that significant determinants of school learning are not visible (Hattie, 2009). They are also not easy to observe, nor can developmental deficiencies always be identified by teachers (MacGilchrist et al., 2004). The lack of thinking skills – the cognitive tools required for successful learning – are not identified; thus, they remain untreated, and this significantly hampers further learning.
Thinking, or more specifically, a set of cognitive skills essential for learning, such skills are not observable in the everyday educational context. Students are not aware of the existence of the required processes, and teachers, even if they receive training in identifying the cognitive processes underlying learning, are not able to observe them, or they simply have no time or capacity to determine each student’s individual needs. Although the developmental levels of crucial thinking skills might be measured with traditional paper-based instruments, the immense costs, the human resources required, and the time between assessment and feedback excludes the possibilities of using them diagnostically.
Technology may be a solution for making thinking processes visible by creating simpler, faster, frequently applicable and cost- effective assessments (Mayrath et al., 2012).
In this paper, which is part of a larger project, we present the results of work in identifying cognitive processes relevant for learning, making them measurable in normal educational contexts, and providing students and teachers with frequent feedback. One of the most challenging aspects of this work, is establishing the validity of diagnostic instruments to assess of cognitive processes; showing that the tests measure something more than mastering the current teaching material. To do this, we empirically validated a 3-dimensional framework developed for diagnostic assessment and explored the psychometric characteristics of an item bank devised for the assessment of the psychological dimension of learning.
THEORETICAL BACKGROUND
The idea of making learning visible was introduced into educational research and development by John Hattie. He made a great step forward in initiating evidence-based educational practice when he synthesized the results of over 800 meta- analyses (Hattie, 2009). He translated his findings into actual classroom work, and in his book for teachers, he explained:
Visible teaching and learning occurs when learning is the explicit and transparent goal, when it is appropriately challenging, and when the teacher and the student both (in their various ways) seek to ascertain whether and to what degree the challenging goal is attained, when there is deliberate practice aimed at attaining mastery of the goal, when there is feedback given and sought, and when there are active, passionate, and engaging people (teachers, students, peers, and so on) participating in the act of learning (Hattie, 2012, p. 18).
As he emphasizes, feedback plays a central role in successful learning, which at a higher level of learning, includes self- monitoring, self-evaluation and self-assessment. However, he also explains how difficult a task it is to provide proper feedback:
“Learners can be so different, making it difficult for a teacher to achieve such teaching acts: students can be in different learning places at various times, using a multiplicity of unique learning strategies, meeting different and appropriately challenging goals”
(Hattie, 2012, p. 18).
Student diversity, i.e., students at different levels in different cognitive attributes, is not the most challenging phenomenon when proper feedback is considered. A major problem is that a number of learning outcomes, sometimes the most important ones, are not visible and cannot easily be made visible. While the majority of the studies Hattie reports on deal with organizational issues, methods and classroom practices for teaching curricula, there are far fewer studies that cover the underlying cognitive processes, e.g., reasoning skills, required to understand mathematics and science or precursors of reading, such as phonemic awareness. Some studies have focussed on the most hidden aspects of learning. For example,
Ritchhart et al. (2011) identify a broad range of teaching and learning practices to make thinking visible. They identify the crucial problem in a simplified conception of learning (reduced to memorization) and knowledge (reduced to information, facts and figures): “When we demystify the thinking and learning processes, we provide models for students of what it means to engage with ideas, to think, and to learn. In doing so, we dispel the myth that learning is just a matter of committing the information in the textbook to one’s memory” (Ritchhart et al., 2011, p. 28).
Taking into account diversity among students, the limited capacity of teachers and the need to provide feedback on the most relevant but least visible aspects of school learning – promoting students’ cognitive development – we may conclude that students and teachers need a different approach to assessment to improve learning. The online assessment system, eDia, was designed for this purpose. It assesses “thinking,” or “cognitive development,” as a separate dimension, which we call the psychological dimension of learning. We briefly introduce the 3-dimensional theoretical framework that forms the basis for the diagnostic assessment system, and then we elaborate on the psychological dimension in more detail, as that is the focal topic of the present study.
Finally, we discuss the crucial role of technology, arguing that its widespread availability in schools makes the time right for such a system to be introduced and integrated into regular educational processes.
Learning and Cognitive Development: A 3-Dimensional Model of Learning
Outcomes
An online diagnostic assessment system, eDia, has been constructed to provide teachers and students with relevant feedback information (Csapó and Molnár, unpublished). The eDia system covers the three most frequently assessed domains of school education; reading, mathematics and science. Large item banks have been developed for use in regular classroom assessments in Grades 1 to 6 of primary school, and for Grades 7 and 8 to explore the developmental trends in a broader age range.
The objectives of each item bank are defined in its assessment framework, similarly to international comparative studies, such as Trends in International Mathematics and Science Study (TIMSS; Mullis et al., 2005) and Progress in International Reading Literacy Study (PIRLS;Mullis and Martin, 2015); they are based on a 3-dimensional model of the goals of learning that forms a common foundation for diagnostic assessment.
The three dimensions include thinking/reasoning, application and disciplinary knowledge. [The 3-dimensional framework has been published in several articles and book chapters before the assessment frameworks were elaborated (see e.g., Csapó, 2010;Nunes and Csapó, 2011; Adey and Csapó, 2012;Blomert and Csépe, 2012)]. The framework for reading was somewhat different those for mathematics and science (Csapó and Csépe, 2012;Csapó et al., 2015c), which were more similar (Csapó and Szendrei, 2011;Csapó and Szabó, 2012;Csapó et al., 2015a,b).
The intention of “cultivating the mind” – developing cognitive abilities – may be traced back to ancient philosophy. To set goals
in this direction, a model of mind is needed; more specifically, knowledge of how internal psychological attributes are structured and how psychological processes play a role in learning (see more details in the next section). In the eDia frameworks, this is the
“thinking” (this term is mostly used in the context of mathematics and science), or, more generally, the “psychological dimension.”
According to the model, we propose the psychological dimension of knowledge does not only contain “domain-specific reasoning skills,” but also general reasoning skills embedded in different content and contexts, which has lately been referred to as transversal skills; and is not the same as procedural knowledge.
We assume that there are natural cognitive developmental (psychological) processes. These processes, as described by Piaget, take place in the interaction between the child and his/her environment. School education may stimulate this development if it provides a student with proper environmental stimuli and if these stimuli are within the zone of proximal development (ZPD) of the child (Vygotsky, 1978). Very often, school instruction is not adjusted to the individual needs of the students; usually the stimuli are far beyond their ZPD. In these cases, students benefit little from instruction; they memorize the rules and develop specific skills through a large amount of drill practice, which have any real impact on their cognitive development. For example, students may learn rules to deal with ratios and proportions without this learning having much impact on the development of proportional reasoning. Schools may teach students a great deal about combinatorics, probability and correlation without having a real impact on the development of combinatorial, probabilistic or correlative reasoning. In this way, we distinguish the psychological dimension from the disciplinary dimension, which may include procedural knowledge (e.g., skills for solving linear equations or proving geometric theorems) or domain- specific reasoning skills. This model and approach opens the door to fostering domain-general reasoning skills in a domain- specific context.
Application deals with another ancient goal – that school should teach something that is applicable beyond the school context. Applying knowledge and transferring it to new contexts require a deeper conceptual understanding and usually specific exercises to facilitate application. Therefore, most knowledge mastered at school remains inert and not applicable in new contexts (Alexander and Murphy, 1999;Bransford and Schwartz, 1999; Csapó, 2010). The PISA conducted by the OECD has focussed on this dimension from the very beginning. The PISA expert groups elaborated the concept of applicable knowledge and defined it as competencies students need in a modern society.
To develop such a framework, the social relevance of knowledge, i.e., the needs of societies have also be taken into account. For the frameworks of the first and second PISA assessment, the concept of literacy was extended in include the objects of the assessment in the three domains as reading literacy, mathematical literacy and scientific literacy (OECD, 1999, 2003).
Disciplinary knowledge is the third dimension and is most commonly known as curricular content. Arts and sciences content constitutes the major source of disciplinary knowledge.
The first major international comparative studies (e.g., First and Second International Mathematics Study – Husén, 1967;
Burstein, 1993; First and Second International Science Study – Bloom, 1969;IEA, 1988), the precursor to the TIMSS, assessed this dimension. The first assessments were based on an analysis of the curricula in the participating countries. More recently, the TIMSS frameworks organize the objects of the assessment into three groups: content, application and reasoning. This classification bears some similarity to the 3-dimensional eDia frameworks (For PISA assessment frameworks, seeOECD, 2003).
Education must not be reduced to providing the right answer quickly, but must deal with the ongoing cognitive work of understanding new ideas and information that will serve students as learners in the future (Costa and Kallick, 2009). In modern society, students are expected to apply their knowledge in a wide range of contexts, and they should be able to solve problems in unknown, novel situations. Thus, these goals must reinforce and interact with each other as they are strongly connected (Molnár and Csapó, 2019).
It is reasonable that the earliest efforts to measure knowledge learnt at school focussed on areas that were the easiest to measure: the disciplinary (knowledge) dimension of learning (see e.g., IEA TIMSS). The goal of applying that knowledge in a new context (the application dimension) and assessing students’ ability to do so is a more complicated task (see e.g., OECD PISA). The goal of developing students’
thinking abilities (the psychological dimension) is even more complex. To be able to make thinking visible, we must be clear about, and draw on, our understanding of what thinking is and what types of thinking we want to assess and enhance.
Assessment Beyond the Content of Actual Learning
In the 20th century, several research paradigms have conceptualized the development of thinking and its relationship to school education. Among these, research on “intelligence”
was the first that was closely linked to education. The first intelligence test (Binet–Simon test, Binet and Simon, 1916) was constructed to assess children’s preparedness for schooling, and the Scholastic Aptitude Test (SAT) (see Grissmer, 2000) served a similar purpose at the transition from secondary to tertiary education. Several new approaches, models and interpretations of the concept of intelligence have been proposed.
From the perspective of education, the more useful ones consider intelligence as (able to be modified, taught, learnt, or improved within educational contexts). Our psychological dimension in each domain may thus overlap with the inductive reasoning components of “fluid” intelligence. The psychological dimension can be embedded within the conception of plastic general ability (seeAdey et al., 2007), and a number of cognitive skills covered by the psychological dimension of our frameworks are explicitly identified in Carroll’s three-strata model of abilities (Carroll, 1993) and the Specialized Cognitive Systems of Demetriou’s model (Demetriou et al., 1992, 1993;Adey et al., 2007). On the other hand, we emphasize that all the cognitive skills discussed in the psychological dimension of the frameworks are embedded within the content and context of each particular domain, and
the tasks developed from the frameworks are adjusted to the developmental level of the cohort of students to be assessed.
The work of Jean Piaget and his school was characterized by another approach. Piaget described students’ reasoning skills with well-defined operations, which correspond with certain mathematical structures (see e.g.,Inhelder and Piaget, 1958). He mostly used basic science content for his experiments (e.g., the pendulum), and the operations he identified may be found in various learning contexts as well as in everyday problems.
The cognitive revolution in psychology provided a new impetus to research efforts in school learning. It led to a more differentiated conception of knowledge and learning, allowing a more precise definition of the goals of education.
Recent studies in psychology and education have shown that these skills are especially crucial at the beginning years of schooling, as students’ developmental level determines later success (seeNguyen et al., 2016).
The psychological dimension has been conceptualized as the interaction between the development of students’ thinking skills and learning at school (Nunes and Csapó, 2011;Adey and Csapó, 2012;Blomert and Csépe, 2012) and must address how students learn in reading, mathematics and science.
In this study, we explored the prospects of making the psychological dimension of learning visible by using technology- based assessments to monitor the development of students’
thinking skills. The aim of this study was to show how the psychological dimension of learning (thinking) can contribute to the development of specific reasoning skills.
In reading, assessment of the psychological dimension (thinking and reasoning) covers the cognitive mechanisms of development from laborious phonological decoding to the automatic recognition of whole words, and from prerequisite skills of reading through phonemic, phonological and morphological awareness to metacognitive aspects (Blomert and Csépe, 2012). In mathematics (Nunes and Csapó, 2011) and science (Adey and Csapó, 2012), there are generic objects and domain specific objects. For example, number sense is specific to mathematics, while the control of variables and scientific reasoning are better covered within the science framework. Operational reasoning (e.g., seriation, class inclusion, classification, combinatorial reasoning, probabilistic reasoning, proportional reasoning) and some higher-order thinking skills (e.g., inductive reasoning and problem solving) are more generic and can be assessed in both mathematics and science.
AIMS, RESEARCH QUESTIONS AND HYPOTHESES
In this study, we explored the prospects of making the psychological dimension of learning visible by using technology- based assessments to monitor the development of students’
reasoning skills. The aim of the study was to show how the psychological dimension of learning (thinking) can be assessed in everyday educational practice and how it is related to students’
level of subject matter content knowledge. Three domains were explored from this perspective: reading, mathematics
and science. Reading is the basis for all further learning, including mathematics and science, while mathematics provides foundations for learning in various areas of science. These domains are central in many education systems, and large-scale international comparative studies, such as TIMSS, PIRLS, and PISA, have focussed on these areas. We analyzed three aspects of the assessments: cognitive development, gender differences and vertical scaling.
Worldwide, there are many initiatives and computer-based tests available in the domains of reading, mathematics and science worldwide. However, they mainly focus only on disciplinary knowledge dimension (content) or the application dimension (literacy of learning) (e.g., TIMSS, PIRLS, and OECD PISA). There are no regular large-scale assessments that include the psychological dimension of learning in primary school – cognitive development. The available assessment systems in reading, mathematics and science have been designed to assess older students’ reading, mathematics and science knowledge (e.g., TIMSS, PIRLS, and PISA). The present study sought to:
(1) define and examine the different dimensions of learning in reading, mathematics and science; (2) monitor and compare cognitive development (the psychological dimension of learning) in the three domains over time; (3) analyze the proportion of unexplained variance in cognitive development if school knowledge (the application and disciplinary dimensions) is taken into account in reading, mathematics and science; and (4) identify any gender differences in the cognitive development in the three domains. We sought to answer five research questions.
RQ1: Can the three dimensions of learning be distinguished empirically? We explored this question to see if cognitive development, the development of reasoning skills, can be assessed separately and be made visible in everyday educational practice. We hypothesize that the psychological, application and disciplinary dimensions of learning can be distinguished empirically, assessed and monitored in everyday educational practice (Csapó and Szendrei, 2011; Csapó and Csépe, 2012;
Csapó and Szabó, 2012). We also hypothesize that they will interact and correlate with each other.
RQ2: Is the psychological dimension of learning the same across the three domains? That is, is the same construct being measured in the psychological dimension of learning across the three main domains? The roots of cognitive development may be universal as early neurocognitive development in children is similar across cultures and societies (Molnár and Csapó, 2019).
Therefore, based on the conceptualization of the psychological dimension of learning as the interaction between students’
cognitive development and learning at school (Nunes and Csapó, 2011), we hypothesize that the 1-dimensional model will fit the data better than the 3-dimensional model. However, we argue that the 3-dimensional model will take into account results from research on knowledge transfer. According toMcKeachie (1987),
“Spontaneous transfer is not nearly as frequent as one would expect” (p. 709).
RQ3: How does the psychological dimension of reading, mathematics and science develop over time during primary schooling? Based on previous research results on reasoning skills, we hypothesize that children’s cognitive development is slow (Molnár et al., 2013, 2017), indicating the need for more
stimulating school lessons. Based on Polya’s (1981) theory of problem solving, and results from research on mathematics teaching (e.g.,Nunes and Csapó, 2011), we hypothesize that the psychological dimension of learning in mathematics will develop the most readily.
RQ4: How can the psychological dimension of learning be explained by students’ level of school knowledge in reading, mathematics and science? That is, how can learning in reading, mathematics and science contribute to the development of the psychological dimension of learning, and how effectively does it stimulate students’ general cognitive development? Research in this field provides rich resources ranging from the classical work of Piaget (see e.g.,Inhelder and Piaget, 1958) to the most recent neurocognitive studies (such asGeake and Cooper, 2003;Thomas et al., 2019). We hypothesize that learning reading, mathematics and science will contribute to students’ development in the psychological dimension of learning but that the transfer effect will be low. We base our hypothesis on empirical research that has found that reasoning skills develop relatively slowly during primary and secondary education with the average pace of development being about one quarter of a standard deviation per year (Csapó, 1997; Molnár and Csapó, 2011; Greiff et al., 2013;Molnár et al., 2013, 2017). The development of reasoning skills is a “by-product” of teaching rather than guided by explicit instruction (de Koning, 2000).
RQ5: How does the developmental level of the psychological dimension of learning differ by gender, grade and domain? Based on the most prominent international studies (Martin et al., 2016;
Mullis et al., 2016, 2017;OECD, 2016) and the research results on gender differences in students’ development of reasoning skills (Wüstenberg et al., 2014), we hypothesize gender differences in the development of the psychological dimension of learning will vary by grade and domain. The PISA studies indicated that the achievement of 15-year-old Hungarian girls in the application dimension of reading was significantly better than that of boys, while there were no statistically significant gender differences in mathematics and science (OECD, 2016). In contrast, the TIMSS studies that focus on younger students (Grades 4 and 8; 10- to 14-year-olds) mainly assess the disciplinary dimension of mathematics and science knowledge. Their findings indicated that boys significantly outperform girls in mathematics in Grade 8 (Mullis et al., 2016), but there was no statistically significant gender difference in Grade 4. In science, boys significantly outperformed girls at both grade levels (Martin et al., 2016).
In PIRLS, Grade 4 Hungarian girls significantly outperformed their boys in reading (Mullis et al., 2017). Please note that the present study focussed on the psychological dimension and not on the application or disciplinary dimensions of learning in mathematics, science or reading.
MATERIALS AND METHODS Participants
The sample of students for the study was chosen from the partner school network of the Center for Research on Learning and Instruction at the University of Szeged in Hungary. As schools participated voluntarily in the project, representative
sampling of school classes or students was not a goal. However, based on the data collected from the schools, it was possible to generate nationally representative indicators for the main variables. We noted that schools with relatively large numbers of low socioeconomic (SES) students were under-represented in the present study, possibly due to the lack of ICT available in those schools.
The sampling unit was a school class. Classes were drawn from primary and secondary schools from Grades 1–8 (aged 7–14). A total of 656 classes from 134 schools in different regions were involved in the study, resulting in a wide-ranging distribution of students’ background variables. The total number of students involved in the study was 14,062 (Table 1). The proportion of boys and girls was about the same. As participation was voluntary, not all students completed tests in all three domains or in each dimension within each domain. Thus, data was potentially available for students who completed nine elements: the assessment of three dimensions of learning (psychological, application, and disciplinary) in three domains (reading, mathematics, and science). After the scaling procedure, we excluded students from the analyses where, because of missing data. it was not possible to compute an ability level in at least one of the nine elements. Thus, 5,714 students from 310 classes and 97 schools were involved in the analyses.
Tests
An item bank was constructed for diagnostic assessments in reading, mathematics and science based on the three dimensions of learning described in the previous section. These item banks collectively contained almost 17,000 tasks with most tasks having several items. There were 6685 tasks for reading, 6691 for mathematics and 3535 for science. Tests to measure the psychological, application, and disciplinary dimensions of learning in reading, mathematics and science among students in Grades 1–6 (aged 6–7 to 12–13). The tests for the study were drawn from these item banks. Students in Grades 7 and 8 received tasks originally written for students in Grades 5 and 6 (seeTable 2).
For each grade level, nine tasks with different difficulty levels (three easy, three medium-difficulty and three difficult) were
TABLE 1 |The sample for the study.
Grade Whole sample Data analyzed
(3 domains×3 dimensions)
N Age Gender N Age Gender
[mean (SD)] (% of girls) [mean (SD)]
1 1003 7.8 (0.58) 47.2 349 7.8 (0.59) 46.3
2 1348 8.8 (0.61) 51.5 528 8.8 (0.57) 49.6
3 1675 9.8 (0.62) 49.9 598 9.8 (0.65) 49.9
4 2148 10.8 (0.60) 50.2 659 10.8 (0.60) 49.3
5 2441 11.8 (0.60) 47.8 1169 11.8 (0.61) 47.8
6 2122 12.9 (0.59) 47.7 1017 12.9 (0.59) 47.0
7 1875 13.9 (0.62) 49.6 800 13.9 (0.61) 50.0
8 1450 14.9 (0.63) 49.5 594 14.9 (0.63) 49.7
Total 14062 11.6 (2.18) 49.1 5714 11.7 (2.15) 49.0
chosen from each item bank to assess each dimension. After this procedure, there were 543 tasks in reading, 604 in mathematics and 492 in science.
The tasks were grouped into clusters, with 10–15 items per cluster for students in the lower grades and 15–20 items for students in the higher grades. One 45-min test consisted of four clusters of tasks for students in Grades 1 and 2 (50–55 items) and five clusters for students in Grades 3 to 6 (60–85 items). Each test contained clusters of tasks from each learning dimension with the clusters positioned in a different order to avoid the item-position effect in the scaling procedure. Anchor items were used within and between the different grades for the horizontal and vertical scaling of the data. The clusters contained easier or harder tasks from lower or higher grades. A total of 483 strongly anchored, but different clusters were developed from the items selected.
For optimizing the measurement error of the test, the clusters contained tasks from the same dimension of learning, ranging in task difficulty for the different grade levels. That is, students received more tasks from one learning dimension if those tasks were originally prepared for students in lower or higher grades.
The structure of the test of mathematical knowledge is presented inTable 2paralleled the structure of the reading and science tests.
Based on this structure, 162 different tests (nine in each grade and each domain) were constructed from the item banks for the vertical scaling of students in Grades 1–8.
TABLE 2 |The structure of the tests in mathematics by cluster of tasks for each grade level.
Grade Cluster 1 Cluster 2 Cluster 3 Cluster 4 Cluster 5
1 Mouse usage
warm-up tasks
MD1 (15) MR1 (15) MA1 (15) MD2/MR2/
MA2 (10) MA1 (15) MD1 (15) MR1 (15) MD2/MR2/
MA2 (10) MR1 (15) MA1 (15) MD1 (15) MD2/MR2/
MA2 (10)
2 Mouse usage
warm-up tasks
MD1 (15) MR2 (15) MA2 (15) MD3 (10) MA1 (15) MD2 (15) MR2 (15) MA3 (10) MR1 (15) MA2 (15) MD2 (15) MR3 (10)
3 MD1 (10) MD2 (10) MA2 (15) MR3 (15) MD4 (10)
MA1 (10) MA2 (10) MR2 (15) MD3 (15) MA4 (10) MR1 (10) MR2 (10) MD2 (15) MA3 (15) MR4 (10)
4 MD2 (10) MD3 (10) MA4 (15) MR4 (15) MD5 (10)
MA2 (10) MA3 (10) MR4 (15) MD4 (15) MA5 (10) MR2 (10) MR3 (10) MD4 (15) MA4 (15) MR5 (10)
5 MD3 (15) MD4 (15) MA5 (20) MR5 (20) MD6 (15)
MA3 (15) MA4 (15) MR5 (20) MD5 (20) MA6 (15) MR3 (15) MR4 (15) MD5 (20) MA5 (20) MR6 (15)
6 MD4 (15) MD5 (15) MA6 (20) MR6 (20) MD6 (15)
MA4 (15) MA5 (15) MR6 (20) MD6 (20) MA6 (15) MR4 (15) MR5 (15) MD6 (20) MA6 (20) MR6 (15) 7–8 MD5 (15) MR5 (15) MA5 (20) MD6 (20) MR6 (15) MA5 (15) MD5 (15) MR5 (20) MA6 (20) MD6 (15) MR5 (15) MA5 (15) MD5 (20) MR6 (20) MA6 (15)
M, mathematics; D, disciplinary dimension; A, application dimension; R, reasoning dimension; 1–6, grade for which the task was originally designed; (NUMBER), number of items in the cluster.
In Grades 1–3, instructions were provided in written form, on- screen, and with a pre-recorded voiceover to avoid any reading difficulties and to ensure greater validity of the assessments. Thus, students used headphones during the administration of the tests.
After listening to the instructions, they indicated their answer by using the mouse or keyboard (in the case of desktop computers, which are most commonly used in Hungarian schools) or by directly tapping, typing or dragging the elements of the tasks using their fingers on tablets.
The tasks presented inFigure 1assess students’ mathematical and scientific reasoning. Based on the framework for the diagnostic assessment of mathematics (Csapó and Szendrei, 2011) and science (Csapó and Szabó, 2012), the main questions in this psychological dimension related to how well mathematics and science education was adjusted to students’ psychological development, how learning mathematics and science could contribute to the development of specific reasoning skills and how effectively they could stimulate students’ general cognitive development. Items developed to measure the psychological dimension of learning encompassed a long list of skills, such as inductive reasoning, deductive reasoning, analogical reasoning, combinatorial reasoning, systematization skills, proportional reasoning and correlative reasoning. Two examples of tasks for assessing students’ inductive reasoning are presented inFigure 1.
Students had to discover regularities by detecting dissimilarities with respect to attributes of different objects. They completed the tasks by dragging the elements to different areas, thereby defining the proper sets. The scoring of all tasks was automated, including items with several correct answers.
Figure 2 presents a task measuring student’s science disciplinary knowledge and a mathematics tasks measuring the application dimension. In the science task, students retrieve disciplinary knowledge of phases of the water cycle. In the mathematics task, students have to select and place flowers – drag and drop – in the vase; only the number of flowers counts. The task measures the application of adding up to 10 in a realistic application context.
Procedures
The tests were administered over a period of 7 weeks in computer rooms within the participating schools during regular school hours. Each test lasted approximately 45 min. Test sessions were supervised by teachers who had been thoroughly trained in test administration. The tests were delivered on the eDia online platform. After students entered the system and chose the domain (reading, mathematics, or science), the system randomly selected a test for that student from the nine tests available in the appropriate grade level.
To learn to use the program, students were provided with instructions and a trial (warm-up) task with immediate feedback.
This instruction included: (1) a yellow bar at the top of the screen to show how far along they were on the test; (2) they had to click on the speaker icon to listen to the task instructions; (3) they had to click on the “next” button to move on to the next task; (4) pupils in Grades 1 and 2 received extra warm-up tasks to enhance keyboarding and mouse skills; and (5) after completing the last task, participants received immediate visual feedback with
a display of 1 to 10 balloons, where the number of balloons was proportionate to their achievement.
The feedback system available for the teacher was more elaborate. Due to the large number of students and items, the Rasch analyses were run with the built-in analytic module in the eDia system. As the tasks in the item bank were scaled using IRT, it was possible to compare students’ achievement.
Teachers received feedback on students’ achievement both as a percentage of correct items and as ability scores. For each grade and domain, the national average achievement (ability score) was set at 500 with a standard deviation of 100 (Carlson, 2009;Ferrão et al., 2015; Weeks, 2018). This was the point of reference for interpreting students’ achievement.
We used confirmatory factor analyses (CFA) within structural equation modeling (SEM) (Bollen, 1989) to test the underlying measurement models of reading, mathematics and science knowledge in the three dimensions of learning: psychological (reasoning), application (literacy), and disciplinary knowledge, respectively (RQ 1). We used the preferred estimator for categorical variables; the adjusted weighted least squares mean and variance (WLSMV) (Muthén and Muthén, 2012). We tested a 3-dimensional model to distinguish the three different dimensions of learning, and we also tested a 1-dimensional model with all three dimensions combined under one general factor. In order to test which model fitted the data better, we carried out a specialχ2-difference test in Mplus. We also used CFA to test the underlying measurement model, and to determine the invariance behavior of the psychological dimension across the three domains of learning (RQ 2).
To establish a developmentally valid scale, we used the Rasch model with the vertical and horizontal scaling of the data (RQs 2 and 4) and then a linear transformation of the logit metric.
As indicated above, for each domain and at each grade level, the mean achievement of each dimension was set to 500 with a standard deviation of 100. We used path models to test the effect and predictive power of school learning on the psychological dimension of learning (RQ 3).
RESULTS
The Psychological Dimension of Learning
Results showed that the psychological (reasoning/thinking), application and disciplinary dimensions of learning can be distinguished empirically and are independent of domain and grade. The χ2-difference test in Mplus showed that the 3-dimensional model fitted significantly better than the 1- dimensional model in each grade and in each domain (see Tables 3–5for reading, mathematics and science, respectively).
Generally, the 3-dimensional measurement model for each domain showed a good model fit (Tables 3–5), based onHu and Bentler’s (1999) recommended cut-off values. The comparative fit index (CFI) and the Tucker–Lewis index (TLI) values above 0.95 and the root mean square error of approximation (RMSEA) below 0.06 indicated a good global model fit.
FIGURE 1 |Measuring the psychological dimension of learning: assessment of students’ inductive reasoning skills in the context of geometry and biology.
FIGURE 2 |Measuring the disciplinary dimension of learning science and the application dimension of learning mathematics.
TABLE 3 |Goodness of fit indices for testing the dimensionality of reading from Grades 1 to 8.
Grade Model χ2 df p 1χ2 1df p CFI TLI RMSEA 90% C.I.
1 3-dim. 378.262 296 0.001 29.055 3 0.001 0.947 0.941 0.057 [0.038, 0.073]
1-dim. 448.137 299 0.001 0.903 0.895 0.076 [0.061, 0.090]
2 3-dim. 514.018 461 0.001 30.963 3 0.001 0.975 0.973 0.032 [0.026, 0.075]
1-dim. 575.196 464 0.001 0.948 0.945 0.047 [0.033, 0.059]
3 3-dim. 406.497 347 0.01 15.681 3 0.01 0.833 0.818 0.054 [0.026, 0.075]
1-dim. 430.585 350 0.01 0.773 0.755 0.062 [0.039, 0.082]
4 3-dim. 592.821 431 0.01 90.820 3 0.001 0.937 0.932 0.066 [0.052, 0.079]
1-dim. 695.499 434 0.01 0.898 0.891 0.084 [0.072, 0.095]
5 3-dim. 2046.006 125 0.001 92.737 3 0.001 0.911 0.908 0.035 [0.027, 0.041]
1-dim. 2276.042 122 0.001 0.839 0.833 0.046 [0.041, 0.052]
6 3-dim. 530.220 431 0.001 77.918 3 0.001 0.970 0.967 0.037 [0.025, 0.047]
1-dim. 755.989 434 0.001 0.902 0.895 0.066 [0.058, 0.073]
7 3-dim. 1078.340 899 0.001 110.370 3 0.001 0.969 0.967 0.030 [0.022, 0.036]
1-dim. 1458.058 902 0.001 0.904 0.899 0.052 [0.047, 0.057]
8 3-dim. 696.816 524 0.001 76.199 3 0.001 0.974 0.972 0.035 [0.028, 0.042]
1-dim. 979.228 527 0.001 0.933 0.928 0.057 [0.052, 0.063]
df, degrees of freedom; CFI, comparative fit index; TLI, Tucker–Lewis index; RMSEA, root mean square error of approximation;χ2and df were estimated by WLSMV.
1χ2was estimated with the difference test procedure in MPlus (seeMuthén and Muthén, 2012). C.I., confidence interval.
TABLE 4 |Goodness of fit indices for testing the dimensionality of mathematics from Grades 1 to 8.
Grade Model χ2 df p 1χ2 1df p CFI TLI RMSEA 90% C.I.
1 3-dim. 409.506 249 0.001 95.309 3 0.001 0.953 0.948 0.077 [0.063, 0.090]
1-dim. 586.328 252 0.001 0.902 0.893 0.110 [0.099, 0.122]
2 3-dim. 543.407 321 0.001 96.826 3 0.001 0.944 0.939 0.061 [0.052, 0.070]
1-dim. 734.133 324 0.001 0.897 0.889 0.083 [0.075, 0.091]
3 3-dim. 171.573 149 0.01 15.784 3 0.01 0.923 0.912 0.046 [0.000, 0.075]
1-dim. 194.581 152 0.01 0.855 0.837 0.063 [0.032, 0.087]
4 3-dim. 236.477 206 0.01 40.265 3 0.001 0.940 0.933 0.060 [0.000, 0.093]
1-dim. 268.352 209 0.01 0.883 0.871 0.083 [0.050, 0.111]
5 3-dim. 381.365 186 0.001 110.584 3 0.001 0.939 0.931 0.060 [0.052, 0.069]
1-dim. 675.939 189 0.001 0.847 0.830 0.095 [0.087, 0.102]
6 3-dim. 680.214 492 0.001 112.972 3 0.001 0.912 0.906 0.054 [0.043, 0.063]
1-dim. 966.684 495 0.001 0.780 0.765 0.085 [0.077, 0.093]
7 3-dim. 1182.063 816 0.001 205.034 3 0.001 0.968 0.966 0.047 [0.041, 0.052]
1-dim. 1882.948 819 0.001 0.908 0.903 0.079 [0.075, 0.084]
8 3-dim. 3021.062 557 0.001 165.118 3 0.001 0.876 0.867 0.124 [0.120, 0.128]
1-dim. 3412.642 560 0.001 0.856 0.847 0.133 [0.129, 0.137]
df, degrees of freedom; CFI, comparative fit index; TLI, Tucker–Lewis index; RMSEA, root mean square error of approximation;χ2and df were estimated by WLSMV.
1χ2was estimated with the difference test procedure in MPlus (seeMuthén and Muthén, 2012). C.I., confidence interval.
TABLE 5 |Goodness of fit indices for testing the dimensionality of science from Grades 1 to 8.
Grade Model χ2 df p 1χ2 1df p CFI TLI RMSEA 90% C.I.
1 3-dim. 596.485 461 0.001 57.623 3 0.001 0.921 0.915 0.050 [0.038, 0.061]
1-dim. 659.870 464 0.001 0.886 0.878 0.060 [0.049, 0.073]
2 3-dim. 464.075 321 0.001 39.177 3 0.001 0.944 0.939 0.038 [0.030, 0.045]
1-dim. 554.254 324 0.001 0.910 0.903 0.048 [0.041, 0.055]
3 3-dim. 732.349 431 0.01 66.500 3 0.01 0.924 0.918 0.111 [0.097, 0.124]
1-dim. 786.319 434 0.01 0.911 0.904 0.119 [0.106, 0.133]
4 3-dim. 159.502 132 0.01 19.191 3 0.001 0.939 0.930 0.060 [0.000, 0.091]
1-dim. 178.564 135 0.01 0.904 0.891 0.075 [0.041, 0.103]
5 3-dim. 571.944 402 0.001 151.940 3 0.001 0.938 0.933 0.040 [0.033, 0.048]
1-dim. 950.437 405 0.001 0.801 0.787 0.072 [0.066, 0.078]
6 3-dim. 716.173 402 0.001 332.375 3 0.001 0.934 0.928 0.048 [0.063, 0.074]
1-dim. 1925.098 405 0.001 0.679 0.655 0.106 [0.101, 0.111]
7 3-dim. 999.868 524 0.001 185.888 3 0.001 0.882 0.874 0.039 [0.035, 0.042]
1-dim. 1564.230 527 0.001 0.743 0.726 0.057 [0.054, 0.060]
8 3-dim. 664.189 374 0.001 112.367 3 0.001 0.882 0.872 0.041 [0.036, 0.046]
1-dim. 897.133 377 0.001 0.788 0.772 0.055 [0.050, 0.060]
df, degrees of freedom; CFI, comparative fit index; TLI, Tucker–Lewis index; RMSEA, root mean square error of approximation;χ2and df were estimated by WLSMV.
1χ2was estimated with the difference test procedure in MPlus (seeMuthén and Muthén, 2012). C.I., confidence interval.
In most cases, the 3-dimensional models fitted the data significantly better than that the 1-dimensional models. In some cases, mostly in Grades 7 and 8, the 3-dimensional model fit indices were lower. This could have been because the tasks were originally developed for students in lower grades.
The fit indices dropped in the case of mathematics and science in Grade 8 but were significantly higher than that of the 1-dimensional model. Thus, the psychological, application and disciplinary dimensions of learning could be distinguished.
The psychological dimension of learning could be made visible independently of the measured domain in everyday educational settings, thus supporting Hypothesis 1.
The Psychological Dimension of Learning Across Domains
The bivariate correlations of the psychological dimensions between pairs of domains (mathematics and reading, mathematics and science, and reading and science) ranged from 0.29 to 0.49 and were statistically significant (Table 6).
At each grade level, the correlations of the psychological dimension (reasoning/thinking) tended to be the highest between mathematics and reading and lowest between mathematics and science. The strongest set of correlations, independent of the measured domain, was found in Grade 8, indicating that the
TABLE 6 |Correlations of the psychological dimension between pairs of domains from Grades 1 to 8.
Correlations of the psychological dimension
Grade Between
mathematics and reading
Between mathematics and
science
Between reading and science
1 0.426 0.372 0.407
2 0.435 0.342 0.421
3 0.390 0.289 0.340
4 0.452 0.421 0.420
5 0.436 0.404 0.429
6 0.437 0.421 0.398
7 0.440 0.429 0.395
8 0.493 0.452 0.438
All coefficients are significant at p<0.0001 level.
psychological dimension of learning in reading, mathematics and science were highly correlated, but not identical constructs.
The invariance in the psychological dimension of learning across the three domains was supported by comparing the 3-dimensional measurement model, which distinguishes the psychological dimension of reading, mathematics and science, and the 1-dimensional measurement model, which combines the psychological dimension of the different learning domains under a single factor. The specialχ2-difference test in Mplus showed that the 3-dimensional model fitted significantly better at each grade level than the 1-dimensional model (Table 7).
The Rate of Development in the Psychological Dimension
Figure 3 presents the mean cognitive development scale scores in the psychological dimension of learning reading, mathematics
and science. Please note that in each domain, the mean score of Grade 8 students was set at 500 with a standard deviation of 100, thereby constructing the point of reference for interpreting students’ achievement. This means that we cannot compare the development of the psychological dimension of learning across domains, but we can compare the rate of development.
We found that the amount and rate of cognitive development were almost the same in each domain between Grades 6 and 8 and that there was no appreciable development in reading and science between Grades 2 and 6. The greatest rate of progress occurred in Grade 1 in reading and science, but not mathematics.
Generally, there was a steady increase in the psychological dimension of learning in mathematics, especially in the first 4 years of schooling. The results confirmed our hypothesis that children’s cognitive development is slow (Molnár et al., 2013; Molnár et al., 2017), thus indicating the importance of the explicit development in this dimension in school lessons.
Overall, these results highlighted the importance, sensitivity and potential of the development of thinking skills in the early years of schooling.
Relationship Between the Three Dimension of Learning
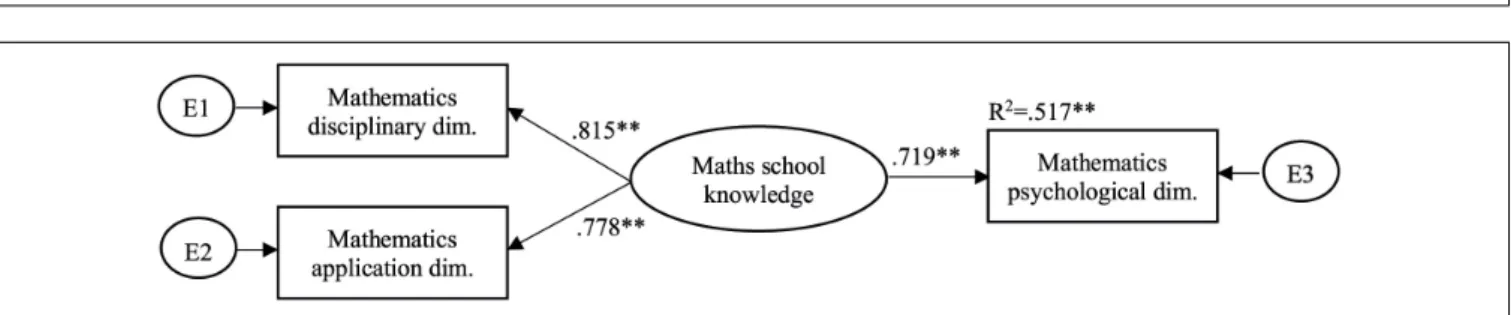
The possibility and practical relevance of separating the psychological dimension of learning can be explored from another perspective by examining the proportion of its variance that remains unexplained if the more readily visible disciplinary and application dimensions (referred to together as school knowledge) are taken into account. Technically, these dimensions may be considered as potential predictors of the psychological dimension.
We used continuous factor indicators in SEM analyses to examine the relationships between school knowledge and the
TABLE 7 |Goodness of fit indices for testing the dimensionality of the psychological dimension in reading, mathematics, and science using 1- and 3-dimensional models for Grades 1 to 8.
Grade Model χ2 df p 1χ2 1df p CFI TLI RMSEA 90% C.I.
1 3-dim. 406.929 321 0.001 55.558 3 0.001 0.963 0.959 0.046 [0.031, 0.059]
1-dim. 510.320 324 0.001 0.919 0.912 0.067 [0.056, 0.078]
2 3-dim. 282.857 167 0.001 75.885 3 0.001 0.890 0.903 0.062 [0.049, 0.074]
1-dim. 449.393 170 0.001 0.765 0.738 0.095 [0.085, 0.106]
3 3-dim. 180.800 167 0.001 20.178 3 0.001 0.921 0.910 0.036 [0.000, 0.069]
1-dim. 203.772 170 0.001 0.806 0.783 0.056 [0.014, 0.082]
4 3-dim. 209.681 206 0.001 42.211 3 0.001 0.990 0.989 0.018 [0.000, 0.060]
1-dim. 289.741 209 0.001 0.775 0.751 0.083 [0.058, 0.105]
5 3-dim. 398.477 296 0.001 126.509 3 0.001 0.934 0.928 0.039 [0.028, 0.049]
1-dim. 755.052 299 0.001 0.707 0.681 0.082 [0.075, 0.089]
6 3-dim. 592.088 431 0.001 80.817 3 0.001 0.901 0.890 0.078 [0.062, 0.093]
1-dim. 785.255 434 0.001 0.767 0.750 0.115 [0.102, 0.128]
7 3-dim. 1154.972 699 0.001 187.282 3 0.001 0.912 0.906 0.059 [0.053, 0.065]
1-dim. 1893.066 702 0.001 0.769 0.757 0.095 [0.090, 0.100]
8 3-dim. 471.630 347 0.001 142.432 3 0.001 0.918 0.911 0.042 [0.031, 0.059]
1-dim. 747.482 350 0.001 0.740 0.719 0.072 [0.065, 0.079]
df, degrees of freedom; CFI, comparative fit index; TLI, Tucker–Lewis index; RMSEA, root mean square error of approximation;χ2and df were estimated by WLSMV.
1χ2was estimated with the difference test procedure in MPlus (seeMuthén and Muthén, 2012). C.I., confidence interval.