The rare extended radio-loud narrow-line Seyfert 1 galaxy SDSS J1030+5516 at high resolution
K. ´E. Gab´anyi1 • S. Frey • P. Veres• A. Mo´or
Abstract Recently, Rakshit et al. (2018) reported the discovery of SDSS J103024.95+551622.7, a radio-loud narrow-line Seyfert 1 galaxy having a ∼100 kpc scale double-lobed radio structure. Here we analyse archival radio interferometric imaging data taken with the Very Large Array (VLA) at 5 GHz, and with the Very Long Baseline Array (VLBA) at 4.3 and 7.6 GHz. Two hotspots and a compact core are detected with the VLA at arcsec scale, while a single milliarcsec-scale compact radio core is seen with the highest resolution VLBA ob- servations. The Fermi Large Area Telescope did not detect γ-ray emission at the position of this source.
In the mid-infrared, theWide-field Infrared Survey Ex- plorersatellite light curve, covering more than 7 years and including the most recent data points, hints on flux density variability at 3.4µm. Our findings support the notion that this source is a young version of Fanaroff–
Riley type II radio galaxies.
Keywords galaxies: active; galaxies: Seyfert; galax- ies: individual: SDSS J103024.95+551622.7
K. ´E. Gab´anyi
MTA-ELTE Extragalactic Astrophysics Research Group, krisztina.g@gmail.com
S. Frey
Konkoly Observatory, MTA Research Centre for Astronomy and Earth Sciences
P. Veres
Center for Space Plasma and Aeronomic Research, University of Alabama in Huntsville
A. Mo´or
Konkoly Observatory, MTA Research Centre for Astronomy and Earth Sciences
1Konkoly Observatory, MTA Research Centre for Astronomy and Earth Sciences
1 Introduction
Narrow-line Seyfert 1 galaxies (NLS1) form a pecu- liar subclass of active galactic nuclei (AGN). They are defined by their narrow permitted optical lines (the full width at half maximum, FWHM, of Hβ line is below 2000 km s−1, Goodrich 1989), a flux ratio of [O III]λ5007 to Hβ smaller than 3 (Osterbrock and Pogge 1985), and the strong emission of the FeII mul- tiplets. However, Cracco et al. (2016) showed that having strong iron lines may not be a distinctive prop- erty of NLS1 sources in accordance with the study of quasar emission lines of Boroson and Green (1992), which showed the anticorrelation between the strength of FeII and OIIIlines.
The narrow permitted lines of NLS1 sources are ex- plained with their relatively lower-mass central black holes, 106−108M(Mathur 2000), which consequently means high accretion rates close to the Eddington limit (Boroson and Green 1992). Based upon these, Mathur (2000) proposed that NLS1 sources can be young AGN residing in rejuvenated galaxies. Alternatively, the nar- row Hβ lines of NLS1 sources can be due to orientation effect, if their disk-like broad-line regions are seen pole- on (Decarli et al. 2008).
Similarly to AGN in general, a small fraction,∼7%
of NLS1 sources are radio-loud (Komossa et al. 2006;
Zhou et al. 2006), where radio-loudness is determined by the ratio of the 6 cm radio to the 4400 ˚A optical flux density following Kellermann et al. (1989). Singh and Chand (2018) studied the radio properties of a large sample of optically-selected NLS1 sources, and found that the radio-detected ones have small sizes,
<30 kpc. The most radio-loud NLS1 sources (and the ones with the highest radio luminosity investigated by Singh and Chand 2018) show blazar-like properties: flat radio spectrum, compact radio cores, high brightness temperatures, significant variability, flat X-ray spectra,
arXiv:1904.07540v1 [astro-ph.GA] 16 Apr 2019
and altogether blazar-like spectral energy distribution (SED; e.g. Yuan et al. 2008). Several of them were also detected in γ-rays with the Fermi satellite (for a full list, see Romano et al. 2018), and in a few of them superluminally moving radio jet components were imaged with very long baseline interferometry (VLBI) technique (Lister et al. 2016). Therefore these sources, similarly to blazars, are thought to possess relativistic radio jets inclined at small angle to the line of sight.
Few of the radio-loud NLS1 sources have kpc-scale (from a few tens of kpc to∼100 kpc) radio structures.
Doi et al. (2012) found that the detection rate of ex- tended radio emission in NLS1 sources is lower than in broad-line AGN. This is confirmed more recently by Berton et al. (2018). They observed 74 NLS1 sources and found that the majority of flat-spectrum radio-loud NLS1 sources have compact morphology on kpc scale.
In most of the extended radio-loud NLS1 sources, the radio emission is two-sided (Doi et al. 2012; Richards and Lister 2015; Congiu et al. 2017; Gab´anyi et al.
2018b).
Recently, Rakshit et al. (2018) reported the discov- ery of a radio-loud NLS1 source,
SDSS J103024.95+551622.7 (hereafter J1030+5516) with arcsec-scale structure similar to those of Fanaroff–
Riley type II radio galaxies (FR II, Fanaroff and Riley 1974). The projected linear size, ∼ 110 kpc is among the largest values in radio-loud NLS1 sources. Us- ing low-resolution (∼ 500) radio data of J1030+5516 from the Faint Images of the Radio Sky at Twenty- Centimeters (FIRST) survey (Becker et al. 1995), Rak- shit et al. (2018) argue that the inclination angle of the jet in the core region is<12◦ with respect to the line of sight.
Here we present sub-arcsec resolution archival Very Large Array (VLA) A-configuration data, and milli- arcsec (mas) resolution VLBI data of J1030+5516, which support the claims of Rakshit et al. (2018). Ad- ditionally, we analysed more than 10 yr ofFermiLarge Area Telescope (LAT; Acero et al. 2015, and references therein) data to constrain the high-energy properties of the source. We also re-evaluated the mid-infrared light curves covering more than 7 yr, obtained with theWide-field Infrared Survey Explorer(WISE, Wright et al. 2010) satellite.
In the following, we assume a flat ΛCDM cosmologi- cal model withH0= 70 km s−1Mpc−1and Ωm= 0.27.
At the redshift of J1030+5516, z = 0.435, 100 angular size corresponds to a projected linear size of 5.65 kpc.
2 Observing data
2.1 Archival VLA radio data
J1030+5516 was observed at 5 GHz with the VLA in its most extended A configuration on 1992 October 20 (project code: AF233). The raw data were ob- tained from the US National Radio Astronomy Ob- servatory (NRAO) archive1. The on-source integra- tion time was 1 min, the total bandwidth was 100 MHz.
Phases and amplitudes were calibrated in the NRAO Astronomical Image Processing System (AIPS, Greisen 2003) in a standard way. The flux density scale was set using the amplitude calibrator source 3C286. We used the Difmap (Shepherd et al. 1994) software for imaging and for fitting Gaussian brightness distribu- tion model components directly to the interferometer visibility data.
2.2 Archival VLBA radio data
J1030+5516 was observed with the Very Long Base- line Array (VLBA) on 2016 May 28 at 4.3 and 7.6 GHz (project code: BP192, PI: L. Petrov) in the framework of the wide-field VLBA calibrator survey (L. Petrov 2019, in preparation). Nine (Brewster, Fort Davis, Hancock, Kitt Peak, Los Alamos, North Liberty, Owens Valley, Pie Town, St. Croix) and eight (all the above but Hancock) antennas of the array were used at the lower and higher frequency, respectively. The band- width was 256 MHz and the integration time was nearly 1 min at both frequencies. The calibrated visibilities were obtained from the Astrogeo website2.
2.3 ArchivalFermi/LATγ-ray data
We analysed the archivalFermi/LAT data of J1030+5516.
We looked for γ-ray signals in the available 10.3-year data which cover the time range between 2008 August 4 and 2018 November 26. We derivedFermi/LAT upper limits using the routines included in thefermipypack- age (Wood et al. 2017). We selected a 15◦ circular re- gion around the position of J1030+5516, and an energy range of 0.1−100 GeV. We used Pass 8, SOURCE type photons, with P8R2 SOURCE V6 responses. The fit included a diffuse galactic foreground (gll iem v6) and an isotropic component (iso P8R2 SOURCE V6 v06).
1https://archive.nrao.edu/
2http://astrogeo.org/vlbi images, maintained by L. Petrov
2.4 WISEdata
The mid-infraredWISEsatellite scanned the whole sky in four bands at 3.4, 4.6, 12, and 22µm (referred as W1, W2, W3, and W4) during its original mission phase in 2010 (Wright et al. 2010). Afterwards, the satel- lite measurements are continued within the framework of the NEOWISE (Near-Earth Object WISE) project (Mainzer et al. 2014). After four months of NEO- WISE observations, the satellite was hibernated for 34 months. Then the NEOWISE Reactivation Mission continued. In this currently on-going phase, observa- tions are conducted only at the two shorter wavelength bands, since the cooling material required for W3 and W4 receivers has been depleted. TheWISEsatellite ob- serves the same regions of the sky in every∼180 days.
We downloaded the WISEsingle exposure data3 up until 2017 November, and followed the procedure as in Gab´anyi et al. (2018a). We adapted the guidelines in the Explanatory Supplement Series4 to discard bad quality data points. None of the measurements were affected by the South-Atlantic Anomaly, or scattered light from the Moon. We used only those measurements for which the frame image quality score (‘qi_fact’) was 1.0, since values less than 1.0 mark data where resid- ual light system motion may degrade the flux measure- ments. Ten per cent of data were discarded because of this effect. The contamination and confusion flags (‘cc_flags’) did not indicate problems for any of the measurements.
The final light curve contains 177 points grouped into ten mission phases both in W1 and W2 bands. Each mission phase lasted usually for.2 days and contains 12−16 points, except for one mission phase, which is the combination of two ∼ 1-day long observations separated by 2 days and contains 26 data points.
3 Results
3.1 VLA data
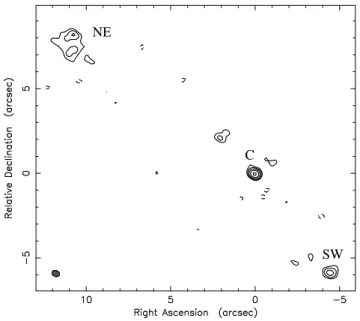
The 5-GHz VLA-A observation revealed three distinct features, the core, the southwest (SW) and the north- east (NE) lobes (Fig. 1). This structure is in good agreement with the lower-resolution FIRST image pre- sented by Rakshit et al. (2018). Three circular Gaus- sian model components can adequately describe the radio structure. Their parameters are given in Ta- ble 1. The distance between the components fitted to
3http://irsa.ipac.caltech.edu/Missions/wise.html
4http://wise2.ipac.caltech.edu/docs/release/allwise/expsup/
sec3 2.html
NE
SW C
Fig. 1 5-GHz VLA image of J1030+5516 taken on 1992 October 20. The image is centred at the brightest pixel at right ascension 10h30m24.s947 and declination 55◦16022.006.
Peak brightness is 8.4 mJy beam−1, the lowest contours are drawn at ±0.5 mJy beam−1, corresponding to ∼3σ image noise level. (Dashed lines represent negative contours.) The positive contours increase by a factor of 2. The restoring beam is 0.005×0.004 (FWHM) with a major axis position angle 68◦, as shown in the lower left corner of the image. The three fitted components listed in Table 1 are labeled
the hotspots in the SW and NE lobes is 20.0043±0.0001, which agrees well with the 20.005 source size at 1.4 GHz, as derived by Rakshit et al. (2018) from the FIRST image.
Using the overall spectral index value α = −0.65 (defined as S ∝να, whereS is the flux density and ν the frequency) and the integrated flux density S1.4 = 155 mJy derived from the 1.4-GHz FIRST data by Rak- shit et al. (2018), the flux density at 5 GHz can be ex- pected as ∼ 68 mJy. The sum of flux densities of the fitted components (Table 1),S5= 27.8 mJy, is well be- low this value, indicating that a significant amount of diffuse radio emission was resolved out in the 5-GHz VLA-A observation.
3.2 VLBA data
At both frequencies, a single unresolved component was detected with the VLBA. There was no additional radio-emitting feature down to 0.8 mJy beam−1 within the undistorted field of view with a radius of 0.003 at 4.3 GHz, and down to 1.1 mJy beam−1within the undis- torted field of view with a radius of 0.002 at 7.6 GHz.
We used theDifmap(Shepherd et al. 1994) software to fit the visibilities with a circular Gaussian bright- ness distribution. At 4.3 GHz, the radio emission can
Table 1 Parameters of the circular Gaussian components fitted to the 5-GHz VLA visibilities ID Flux density Relative RA Relative Dec. FWHM size
(mJy) (arcsec) (arcsec) (mas)
C 9.3±0.4 – – 86±37
SW 4.8±0.6 −4.47±0.03 −5.84±0.03 346±52 NE 13.7±1.7 10.87±0.08 7.67±0.07 1386±140
Notes: component name in Col. 1, flux density in Col. 2, offset in right ascension and declination with respect to the central component C in Cols. 3 and 4, and the FWHM size in Col. 5
be best described by a point source model. During model-fitting using a Gaussian brightness distribution as a starting model, the FWHM size of the feature con- verged to an unrealistically small value (∼10−6mas), indicating the unresolved nature of the detected com- ponent. The flux density of the point source model component isS4.3= 10.6±0.3 mJy.
At 7.6 GHz, a stable fit could be reached with using a single circular Gaussian component. Its parameters are: flux densityS7.6= 15.2±0.5 mJy, FWHM diame- terθ= 0.31±0.09 mas. However, this size is still smaller than the minimum resolvable angular size of the inter- ferometer array, 0.4 mas, calculated following the for- mula of Kovalev et al. (2005). Therefore J1030+5516 remained unresolved with VLBI at 7.6 GHz as well.
Using the 0.4 mas upper limit to the source size, we can calculate a lower limit to the brightness tempera- ture:
TB = 1.22×10¹²(1 +z) S
θ2ν2K, (1)
wherezis the redshift,S is the flux density in Jy,ν is the observing frequency in GHz, and θ is the FWHM size of the Gaussian component in mas. Thus, the lower limit to the brightness temperature of J1030+5516 is TB ≥3×10⁹K. This value is below the equipartition brightness temperature limit (∼5×10¹⁰K; Readhead 1994) by an order of magnitude. However, since it is a lower limit only, it does not exclude the possibility of Doppler boosting caused by relativistic beaming in the jet. More sensitive and higher-resolution VLBI data would be needed to place tighter constraints on the an- gular size of the compact central source in J1030+5516 and thus on the brightness temperature.
Using these simultaneous dual-frequency VLBA ob- servations, we can derive the two-point spectral index α7.64.3= 0.6±0.2 of the core, indicating an inverted ra- dio spectrum of the most compact component. This is not in contrast with the spectral index derived by Rak- shit et al. (2018) (α=−0.65±0.04), since that value was obtained using low-resolution radio observations.
Those measure the total flux density of J1030+5516 which is dominated by the steep-spectrum lobes and diffuse emission, completely resolved out on the long baselines of the VLBA.
0 500 1000 1500 2000 2500 3000
MJD-55316 (day) 1.5
2 2.5 3 3.5 4 4.5
Flux density (mJy)
W1 W2
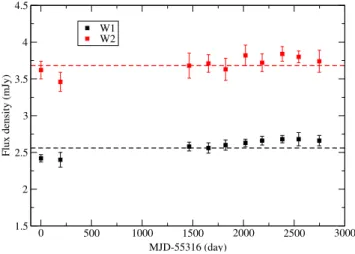
Fig. 2 Infrared light curves of J1030+5516, measured by theWISE satellite. Black and red symbols represent mea- surements made at 3.4µm (W1) and 4.6µm (W2), respec- tively. The symbols are average values of each mission phase, the error bars represent the variability within each mission phase. The dashed lines show the long-term average flux densities in the two bands
3.3 Fermi/LAT data
Noγ-ray emitting source was detected in the available Fermi/LAT data at the position of J1030+5516. The upper limits of theγ-ray fluxes in six energy ranges are given in Table 2.
3.4 WISEmid-infrared lightcurve
We converted the WISE magnitudes to flux densities, following the description in the Explanatory Supple-
Table 2 Fermi upper limits of the γ-ray flux of J1030+5516
Energy range Flux (GeV) (MeV cm−2s−1) 0.1−0.316 <4.5·10−7
0.316−1 <3.9·10−8 1−3.162 <6.8·10−8 3.162−10 <2.8·10−8 10−31.622 <6.6·10−8 31.622−100 <1.4·10−7
ment Series.5 To investigate the variability, we calcu- lated the reduced χ2 for all the data in a given band, and for each mission phase, separately. For every single mission phase, the reducedχ2.2, indicating no vari- ability on a few-day long time scale. The reduced χ2 values for all measurements are 3.3 at 3.4µm and 2.8 at 4.6µm, showing a hint of variability at the shorter wavelength.
Rakshit et al. (2018) also analysed the infrared light curve of J1030+5516 measured with the WISE satel- lite. At the time of their publication only eight mis- sion phases were available, until 2016 November. They found that the object is not variable at 3.4µm and 4.6µm. We also calculated the reduced χ2 using the first eight mission phases used by Rakshit et al. (2018).
We found that the reducedχ2are lower for both bands, 3.1 at 3.4µm and 2.4 at 4.6µm.
In Fig. 2, we plot the weighted average flux densities and the standard deviations for each mission phase in both bands.
4 Discussion
The obtained lower limit of the brightness tempera- ture of the mas-scale radio emitting core of J1030+5516 agrees well with the values derived by Gu et al. (2015) for a sample of 14 radio-loud NLS1 sources, 108.4K<
TB < 1011.4K. These low values compared to pow- erful blazar jets are explained by intrinsically low jet power by Gu et al. (2015). The brightness temper- ature measured in J1030+5516 is also similar to an- other NLS1 source with a radio structure extended to
∼150 kpc, SDSS J110006.07+442144.3 (Gab´anyi et al.
2018b). Richards and Lister (2015) investigated three radio-loud NLS1 galaxies with kpc-scale radio struc- tures and found mildly relativistic jets. Comparing the mas-scale structures, J1030+5516 is more compact and its brightness temperature is 3−20 times larger than the three NLS1 sources studied by Richards and Lister (2015).
The flux density of the core component measured at 5 GHz with the VLA at arcsec scale (9.3 ±0.4 mJy) is below the value measured at mas-scale resolution with the VLBA at a slightly lower frequency of 4.3 GHz (10.6±0.3 mJy). As this cannot be explained by res- olution effect, it is more likely related to variability of the radio flux density.
In the standard picture of expanding radio galaxies, the lobe located closer to the observer is seen farther
5http://wise2.ipac.caltech.edu/docs/release/allsky/expsup/
sec4 4h.html
away from the host galaxy in projection (Longair and Riley 1979), thus the arm-length ratio of the brighter to the fainter lobe is larger than one. In J1030+5516, the distance between the brighter NE lobe and the central compact radio feature, C isdNE= 13.003±0.001, while the fainter SW lobe is atdSW= 7.0035±0.0004. Therefore, it is most likely that the NE feature is at the approaching side of the source.
The arm-length ratio of the approaching to the re- ceding lobes can be used to estimate the inclination angle (i) of the source, assuming there is no significant difference in the medium surrounding the jets on the two sides of the host galaxy. Using the equation of Taylor and Vermeulen (1997), the arm-length ratio can be given as
dNE dSW
= 1 +βcosi
1−βcosi (2)
From the VLA data of J1030+5516, the arm-length ra- tio is 1.81, thusβcosi= 0.29, which gives a lower limit for the jet speedβ >0.3, and an upper limit for the in- clination anglei <73◦. Similar equation describes the flux density ratio of the jet and counter-jet side (Taylor and Vermeulen 1997):
SNE SSW
=
1 +βcosi 1−βcosi
k−α
, (3)
where kequals 2 for continuous jet, and 3 for discrete jet components. Rakshit et al. (2018) using the FIRST data obtained a flux density ratio of 4.35, from which using the spectral index α =−0.65 they derived β >
0.2, andi <79◦, which agree with our values obtained from the arm-length ratio. The higher resolution 5-GHz VLA data give a flux density ratio of the approaching and receding lobe of 2.85±1.8, which agrees within the errors with the value Rakshit et al. (2018) used. (Since we have no information on the spectral index of these radio features, we did not use it further to calculate the βcosivalue.)
The Doppler factor is defined as,
δ= 1
γ(1−βcosi), (4)
whereγ= 1/p
1−β2 is the Lorentz factor. Using the value βcosi = 0.29, and the lower limit on β, 0.29, one can obtain an upper limit on the Doppler factor, δ <1.34.
Doi et al. (2012) estimated the Doppler factor of a few radio-loud NLS1 sources by comparing the ob- served and intrinsic core powers. Fitting the VLA data we obtained the core flux density at 5 GHz. As- suming the spectral index of the core derived from
the VLBA data (α7.64.3 = 0.6), the observed 5-GHz power of the core is 3.6· 1024W Hz−1. The intrin- sic core power can be estimated using the empiri- cal correlation found for radio galaxies, logP5 GHzcore = (0.62±0.04) logP408 MHztotal + (7.6±1.1), whereP408 MHztotal is the source’s total power at 408 MHz (Giovannini et al.
2001). The closest frequency where the flux density of J1030+5516 was measured is 365 MHz within the framework of the Texas survey (Douglas et al. 1996).
We used that value (0.474±0.038 Jy) and the spec- tral index of the whole source derived by Rakshit et al.
(2018) to calculateP408 MHztotal . The corresponding intrin- sic 5-GHz core power is∼1024W Hz−1. Following Doi et al. (2012), if the difference between the observed and intrinsic core power is caused by relativistic beaming, their ratio can be given asδ3−α. This implies aδ= 1.7.
However, the uncertainty of the estimation of intrinsic core power allows for lowerδvalues and as high as 12.
Rakshit et al. (2018) also used the above argument to estimate a Doppler factor. Instead of the core power, they used the intrinsic and observed core dominance parameter and obtainedδ= 3.3. The derived δvalues do not contradict the result of the VLBA observation which gave a lower limit of the brightness temperature.
On the other hand,δ >1.34 cannot be accommodated with theβcosi= 0.29 derived from the kpc-scale struc- ture. Thus, if we accept the higher Doppler factors de- rived from the power of the core component, either the jet direction, i, or the jet speed, β, or both of them change significantly between the kpc and pc scale. The fact that only a single, compact radio-emitting feature was detected at mas-scale resolution indicates that the jet is not oriented close to the plane of the sky at pc scales.
The 1.4-GHz radio power of the source calculated from the flux density detected in the FIRST survey (∼150 mJy) isP1.4GHztotal = 9·1025W Hz−1. An and Baan (2012) studied the evolutionary sequence of symmetric extragalactic radio sources. On their radio power versus projected linear size diagram, J1030+5516 is among the large symmetric objects and the low-power FR II radio galaxies.
The projected linear size of the source is D ∼ 115 kpc. Assuming a constant expansion velocity and using the limitβcosi= 0.29 derived from the kpc-scale radio structure, the kinematic age of the source can be estimated as
tkin= D0
2βc = D
2βcsini = D
2·0.29c·tani =6.3·105 tani yr
(5) where D0 is the full (deprojected) size of the ra- dio source. Using the upper limit on the inclination
angle (73◦), the lower limit on the age of the kpc- scale radio structure is 2·105yr. The inclination an- gle of J1030+5516 should be below ∼ 32◦ to obtain an age &106yr and its age would reach 107yr, if the inclination angle would be . 5◦, which is not con- sistent with a nearly symmetric kpc-scale structure.
Thus, J1030+5516 seems to be younger than typical FRII radio galaxies whose lifetimes are estimated to be (106−107) yr (O’Dea et al. 2009).
Rakshit et al. (2019) investigated the infrared prop- erties of 520 NLS1 sources using WISE data. They found that more than 50% of the sources classified as variable in the AllWISE Source Catalog (Cutri et al.
2014) fall within a specific region in the WISE color–
color diagram, the ‘WISE Gamma-ray strip’ (WGS).
The WGS is defined by D’Abrusco et al. (2012) and Massaro et al. (2012) as a distinct region where blazars are located. The infrared colors of J1030+5516 place this source within the WGS as well. Based upon this and its radio-loudness, D’Abrusco et al. (2014) included J1030+5516 in the list of γ-ray emitting blazar candi- dates. They defined three classes of blazar candidate sources based on their decreasing likeliness of being blazars. J1030+5516 fell into the second class. This motivated us to analyse the availableFermi/LAT data to look for evidence ofγ-ray emission. However, noγ- ray emission was found at the position of J1030+5516.
Rakshit et al. (2018) reported that J1030+5516 did not show variability in infrared at the wavelengths 3.4µm and 4.6µm measured with the WISE satel- lite. Since their publication, data from two additional epochs of WISE measurements became public. Our analysis of ten mission phases of the WISE data indi- cate a slight hint of long-term variability at the shorter wavelength due to the two additional epochs. There is no sign of short time scale (few day long) flux density changes neither in W1 nor in W2 bands.
Contrary to the finding of Rakshit et al. (2018), Graham et al. (2015) detected optical variability in J1030+5516. Graham et al. (2015) studied the opti- cal light curves measured by the Catalina Real-time Transient Survey (Drake et al. 2009) to look for peri- odic variability in quasars, which they interpreted as in- duced by a closely separated binary supermassive black hole in those sources. They list J1030+5516 among the binary candidates with a period of 1515 days, a separation of 0.006 pc and a rest-frame merger time of 2.2·105yr (assuming a mass ratio of 0.5). However, Vaughan et al. (2016) called for cautious approach when only a few cycles are used to assess periodic variability.
In any case, whether periodic or not, J1030+5516 seems to show some variability in optical and infrared bands on time scales of years, as suggested by Graham et al.
(2015) and perhaps also by our light curve compiled fromWISEdata (Fig. 2).
5 Summary and conclusion
To reveal its structural properties at high resolution, we analysed archival radio interferometric observations of J1030+5516, a recently discovered rare radio-loud NLS1 source (Rakshit et al. 2018) having kpc-scale ex- tended structure reminiscent of FR II radio galaxies.
The compact central core and the nearly symmetric hotspots on its two sides seen in our 5-GHz VLA A- configuration image (Fig. 1) are consistent with the lower-resolution 1.4-GHz VLA FIRST survey image.
A large fraction, more than a half of the radio emis- sion originates from diffuse structures related to the two lobes, and is resolved out with the VLA at 5 GHz. At even higher, mas-scale resolution, the 4.6 and 7.6 GHz VLBA observations show a single, unresolved core fea- ture, with a brightness temperatureTB>3·109K. The observed high-resolution radio morphology and the de- rived parameters of J1030+5516 make it similar to the few known NLS1 sources with large-scale extended ra- dio emission (Richards and Lister 2015; Gab´anyi et al.
2018b).
Using the arm-length ratio, we derived a lower limit for the kpc-scale jet speed (β > 0.3), and a corre- sponding upper limit of the inclination angle,i <73◦, which are slightly more stringent than the ones given by Rakshit et al. (2018). The lack of complex radio morphology at mas scale indicates that the inner jet of J1030+5516 is not oriented close to the plane of the sky at pc scales.
TheWISEinfrared colors of the source place it in the WGS. However, our analysis of all availableFermi/LAT data did not reveal anyγ-ray emission at the position of J1030+5516. There is indication of at least some variability on a multi-year time scale, both in the mid- infrared based on the most completeWISElight curve (Fig. 2), and in the optical according to monitoring ob- servations analysed by Graham et al. (2015). Based on two epochs of radio observations, we also found indica- tion of flux density variability.
Our results support the conclusion of Rakshit et al.
(2018) that the NLS1 galaxy J1030+5516 is likely a low-power and young version of an FR II radio galaxy with a double-lobed structure. There is no indication of relativistic boosting in J1030+5516, neither from radio imaging, nor from variability orγ-ray data, however it cannot be completely ruled out either.
Acknowledgements
This project received support from the Hungarian Research, Development and Innovation Office (OTKA NN110333). K. ´E.G. was supported by the J´anos Bolyai Research Scholarship of the Hungarian Academy of Sci- ences. P.V. acknowledges support from Fermi grant NNM11AA01A. We used in our work VLBA data from project BP192F7 provided by the National Ra- dio Astronomy Observatory that is a facility of the National Science Foundation operated under cooper- ative agreement by Associated Universities, Inc. We thank Leonid Petrov for providing results of data anal- ysis prior to publication. This publication makes use of data products from the Wide-field Infrared Survey Explorer, which is a joint project of the University of California, Los Angeles, and the Jet Propulsion Lab- oratory/California Institute of Technology, funded by the National Aeronautics and Space Administration.
Conflict of Interest: The authors declare that they have no conflict of interest.
References
Acero, F., Ackermann, M., Ajello, M., Albert, A., At- wood, W.B., Axelsson, M., Baldini, L., Ballet, J., Bar- biellini, G., Bastieri, D., Belfiore, A., Bellazzini, R., Bissaldi, E., Blandford, R.D., Bloom, E.D., Bogart, J.R., Bonino, R., Bottacini, E., Bregeon, J., Britto, R.J., Bruel, P., Buehler, R., Burnett, T.H., Buson, S., Caliandro, G.A., Cameron, R.A., Caputo, R., Caragiulo, M., Car- aveo, P.A., Casandjian, J.M., Cavazzuti, E., Charles, E., Chaves, R.C.G., Chekhtman, A., Cheung, C.C., Chiang, J., Chiaro, G., Ciprini, S., Claus, R., Cohen-Tanugi, J., Cominsky, L.R., Conrad, J., Cutini, S., D’Ammando, F., de Angelis, A., DeKlotz, M., de Palma, F., Desiante, R., Digel, S.W., Di Venere, L., Drell, P.S., Dubois, R., Dumora, D., Favuzzi, C., Fegan, S.J., Ferrara, E.C., Finke, J., Franckowiak, A., Fukazawa, Y., Funk, S., Fusco, P., Gargano, F., Gasparrini, D., Giebels, B., Gigli- etto, N., Giommi, P., Giordano, F., Giroletti, M., Glanz- man, T., Godfrey, G., Grenier, I.A., Grondin, M.-H., Grove, J.E., Guillemot, L., Guiriec, S., Hadasch, D., Harding, A.K., Hays, E., Hewitt, J.W., Hill, A.B., Ho- ran, D., Iafrate, G., Jogler, T., J´ohannesson, G., Johnson, R.P., Johnson, A.S., Johnson, T.J., Johnson, W.N., Ka- mae, T., Kataoka, J., Katsuta, J., Kuss, M., La Mura, G., Landriu, D., Larsson, S., Latronico, L., Lemoine- Goumard, M., Li, J., Li, L., Longo, F., Loparco, F., Lott, B., Lovellette, M.N., Lubrano, P., Madejski, G.M., Mas- saro, F., Mayer, M., Mazziotta, M.N., McEnery, J.E., Michelson, P.F., Mirabal, N., Mizuno, T., Moiseev, A.A., Mongelli, M., Monzani, M.E., Morselli, A., Moskalenko, I.V., Murgia, S., Nuss, E., Ohno, M., Ohsugi, T., Omodei, N., Orienti, M., Orlando, E., Ormes, J.F., Paneque, D., Panetta, J.H., Perkins, J.S., Pesce-Rollins, M., Piron, F., Pivato, G., Porter, T.A., Racusin, J.L., Rando, R., Razzano, M., Razzaque, S., Reimer, A., Reimer, O., Reposeur, T., Rochester, L.S., Romani, R.W., Salvetti, D., S´anchez-Conde, M., Saz Parkinson, P.M., Schulz, A., Siskind, E.J., Smith, D.A., Spada, F., Spandre, G., Spinelli, P., Stephens, T.E., Strong, A.W., Suson, D.J., Takahashi, H., Takahashi, T., Tanaka, Y., Thayer, J.G., Thayer, J.B., Thompson, D.J., Tibaldo, L., Tibolla, O., Torres, D.F., Torresi, E., Tosti, G., Troja, E., Van Klav- eren, B., Vianello, G., Winer, B.L., Wood, K.S., Wood, M., Zimmer, S., Fermi-LAT Collaboration: Astrophys. J.
Suppl. Ser.218, 23 (2015).1501.02003
An, T., Baan, W.A.: Astrophys. J. 760, 77 (2012).
1211.1760. doi:10.1088/0004-637X/760/1/77
Becker, R.H., White, R.L., Helfand, D.J.: Astrophys. J.
450, 559 (1995). doi:10.1086/176166
Berton, M., Congiu, E., J¨arvel¨a, E., Antonucci, R., Kharb, P., Lister, M.L., Tarchi, A., Caccianiga, A., Chen, S., Foschini, L., L¨ahteenm¨aki, A., Richards, J.L., Ciroi, S., Cracco, V., Frezzato, M., La Mura, G., Rafanelli, P.: Astron. Astrophys. 614, 87 (2018). 1801.03519.
doi:10.1051/0004-6361/201832612
Boroson, T.A., Green, R.F.: Astrophys. J. Suppl. Ser.80, 109 (1992). doi:10.1086/191661
Congiu, E., Berton, M., Giroletti, M., Antonucci, R., Cac- cianiga, A., Kharb, P., Lister, M.L., Foschini, L., Ciroi, S., Cracco, V., Frezzato, M., J¨arvel¨a, E., La Mura, G.,
Richards, J.L., Rafanelli, P.: Astron. Astrophys.603, 32 (2017).1704.03881
Cracco, V., Ciroi, S., Berton, M., Di Mille, F., Foschini, L., La Mura, G., Rafanelli, P.: Mon. Not. R. Astron. Soc.
462, 1256 (2016).1607.03438
Cutri, R.M., et al.: VizieR Online Data Catalog, 328 (2014) D’Abrusco, R., Massaro, F., Ajello, M., Grindlay, J.E.,
Smith, H.A., Tosti, G.: Astrophys. J. 748, 68 (2012).
1203.0568
D’Abrusco, R., Massaro, F., Paggi, A., Smith, H.A., Masetti, N., Landoni, M., Tosti, G.: Astrophys. J. Suppl.
Ser.215, 14 (2014).1410.0029
Decarli, R., Dotti, M., Fontana, M., Haardt, F.: Mon. Not.
R. Astron. Soc.386, 15 (2008).0801.4560. doi:10.1111/j.1745- 3933.2008.00451.x
Doi, A., Nagira, H., Kawakatu, N., Kino, M., Nagai, H., Asada, K.: Astrophys. J.760, 41 (2012).1210.1303 Douglas, J.N., Bash, F.N., Bozyan, F.A., Torrence, G.W.,
Wolfe, C.: Astron. J.111, 1945 (1996). doi:10.1086/117932
Drake, A.J., Djorgovski, S.G., Mahabal, A., Beshore, E., Larson, S., Graham, M.J., Williams, R., Christensen, E., Catelan, M., Boattini, A., Gibbs, A., Hill, R., Kowalski, R.: Astrophys. J.696, 870 (2009).0809.1394
Fanaroff, B.L., Riley, J.M.: Mon. Not. R. Astron. Soc.167, 31 (1974)
Gab´anyi, K., Mo´or, A., Frey, S.: In: Revisiting narrow- line Seyfert 1 galaxies and their place in the Universe.
Proceedings of Science, PoS(NLS1-2018)042 (2018a).
1807.05802
Gab´anyi, K., Frey, S., Paragi, Z., J¨arvel¨a, E., Morokuma, T., An, T., Tanaka, M., Tar, I.: Mon. Not. R. Astron.
Soc.473, 1554 (2018b).1709.07202
Giovannini, G., Cotton, W.D., Feretti, L., Lara, L., Ven- turi, T.: Astrophys. J.552, 508 (2001).astro-ph/0101096.
doi:10.1086/320581
Goodrich, R.W.: Astrophys. J.342, 224 (1989)
Graham, M.J., Djorgovski, S.G., Stern, D., Drake, A.J., Mahabal, A.A., Donalek, C., Glikman, E., Larson, S., Christensen, E.: Mon. Not. R. Astron. Soc. 453, 1562 (2015).1507.07603
Greisen, E.W.: In: Heck, A. (ed.) Information Handling in Astronomy - Historical Vistas. Astrophysics and Space Science Library, vol. 285, p. 109 (2003)
Gu, M., Chen, Y., Komossa, S., Yuan, W., Shen, Z., Wa- jima, K., Zhou, H., Zensus, J.A.: The Astrophysical Jour- nal Supplement Series221, 3 (2015).1509.01889 Kellermann, K.I., Sramek, R., Schmidt, M., Shaffer, D.B.,
Green, R.: Astron. J.98, 1195 (1989)
Komossa, S., Voges, W., Xu, D., Mathur, S., Adorf, H.-M., Lemson, G., Duschl, W.J., Grupe, D.: Astron. J. 132, 531 (2006).astro-ph/0603680
Kovalev, Y.Y., Kellermann, K.I., Lister, M.L., Homan, D.C., Vermeulen, R.C., Cohen, M.H., Ros, E., Kadler, M., Lobanov, A.P., Zensus, J.A., Kardashev, N.S., Gurvits, L.I., Aller, M.F., Aller, H.D.: Astron. J. 130, 2473 (2005).astro-ph/0505536
Lister, M.L., Aller, M.F., Aller, H.D., Homan, D.C., Keller- mann, K.I., Kovalev, Y.Y., Pushkarev, A.B., Richards, J.L., Ros, E., Savolainen, T.: Astron. J.152, 12 (2016).
1603.03882
Longair, M.S., Riley, J.M.: Mon. Not. R. Astron. Soc.188, 625 (1979)
Mainzer, A., Bauer, J., Cutri, R.M., Grav, T., Masiero, J., Beck, R., Clarkson, P., Conrow, T., Dailey, J., Eisen- hardt, P., Fabinsky, B., Fajardo-Acosta, S., Fowler, J., Gelino, C., Grillmair, C., Heinrichsen, I., Kendall, M., Kirkpatrick, J.D., Liu, F., Masci, F., McCallon, H., Nu- gent, C.R., Papin, M., Rice, E., Royer, D., Ryan, T., Sevilla, P., Sonnett, S., Stevenson, R., Thompson, D.B., Wheelock, S., Wiemer, D., Wittman, M., Wright, E., Yan, L.: Astrophys. J.792, 30 (2014).1406.6025 Massaro, F., D’Abrusco, R., Tosti, G., Ajello, M., Gaspar-
rini, D., Grindlay, J.E., Smith, H.A.: Astrophys. J.750, 138 (2012).1203.1330
Mathur, S.: Mon. Not. R. Astron. Soc.314, 17 (2000).astro- ph/0003111
O’Dea, C.P., Daly, R.A., Kharb, P., Freeman, K.A., Baum, S.A.: Astron. Astrophys. 494, 471 (2009). 0810.1213.
doi:10.1051/0004-6361:200809416
Osterbrock, D.E., Pogge, R.W.: Astrophys. J. 297, 166 (1985)
Rakshit, S., Stalin, C.S., Hota, A., Konar, C.: Astro- phys. J. 869, 173 (2018). 1811.02147. doi:10.3847/1538- 4357/aaefe8
Rakshit, S., Johnson, A., Stalin, C.S., Gandhi, P., Hoenig, S.: Mon. Not. R. Astron. Soc. 483, 2362 (2019).
1811.11372. doi:10.1093/mnras/sty3261 Readhead, A.C.S.: Astrophys. J.426, 51 (1994)
Romano, P., Vercellone, S., Foschini, L., Tavecchio, F., Lan- doni, M., Kn¨odlseder, J.: Mon. Not. R. Astron. Soc.481, 5046 (2018).1809.03426. doi:10.1093/mnras/sty2484 Richards, J.L., Lister, M.L.: Astrophys. J.800, 8 (2015).
1501.05299
Shepherd, M.C., Pearson, T.J., Taylor, G.B.: Bull. Am.
Astron. Soc.26, 987 (1994)
Singh, V., Chand, H.: Mon. Not. R. Astron. Soc.480, 1796 (2018).1807.01945
Taylor, G.B., Vermeulen, R.C.: Astrophys. J. Lett.485, 9 (1997).astro-ph/9706011
Vaughan, S., Uttley, P., Markowitz, A.G., Huppenkothen, D., Middleton, M.J., Alston, W.N., Scargle, J.D., Farr, W.M.: Mon. Not. R. Astron. Soc. 461, 3145 (2016).
1606.02620
Wood, M., Caputo, R., Charles, E., Di Mauro, M., Mag- ill, J., Perkins, J.S., Fermi-LAT Collaboration: In: 35th International Cosmic Ray Conference, Proceedings of Sci- ence, PoS(ICRC2017)824 (2017).1707.09551
Wright, E.L., Eisenhardt, P.R.M., Mainzer, A.K., Ressler, M.E., Cutri, R.M., Jarrett, T., Kirkpatrick, J.D., Pad- gett, D., McMillan, R.S., Skrutskie, M., Stanford, S.A., Cohen, M., Walker, R.G., Mather, J.C., Leisawitz, D., Gautier, T.N. III, McLean, I., Benford, D., Lonsdale, C.J., Blain, A., Mendez, B., Irace, W.R., Duval, V., Liu, F., Royer, D., Heinrichsen, I., Howard, J., Shannon, M., Kendall, M., Walsh, A.L., Larsen, M., Cardon, J.G., Schick, S., Schwalm, M., Abid, M., Fabinsky, B., Naes, L., Tsai, C.-W.: Astron. J.140, 1868 (2010).1008.0031 Yuan, W., Zhou, H.Y., Komossa, S., Dong, X.B., Wang,
T.G., Lu, H.L., Bai, J.M.: Astrophys. J.685, 801 (2008).
0806.3755
Zhou, H., Wang, T., Yuan, W., Lu, H., Dong, X., Wang, J., Lu, Y.: Astrophys. J. Suppl. Ser. 166, 128 (2006).
astro-ph/0603759
This manuscript was prepared with the AAS LATEX macros v5.2.