Is 4C + 29.48 a γ -ray source?
K. É. Gabányi1,2, S. Frey1, T. An3
1 Konkoly Observatory, MTA Research Centre for Astronomy and Earth Sciences, Konkoly Thege Miklós út 15-17, H-1121 Bu- dapest, Hungary
2 MTA-ELTE Extragalactic Astrophysics Research Group, ELTE TTK Pázmány Péter sétány 1/A, H-1117, Budapest, Hungary
3 Shanghai Astronomical Observatory, Key Laboratory of Radio Astronomy, Chinese Academy of Sciences, 80 Nandan Road, 200030 Shanghai, P. R. China
Received/Accepted
ABSTRACT
Context.TheFermiLarge Area Telescope revealed that the extragalacticγ-ray sky is dominated by blazars, active galactic nuclei (AGN) whose jet is seen at very small angle to the line of sight. To associate and then classify theγ-ray sources, data have been col- lected from lower frequency surveys and observations. Since those have superior angular resolution and positional accuracy compared to theγ-ray observations, some associations are not straightforward.
Aims.Theγ-ray source 3FGL J1323.0+2942 is associated with the radio source 4C+29.48 and classified as a blazar of unknown type, lacking optical spectrum and redshift. The higher-resolution radio data showed that 4C+29.48 comprises three bright radio-emitting features located within a∼10-diameter area. We aim to reveal their nature and pinpoint the origin of theγ-ray emission.
Methods.We (re-)analyzed archival Very Large Array (VLA) and unpublished very long baseline interferometry (VLBI) observations conducted by the Very Long Baseline Array (VLBA) and the European VLBI Network of 4C+29.48. We also collected data form optical, infrared and X-ray surveys.
Results.According to the VLBI data, the northernmost complex of 4C+29.48 contains a blazar with a high brightness temperature compact core and a steep-spectrum jet feature. The blazar is positionally coincident with an optical source at a redshift of 1.142. Its mid-infrared colors also support its association with aγ-ray emitting blazar. The two other radio complexes have steep radio spectra similar to AGN-related lobes and do not have optical or infrared counterparts in currently available surveys. Based on the radio morphology, they are unlikely to be related to the blazar. There is an optical source between the two radio features, also detected in infrared wavebands. We discuss the possibilities whether the two radio features are lobes of a radio galaxy, or gravitationally lensed images of a background source.
Conclusions.We propose to associate theγ-ray source 3FGL J1323.0+2942 in subsequent versions of theFermicatalog with the blazar residing in northernmost complex. We suggest naming this radio source J1323+2941A to avoid misinterpretation arising from the fact that the coordinates of the currently listed radio counterpart 4C+29.48 is closer to a most probably unrelated radio source.
Key words. gamma rays: galaxies - radio continuum: galaxies - galaxies: active - quasars: individual: 4C+29.48
1. Introduction
Most of the active galactic nuclei (AGN) detected by theFermi Large Area Telescope (LAT) survey inγ-rays are classified as blazars (Ackermann et al. 2015), radio-loud AGN whose jet points at very small angle to the line of sight (Urry & Padovani 1995). Theγ-ray emitting non-blazar type AGN (2 %) include a few radio galaxies, compact symmetric objects, often regarded as young radio galaxies (Fanti 2009), and narrow-line Seyfert 1 sources. The classification of the different types ofγ-ray AGN is done by looking for the low-energy counterpart associated with the respectiveγ-ray source. The positional uncertainty ofFermi LAT is much larger than that of the lower-energy surveys used to find counterpart candidates, thus associations are not always straightforward and a few duplicate associations exist (Massaro et al. 2016).
Approximately one-third of the blazars in the catalog of Ack- ermann et al. (2015) are of uncertain type. Their counterparts ei- ther lack optical spectrum, or the quality of their optical spectra does not allow to distinguish between the two flavors of blazars, Send offprint requests to: K. É. Gabányi, e-mail:
gabanyi@konkoly.hu
flat-spectrum radio quasar (FSRQ) and BL Lac object, which are traditionally distinguished by the equivalent width of their emis- sion lines (e.g., Stickel et al. 1991).
The spectral energy distribution (SED) of blazars is domi- nated by the non-thermal emission of their jets and are character- ized by two bumps. The lower-energy bump of the SED (peaking between millimeter and X-ray regimes) originates from the syn- chrotron emission of the electrons and/or positrons in the jet. The higher-energy bump in theγ-ray regime is usually attributed to inverse Compton emission in the framework of leptonic models (e.g., Giommi et al. 2012, and references therein) or to syn- chrotron emission from heavy charged particles, for example, protons in hadronic models. In the leptonic models, the seed pho- tons originate either from the synchrotron jet (synchrotron self- Compton scenario, e.g., Dermer 1995), or from external sources, such as the accretion disk, the broad-line region (Sikora et al.
1994), and/or the torus (external Compton scenario, e.g., Der- mer & Schlickeiser 2002). Synchrotron self-Compton process is usually invoked to describe the spectral energy distribution of BL Lac objects, the external Compton mechanism is often assumed in the case of FSRQs (Massaro et al. 2016).
arXiv:1801.03124v1 [astro-ph.GA] 9 Jan 2018
Theγ-ray source 3FGL J1323.0+2942 is associated with the radio source 4C+29.48, and listed as a blazar candidate of uncer- tain type in the latest, thirdFermi LAT catalog (3FGL, Acero et al. 2015). According to the third catalog of Fermi LAT de- tected AGN (Ackermann et al. 2015), its counterpart lacks an optical spectrum.
The source was not detected by the VERITAS imaging at- mospheric Cherenkov telescope between 2007 and 2012 in the TeV regime (Archambault et al. 2016). The source is listed as an FSRQ based upon the paper of Cornwell et al. (1986) (see below). Archambault et al. (2016) calculated the VERITAS flux upper limit and found it larger than the extrapolatedFermiLAT flux measurements. Because of the unknown redshift of the source, they assumed redshifts ofz = 0.1 andz = 0.5, when taking the electron-positron pair production with photons of the extragalactic background light into account.
The source 4C+29.48 has an elongated structure in the NRAO Very Large Array Sky Survey (NVSS, Condon et al.
1998) image, which was used to cite the radio flux density of the source in the catalog of Ackermann et al. (2015). However, it is resolved into three radio sources positioned roughly along a line according to the finer-resolution Faint Images of the Radio Sky at Twenty-Centimeters survey (FIRST, Becker et al. 1995).
This triplet of radio-emitting features was already studied in the 1980s by Cornwell et al. (1986) using radio observations with the Very Large Array (VLA). Following their terminology, we will refer to the three sources from north to south as Complex A, B, and C (see Fig. 1).
Lico et al. (2016) conducted Very Long Baseline Array (VLBA) observations at 5 GHz of a sample of γ-ray sources including 4C+29.48. They reported that the source was not detected and it is excluded from their analysis due to incor- rect pointing. Morgan et al. (2011) performed very long base- line interferometry (VLBI) observation at 8 GHz of the field of 4C+29.48 using an ad-hoc array consisting of four European stations. They selected the field of 4C+29.48 to illustrate the capability of the DiFX software correlator (Deller et al. 2007) in wide-field imaging. They checked the positions of the three complexes and also mapped the entire primary beam of the ar- ray, within a radius of 9000around Complex B. They were only able to detect the northernmost feature, Complex A.
To understand the nature and pinpoint the location of the γ-ray emitting source we collected and analyzed archival radio data of 4C+29.48. We introduce these data sets and describe the data reduction in Sect. 2. We present the results of the observa- tions in Sect. 3. In Sect. 4, we discuss our findings in the light of multiwavelength information. Finally, in Sect. 5, we give a summary. We assumed a flatΛCDM cosmological model with H0 =70 km s−1Mpc−1,Ωm=0.27, andΩΛ=0.73.
2. Archival radio data 2.1. Very Large Array data
Saikia et al. (1984) conducted VLA C-configuration obser- vations of 4C+29.48 on 1980 July 13 at 4.89, and 15 GHz (project code: SINH). The on-source integration times were
∼ 27 min and ∼ 29 min, respectively. Cornwell et al. (1986) conducted VLA B-configuration observations of 4C+29.48 on 1982 September 12 at 1.47, and at 4.89 GHz (project code:
PP), and VLA A-configuration observations on 1983 November 25 at three frequencies, at 1.49, 4.86, and 14.94 GHz (project code: AS135). In each of the C and B configuration observations one intermediate-frequency channel (IF) was used with 50 MHz
bandwidth, while in the A configuration observations, two IFs were used each with 50 MHz bandwidth. In the B configura- tion observations, the on-source integration times were∼34 min at 1.47 GHz and∼ 30 min at 4.89 GHz. In the A configuration observations, the on-soure integration times were ∼ 12 min at 1.49 GHz and at 14.94 GHz, and 8 min at 4.86 GHz.
We downloaded the data from the US National Radio As- tronomy Observatory (NRAO) archive1and reduced it using the NRAO Astronomical Image Processing System (aips, Greisen 2003) in a standard way. 3C 286 was used as the primary flux density calibrator. Standardaipstasks were used to calibrate the data sets2. For imaging, we used thedifmapsoftware (Shepherd et al. 1994).
2.2. Very Long Baseline Interferometry observations
Searching the VLBI image database of the astrogeo.org web- site3, we found four 7.6 GHz and one 4.3 GHz VLBA obser- vations of the radio source J1323+2941. The coordinates of the source are right ascension 13h23m00s.8735 and declination +29◦4104400.812 with an accuracy of 0.25 mas, thus it is coin- cident with the position of Complex A seen in the FIRST im- age (Fig. 1). The source was observed within the framework of the VLBA Calibrator Survey–7 project (BP171) and the VLBA follow-up ofFermisources (S4195; Y. Y. Kovalev et al. 2018, in prep.).
We downloaded the calibrated visibility files to perform imaging and self-calibration using the difmap software. In all observations the observing setup was similar, eight separate IFs each with a bandwidth of 32 MHz were used. All the ten 25-m antennas of the VLBA participated in the observations on 2013 April 28. On 2013 May 7, May 18, and June 22 one (Pie Town), two (Fort Davis and Saint Croix), and one antenna (Fort Davis) were missing, respectively. On 2013 April 28, the on-source times at both frequencies were 40 s. On 2013 May 18 and 2013 June 22, the on-source times were∼44 min and∼6 min, respec- tively. We were not able to image the 7.6-GHz dataset taken on 2013 May 7, but the on-source time was very short, only∼10 s.
We were able to image however the three other 7.6-GHz datasets which were observed within two months, between 2013 April 28 and 2013 June 22. Since there was no significant difference be- tween the obtained images and flux densities, we combined the three observations to reduce the noise level when creating the final image of the source.
The source 4C+29.48 was also observed with the Euro- pean VLBI Network (EVN) on 2013 April 15 at 1.6 GHz (project code: EL043A, PI: R. Lico) in phase-reference mode (e.g., Beasley & Conway 1995). The observation targeted Com- plex B. The following antennas provided data: Effelsberg (Ger- many), Medicina (Italy), Onsala (Sweden), Toru´n (Poland), and the Westerbork Synthesis Radio Telescope (WSRT, the Netherlands). The observation was conducted in e-VLBI mode (Szomoru 2008). In that mode, the antennas are connected to the central EVN data processor at the Joint Institute for VLBI in Europe (JIVE, Dwingeloo, the Netherlands) via optical fi- bre networks to allow for real-time correlation. The total band- width was 128 MHz in both left and right circular polarizations,
1 The 1980 observations were among the first conducted with the com- pleted VLA. They could be found in the NRAO archive only by search- ing for the date of the observations and not by source name or coordi- nates.
2 http://www.aips.nrao.edu/cook.html
3 http://astrogeo.org/maintained by L. Petrov
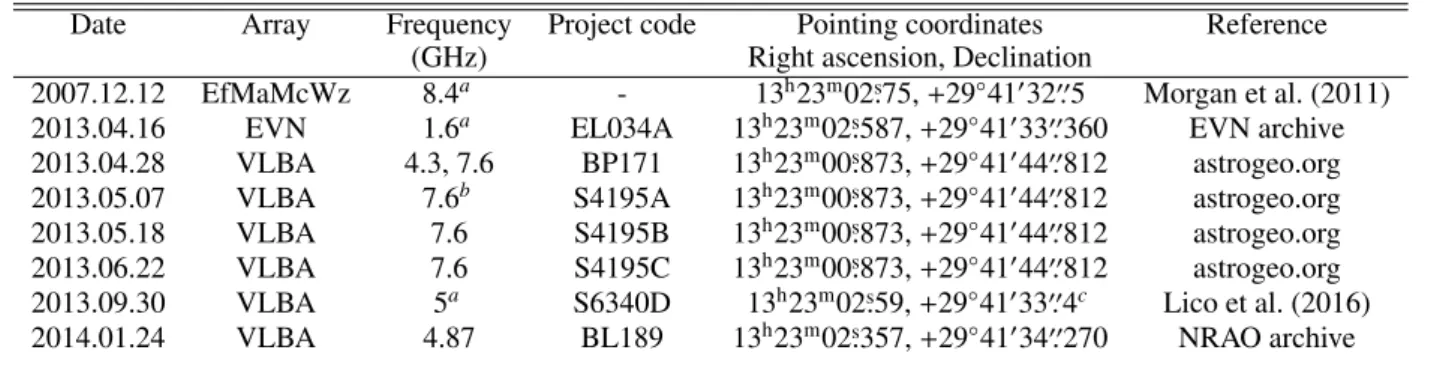
Table 1.Details of archival VLBI observations targeting 4C+29.48. In Col. 5, we list the pointing coordinates.
Date Array Frequency Project code Pointing coordinates Reference
(GHz) Right ascension, Declination
2007.12.12 EfMaMcWz 8.4a - 13h23m02s.75,+29◦4103200.5 Morgan et al. (2011) 2013.04.16 EVN 1.6a EL034A 13h23m02s.587,+29◦4103300.360 EVN archive 2013.04.28 VLBA 4.3, 7.6 BP171 13h23m00s.873,+29◦4104400.812 astrogeo.org 2013.05.07 VLBA 7.6b S4195A 13h23m00s.873,+29◦4104400.812 astrogeo.org 2013.05.18 VLBA 7.6 S4195B 13h23m00s.873,+29◦4104400.812 astrogeo.org 2013.06.22 VLBA 7.6 S4195C 13h23m00s.873,+29◦4104400.812 astrogeo.org 2013.09.30 VLBA 5a S6340D 13h23m02s.59,+29◦4103300.4c Lico et al. (2016) 2014.01.24 VLBA 4.87 BL189 13h23m02s.357,+29◦4103400.270 NRAO archive
Notes.(a)Phase-referenced observations.(b)Dataset could not be imaged.(c)The listed coordinates are from Lico et al. (2016) and not directly derived from the data as in the other cases.
and the maximum data transmission rate was 1024 Mbit s−1. The on-source integration time was ∼ 18 min. We downloaded the dataset and reduced it following the same steps as for experiment EG070A (an observation conducted in the same e-EVN session) reported in Gabányi et al. (2014).
According to the NRAO archive, 4C+29.48 was included in the project BL189 (PI: J. Linford) and observed on 2014 Jan- uary 24 at 4.87 GHz. The array consisted of the ten antennas of the VLBA. Eight separate IFs each with 32 MHz bandwidth were used. The on-source time was 296 min. This observation was not phase-referenced. The pointing coordinates given for 4C+29.48 were right ascension 13h23m02s.3570 and declination +29◦4103400.270, thus it was close to Complex B similarly to the EVN observation. The calibrator sources were J1310+3220, OQ208, and 3C286. To reduce the data we used standardaips tasks. During fringe-fitting, fringes were found for 4C+29.48 with delays of a few hundred nanoseconds reaching even mi- croseconds in a few cases. In contrast, for the calibrators the de- lays ranged from several hundred picoseconds to few nanosec- onds. The distance (∼2100) and direction (northwestern) implied by the baseline-dependent delays confirm that the found fringes originate from Complex A.
The details of the archival VLBI observations are summa- rized in Table 1. For comparison we list the already published observations of Morgan et al. (2011) and Lico et al. (2016).
The array used by Morgan et al. (2011) consisted of the follow- ing telescopes: Effelsberg (Germany), Matera (Italy), Medicina (Italy), and Wettzell (Germany).
3. Results
3.1. VLA observations
We were able to reproduce the total intensity maps published by Saikia et al. (1984) and Cornwell et al. (1986). The 4.85-GHz VLA A-configuration maps are displayed in Figs. 2, 3, 4, and 5.
The coordinates given in the zoomed-in figures of the three radio complexes are relative to the pointing coordinate, right ascen- sion 13h23m02s.537, and declination +29◦4103300.16. Moreover, in VLA A-configuration data at 14.94 GHz where Cornwell et al.
(1986) could only map Complex A, thanks to the modern data reduction software, we were able to image Complex B as well (Fig. 6). Additionally, at the position of Complex C, a faint fea- ture at 4σimage noise level corresponding to 1.3 mJy beam−1 could be tentatively detected at 14.94 GHz.
At the highest frequency in A configuration, bandwidth smearing is significant at the positions of Complexes A and
Declination (J2000)
Right Ascension (J2000)
13 23 05 00 22 55 50 45
29 44 30 00 43 30 00 42 30 00 41 30 00 40 30 00 39 30
C B
A
Fig. 1. 1.4-GHz FIRST image of 4C+29.48. Peak intensity is 614.7 mJy beam−1, lowest contour levels at 8σ image noise level, 1.3 mJy beam−1. Further contour levels are (50,250,450) × 1.3 mJy beam−1. Beam size is 500.4×500.4. The ellipse represents the posi- tion of theFermiγ-ray source (Acero et al. 2015), the circle represents the position of theROSATX-ray source (Boller et al. 2016) at 95 per cent confidence level.
C, which are ∼ 2500 and ∼ 2800 away from the phase track- ing center, respectively. The decrease of a point source response at these positions is ∼ 20 per cent (Bridle & Schwab 1999).
Correcting for this effect, Complex C has a peak brightness of
∼6.5 mJy beam−1at 14.94 GHz.
We useddifmapto model the brightness distributions of the three complexes with circular and elliptical Gaussian compo- nents at the three observing frequencies. Complex A can be mod- eled by two circular Gaussians, a compact, bright “core” (A1), and a fainter feature (A2) at ∼ 300.5 toward east at 1.49 GHz.
These two features can be seen as well at 4.86 GHz, however the higher resolution enabled to resolve the brightness distribution of A1 into three components, the brightest central, and two ad- ditional fainter features to the north and to the east. At 14.94, only the brightest component A1 can be fitted with one circular Gaussian component.
Complex B can be fitted by two circular Gaussian model components at 1.49 and 14.94 GHz. At 4.85 GHz, several cir- cular and elliptical Gaussian components were needed to reach the best fit to the visibilities. In Table 2, we give the flux density
Declination (J2000)
Right Ascension (J2000)
13 23 04.0 03.5 03.0 02.5 02.0 01.5 01.0
29 41 45
40
35
30
25
20
15
A
B
C
Fig. 2.4.86-GHz VLA-A map. Peak intensity is 211 mJy beam−1, low- est contour levels at 3σrms noise level, 0.6 mJy beam−1. Further con- tour levels increase by a factor of two. Beam size is 000.43×000.41 at a position angle of−39◦. The plus sign indicates the position of the faint optical source, SDSS J132303.03+294126.4. The cross indicates the position of the infrared source WISE J132303.04+294126.7 asso- ciated with that optical source. The positional accuracies of these mea- surements are much smaller than their representative symbols.
Arc seconds
Arc seconds
-17 -18 -19 -20 -21 -22
12.5 12.0 11.5 11.0 10.5 10.0 9.5 9.0
A1 A2
Fig. 3. 4.86-GHz VLA-A map of Complex A. Peak intensity is 211 mJy beam−1, lowest contour levels at 3σ rms noise level, 0.6 mJy beam−1. Further contour levels increase by a factor of two.
Beam size is 000.43×000.41 at a position angle of −39◦ shown at the lower left part of the image.
sum of the fitted components, and the position of the brightest one.
Complex C can be described by two circular Gaussian fea- tures at 1.49 and 4.85 GHz (C1 and C2). At 14.94 GHz, Complex C is close to the noise limit. However a stable modelfit result was achieved by adding a circular Gaussian component at the posi- tion of C1 region.
We calculated spectral indices separately for the two features in Complex A, A1, and A2. In the case of the other two radio complexes, we give one spectral index for each, by summing up the flux densities of the Gaussian components of the model. The spectral index,αis defined asS ∼να, whereS is the flux density andνis the observing frequency. For Complex B, we were able to calculate the spectral indices using the results obtained at all three observing frequencies. In the case of A1 and Complex C, even though we were able to modelfit them at 14.94 GHz, we did not use their flux densities because the significant bandwidth
Arc seconds
Arc seconds
4 3 2 1 0 -1 -2 -3
3.0 2.5 2.0 1.5 1.0 0.5 0.0 -0.5 -1.0 -1.5 -2.0
Fig. 4. 4.86-GHz VLA-A map of Complex B. Peak intensity is 78.7 mJy beam−1, lowest contour levels at 3σ rms noise level, 0.6 mJy/beam. Further contour levels increase by a factor of two. Beam size is 000.43×000.41 at a position angle of−39◦shown at the lower left part of the image. Cross indicates the pointing position of the EVN experiment EL034A, star indicates the pointing coordinates of the VLBA experi- ment BL189. Ellipse shows the position of the fitted elliptical Gaussian component to the EVN data. Its size is multiplied by 5 for clarity.
Arc seconds
Arc seconds
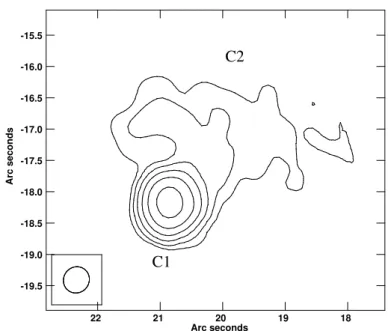
22 21 20 19 18
-15.5
-16.0
-16.5
-17.0
-17.5
-18.0
-18.5
-19.0
-19.5
C1
C2
Fig. 5. 4.86-GHz VLA-A map of Complex C. Peak intensity is 27.8 mJy beam−1, lowest contour levels at 3σ rms noise level, 0.6 mJy beam−1. Further contour levels increase by a factor of two.
Beam size is 000.43×000.41 at a position angle of −39◦ shown at the lower left part of the image.
smearing at their locations might influence the derived value.
Only A1 has a flat radio spectrum, withαA1 = −0.38±0.08.
The spectral indices of Complex B and Complex C agree within their uncertainties,αB = −1.0±0.1, andαC = −0.98±0.08.
The 1.49–4.86 GHz spectral index of A2 is also similar,αA2 =
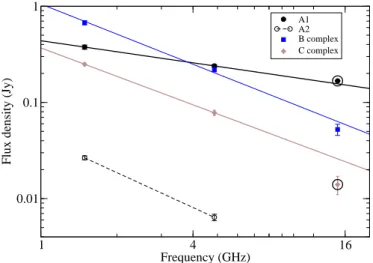
−1.2±0.03. The radio spectra are shown in Fig. 7. We also plot here the two flux density measurements not used for the spectral index calculation, marked by large black circles.
Fig. 6. VLA-A map of Complex B at 14.94 GHz. Peak intensity is 19.2 mJy beam−1, lowest contour levels at 4σ rms noise level, 1.3 mJy beam−1. Further contour levels increase by a factor of two. The restoring beam is circular with a full-width half maximum (FWHM) size of 000.13 shown at the lower left part of the image. Coordi- nates are given relative to the pointing coordinate, right ascension 13h23m02s.5370 and declination+29◦4103300.158.
1 4 16
Frequency (GHz) 0.01
0.1 1
Flux density (Jy)
A1 A2 B complex C complex
Fig. 7.Radio spectra of the detected radio components in the VLA A- configuration observations. Lines represent the best-fit power law spec- tra, while symbols are flux density measurements from the modelfits.
Filled black circles are for region A1, open black circles are for re- gion A2, blue squares are for Complex B, filled brown diamonds are for Complex C. The two points marked by black circles are not used in the fitting.
3.2. Very long baseline interferometric observations of Complex B
An extended radio source can be detected at 1.6 GHz in the EVN observation which targeted Complex B. Using thedifmappack- age to fit the visibilities, this feature can be best described by
Table 2.Results of modeling the brightness distribution of the VLA observations.
Frequency ID Flux density R.A. Dec.
(GHz) (mJy) (00) (00)
1.49 A1 376±20 −21.6 11.6
A2 27±1 −17.9 10.8
B 674±30 0.0 0.0
C1 168±8 20.7 −18.2
C2 80±4 20.4 −17.3 4.86 A1 239±10 −21.6 11.5
A2 6±0.5 −17.8 10.8
B 219±11 −0.2 −0.2
C1 59±5 20.9 −18.2 C2 19±1 20.3 −17.1 14.94 A1 (167±2) (−21.7) (11.6)
B 49±3 −0.2 −0.2
C1 (14±3) (20.8) (−18.2) Notes.For details on the flux density see text. In cols. 4 and 5, relative coordinates are given for the brightest component in each region. The uncertainties of the coordinates are 000.3 at 1.49 GHz, and 000.1 at 4.86 and 14.94 GHz. In the case of the 14.94-GHz observation, the parenthe- ses indicate that at the positions of A1 and C1 bandwidth smearing is significant, which could affect the results of the modelfit.
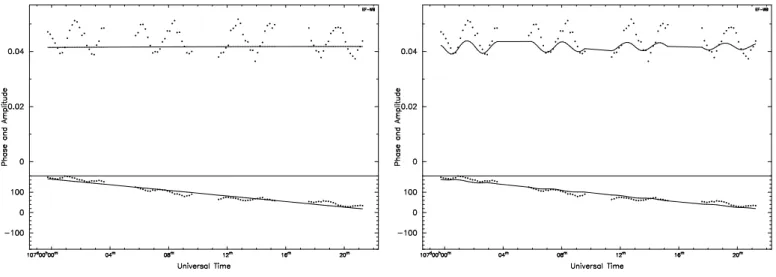
an elliptical Gaussian brightness distribution at a position a few hundred mas southwest from the pointing position, close to the peak of Complex B in the VLA images, as shown by the el- lipse in Fig. 4. Its flux density is 44.1±9.3 mJy, the full width at half maximum (FWHM) major axis size is 87±18 mas, and its axial ratio is 0.20±0.07. This single elliptical Gaussian can adequately describe most of the visibility measurements, how- ever there is a short timescale periodical variation in the visi- bilities at the Effelsberg–WSRT baseline, which cannot be fit- ted with this simple model (see left hand side of Fig. 8). There- fore, we included an additional elliptical component to describe the brightness distribution of the bright radio source related to Complex A. This model provided a better fit to the visbilities on the Effelsberg–WSRT baseline (see right hand side of Fig. 8).
Even though Complex A is located well outside of the undis- torted field of view of the array, its contribution to the visbilities can be clearly detected at the shortest and most sensitive base- line. Because of the substantial smearing, the flux density and size of the detected radio feature in Complex A cannot be firmly deduced from these data.
The VLBA experiment BL189 targeted a slightly different position than the EVN observation (Fig. 4). In this experiment, the found fringes are from the bright radio-emitting feature in Complex A, at∼2100away from the pointing position. Fringes could not be detected for Complex B.
3.3. Very Long Baseline Array observations of Complex A The VLBA images of Complex A4 show an elongated core–
jet structure oriented to north-northwest. At 4.3 GHz, the jet- like feature connecting the southern brightest core component and the possible blob in the jet is clearly detected (Fig. 9). At 7.6 GHz, the jet and this northern feature are starting to get re- solved out (Fig. 10).
We used thevimapprogram created by Kim & Trippe (2014) to produce the spectral index map between these two observing
4 Listed under the name J1323+2941 on the astrogeo.org website
Fig. 8.Visibility amplitudes in Jy (top) and phases in degrees (bottom) versus time from the EVN experiment EL034A on the Effelsberg–WSRT baseline for IF 4. Measured data are shown as points, lines represent the visibility model. Left:The model contains one elliptical Gaussian component.Right:The model also contains an additional elliptical Gaussian component around the position of Complex A.
Fig. 9.VLBA image of Complex A. The color scale represents the spectral index distribution between 4.3 and 7.6 GHz, overlaid on the contours showing the 4.3 GHz map of the source. Peak intensity is 102 mJy beam−1, the lowest contour level is at 1.35 mJy beam−1cor- responding to 3σ image noise level. The beam size is 4.9 mas× 2.3 mas at a position angle of 10◦. The image was created using the vimapprogram (Kim & Trippe 2014).
Fig. 10.7.6-GHz VLBA image of Complex A. Peak intensity is 127 mJy beam−1, lowest positive contour is at 5σimage noise level, 0.9 mJy beam−1. Further contours increase with a factor of two. The restoring beam is 3 mas×1.3 mas at a position angle of−13◦, and it is shown in the lower left corner of the image.
frequencies. The 7.6-GHz image was created with the same pixel size and restoring beam size as was used for the 4.3-GHz map.
After excluding the core region in both images,vimapcalculates the cross-correlation product to determine the shift between the two images. In our case, because of the relatively close frequen- cies, there was no need to shift the data. The resulting spectral index map is shown in Fig. 9, overlaid on the 4.3-GHz VLBA contour map. The spectral index distribution confirms the core–
jet source structure. Indeed the brightest southern feature has flat spectral index,∼0.5, as expected from the VLBI core of beamed
AGN, while the northern region has a steeper spectrum with a spectral index of∼ −1.0 typical of blazar jets (e.g., Hovatta et al.
2014).
We used the difmap software to fit the brightness distri- bution of the source with Gaussian components. At both fre- quencies, our best-fit model to the visibility data contained four Gaussian components. At 4.3 GHz, the core was fitted by the brightest and most compact circular component. Its flux density and FWHM size are S4.3 GHzcore = (92.7±8) mJy and θ4.3 GHzcore = (0.58±0.03) mas, respectively. At 7.6 GHz, the core was best
fitted by an elliptical Gaussian with the following parameters:
flux densityScore7.6 GHz = (141±10) mJy, major axis FWHM size θ7.6 GHzcore =(0.72±0.04) mas and axial ratioa=0.6±0.1.
The brightness temperature can be calculated as TB=1.22×10¹²(1+z) S
aθ2ν2 K, (1)
wherezis the redshift,S is the flux density in Jy,νis the ob- serving frequency in GHz,θis the major axis size of a Gaussian component in mas, andais the axial ratio. Using the values de- rived from the 7.6-GHz observation, the brightness temperature isTB=9.6×10⁹(1+z) K. The redshift of the optical quasar coin- cident with the radio source isz=1.142 (for details see Sect. 4), thus the brightness temperature isTB=(2.1±0.4)×1010K. This high value clearly indicates AGN origin of the radio emission.
On the other hand, it is below the commonly used equipartition brightness temperature limit of∼5×10¹⁰K (Readhead 1994), and even below 3×10¹⁰K, the characteristic brightness tempera- ture of pc-scale radio cores found by Homan et al. (2006). Thus, it does not seem to imply Doppler boosting. However, the fact that elliptical Gaussian provided the best fit to the core bright- ness distribution may indicate that the observation could not re- solve the blended VLBI core and the closest jet component. This is also supported by the fact that the major axis of the fitted ellip- tical component is in the jet direction, at∼ −25◦. Therefore the size can be regarded as an upper limit and the brightness temper- ature as a lower limit only.
4. Discussion
4.1. The origin ofγ-ray emission
Already Cornwell et al. (1986) discussed the possible nature of 4C+29.48 in the light of VLA observations. Cornwell et al.
(1986) pointed out that since there is no evidence for any phys- ical connection between the three radio sources (Complex A, B, and C), they can be completely unrelated objects. They also found that Complex A can be identified with an optical quasar.
They proposed two possibilities for Complex B and C: either they are unrelated radio sources, then B can be a head-tail radio galaxy, or they can be the two lobes of a radio galaxy too faint in the optical to be detected at that time.
More recently, Morgan et al. (2011) could strengthen the quasar identification of Complex A, since they were able to de- tect compact pc-scale radio emission there at 8.4 GHz. They con- clude that their non-detection of compact radio source in Com- plex B supports the suggestion of Cornwell et al. (1986) that this source may be a head-tail radio galaxy. With respect to Complex C, the non-detection of compact radio emission is in disagree- ment with its classification of being an edge-brightened hot spot.
We can confirm the results of Cornwell et al. (1986) that Complex A is a separate source from Complexes B and C.
Even using the more up-to-date data analysis software, we were not able to detect any faint radio features between the three complexes at any of the VLA observations down to a 3σim- age noise level of 2.6 mJy beam−1 in the VLA C-configuration data, 2.0 mJy beam−1 in the VLA B-configuration data, and 0.6 mJy beam−1 in the highest resolution VLA A-configuration data. The derived spectral indices of the brightest features of the three complexes (Fig. 7) agree with those given by Corn- well et al. (1986), even for Complex B for which Cornwell et al.
(1986) could give only two-point spectral indices, but we could detect it also at the highest frequency. Only A1 has a flat radio spectrum, all other radio features have steep spectra, indicating
their probable AGN lobe-related nature. The faint extension con- necting A1 and A2 in the 1.49-GHz and 4.86-GHz images may indicate that they are related, A2 being a brighter jet feature or hotspot in the jet of the quasar.
Similarly to Morgan et al. (2011) we could not detect com- pact radio emission in Complex B in the archival VLBI data.
However, an extended radio-emitting feature can be seen at the 1.6-GHz EVN observation at this position. In Complex A, there is a high brightness temperature, flat-spectrum VLBI core with a steep-spectrum jet pointing north-northwest. The steep-spectrum radio feature (A2) detected in the VLA observations at∼ 300.8 from A1 is outside the undistorted field of view of the VLBA ob- servations. Its flux density measured at 4.86 GHz with the VLA, (6.0±0.5) mJy, would not allow for a detection at such distance from the pointing center.
To better understand 4C+29.48 and its γ-ray emission, we complemented the radio observations with data taken at other wavebands. In the Sloan Digital Sky Survey 12th data release (SDSS DR12, Alam et al. 2015)5, there is one optical source, SDSS J132300.86+294144.8, with a position coincident with Complex A (hereafter SDSS-A). It is classified as quasar, its measured redshift is 1.142.6 This source is also listed in the first data release of theGaiamission (Gaia Collaboration et al.
2016a,b) with more accurate coordinates. The right ascension is 13h23m00s.87334 with an uncertainty of 0.452 mas, and the dec- lination is+29◦4104400.8167 with an uncertainty of 0.86 mas.
There is no coincident optical object in the SDSS at the po- sitions of Complexes B or C. However, there is a faint opti- cal source, SDSS J132303.03+294126.4 (hereafter SDSS-Z) be- tween Complexes B and C. Its position is shown in Fig. 2. Ac- cording to SDSS DR12, the photometry of this faint object is unreliable. (Persumably because of its faintness it was not de- tected byGaia.)
In the infrared catalog based upon the measurements of the Wide-field Infrared Survey Explorer (WISE, Wright et al.
2010) (AllWISE, Cutri et al. 2014) we looked for counterparts of the sources. WISE J132300.86+294144.7 (hereafter WISE- A) is positionally coincident with Complex A, while WISE J132303.04+294126.7 (hereafter WISE-Z) is located between Complexes B and C, and positionally coincident with the faint optical source, SDSS-Z found there. WISE-A was detected in three out of the four WISE bands, at 3.35µm, 4.6µm, and 11.6µm with a signal-to-noise ratio (S/N) larger than five. In the longest- wavelength band, at 22µm, only an upper limit can be given for its brightness. WISE-Z was detected in all fourWISEbands with an S/N larger than five.
Based upon the WISE observations in the three shorter- wavelength bands, D’Abrusco et al. (2012) defined the WISE Gamma-ray Strip (WGS, see also Massaro et al. 2012), the area in the infrared color–color diagram where the Fermi-detected blazars are located. In Fig. 11, we show the position of the two WISEsources with respect to the two subregions of the WGS, the area occupied by BL Lac objects and by FSRQs. The in- frared colors of WISE-A place it within the WGS. However, WISE-Z is clearly out of this region, its infrared colors are in- compatible with those sources belonging to the WGS. According to the color–color diagram of Wright et al. (2010) and Massaro et al. (2016), the mid-infrared characteristics of WISE-Z place it closer to the region where the luminous infrared galaxies, and
5 http://skyserver.sdss.org/dr12/en/home.aspx
6 The VERITAS non-detection of the source in TeVγ-rays (Archam- bault et al. 2016) is not surprising given that the currently known highest redshift TeV sources are atz∼1 (Manganaro et al. 2016).
1 2 3 4 5 [4.6]-[12]
0 0.5 1 1.5 2
[3.4]-[4.6]
BL Lac FSRQ
WISE-A
WISE-Z
Fig. 11.WISE Gamma-ray Strip following D’Abrusco et al. (2012) and Massaro et al. (2012) are shown for BL Lac objects (solid line) and Flat Spectrum Radio Quasars (dashed line) on a color–color diagram using the three shorter wavelength bands ofWISE. The circle represents the infrared colors of WISE-A, the triangle represents the infrared colors WISE-Z.
ultra-luminous infrared galaxies are located. In Table 3, we sum- marize the above discussed sources, their coordinates and possi- ble counterparts.
There is one X-ray source, 2RXS J132302.9+294115, in the 0.1−2.4 keV energy range listed in the Second ROSAT all-sky survey source catalog (Boller et al. 2016) close to region occu- pied by 4C+29.48. Its location with respect to the three radio complexes is shown in Fig. 1. Ackermann et al. (2015) claim that the probability of the X-ray–γ-ray association is below their threshold of 0.8. The position of the X-ray source might indicate its possible relation to the optical and infrared source between Complexes B and C (i.e., SDSS-Z, WISE-Z).
In Fig. 1, we overplot the 95 per cent confidence radius of theFermidetection in the FIRST image of 4C+29.48. It is clear that Complex A is closer to the center of the confidence region than Complex B. Also the combined radio, optical, and infrared data all agree with Complex A being a blazar, which make up 98 per cent of theFermi-detected extragalactic gamma-ray sources (e.g., Ackermann et al. 2015).
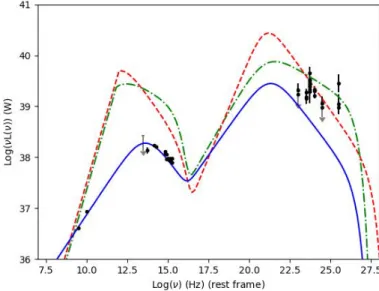
Ghisellini et al. (2017) described the average SED of the Fermi-detected BL Lac objects and FSRQs. In Fig. 12, we plot the radio (VLA A-configuration flux density of A1), the infrared (WISE-A) and the optical data (SDSS-A) of Complex A together with the γ-ray data measured by Fermi LAT. The latter were obtained through the portal of the Space Science Data Center (SSDC) SED builder tool7using the followingFermicatalogs of Abdo et al. (2010), Nolan et al. (2012), and Acero et al. (2015).
We overplot the curves from Ghisellini et al. (2017) describing the average BL Lac object and FSRQ obtained for the luminos- ity bin 1040−1041W. While these curves are close to theγ-ray measurements, they vastly overestimate the low-frequency data points.
We fitted a third-order polynomial to the radio, infrared and optical data to estimate the position and luminosity of the syn- chrotron peak, 3.6·1013Hz, and 5·1024W, respectively. Ghis- ellini et al. (2017) fixed the radio part of their SED to a power- law with an exponent of −0.1. In the case of Complex A we found that using the derived values for the synchrotron peak, a
7 http://tools.asdc.asi.it/SED/
Fig. 12.SED of the source in Complex A (calculated in the rest frame of the source at z = 1.142). Black dots represent radio (VLA A- configuration), infrared (WISE), optical (SDSS), andγ-ray (Fermi) ob- servations. Gray arrows indicate upper limits. Dashed red, and dotted- dashed green lines are the SED derived by Ghisellini et al. (2017) for theFermi-detected FSRQ and BL Lac objects, respectively, in the lu- minosity bin of 1040−1041W. Solid blue line is obtained via fitting the synchrotron peak and keeping the inverse Compton peak at the fre- quency derived by Ghisellini et al. (2017) (for further details see text).
single curve can provide an adequate description of the data from the radio to the optical (blue solid line in Fig. 12). The equation of the curve is given in Eq. (3) of Ghisellini et al. (2017), the pa- rameters areνS =3.6·1013Hz (the frequency of the synchrotron peak),α1 =0.52,α2=1.42, andνcut,S=1016Hz.
The inverse Compton peak is much less constrained. The largestγ-ray flux was reported in the light curve published in the secondFermiLAT catalog (Nolan et al. 2012, 2FGL), where the photon flux over the whole energy range (between 100 MeV and 100 GeV) is given. These measurements are shown at 10 GeV in Fig. 12. Assuming that the inverse-Compton peak is at the low- estFermiband at 200 MeV, the largestγ-ray flux measured there is 2·1023W, resulting in a Compton dominance parameter (the ratio ofνLνat the inverse Compton peak to the value at the syn- chrotron peak) of 11. On the other hand, if we try to describe the high-energy part of the SED together with the curve derived for the synchrotron peak with high-energy parameters in the same range that of Ghisellini et al. (2017), thus keeping the inverse Compton peak at∼ 1021Hz, a Compton dominance parameter of 15, which was the largest obtained by Ghisellini et al. (2017), would still underestimate theγ-ray measurements, as shown by the solid blue curve in Fig. 12.
However, the measurements conducted in the different bands are not simultaneous, thus source variability may significantly influence the shape of the SED. According to the γ-ray light curve of Nolan et al. (2012), and also by comparing the val- ues from the differentFermicatalogs, the source is highly vari- able. Therefore a reliable SED can only be constructed from si- multaneous measurements. Additionally, observation of corre- lated variability in the optical andγ-ray bands would provide unequivocal evidence for the identification of the optical quasar atz=1.142 and the radio source in Complex A with theFermi- detectedγ-ray emission.
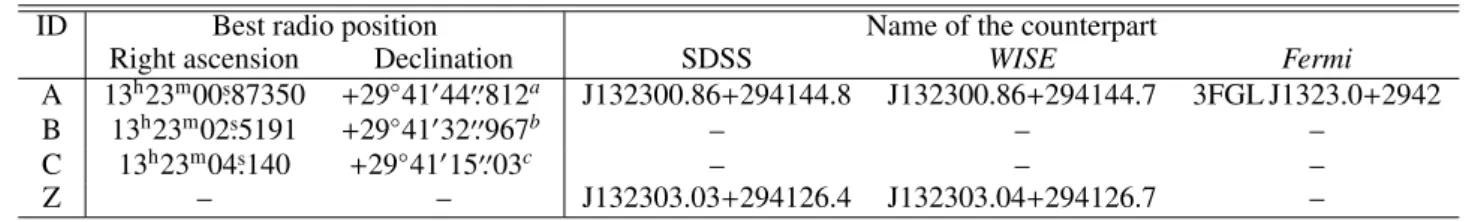
Table 3.Names, most accurate coordinates, and counterparts of the sources discussed. In footnotes we give the references for the coordinates.
ID Best radio position Name of the counterpart
Right ascension Declination SDSS WISE Fermi
A 13h23m00s.87350 +29◦4104400.812a J132300.86+294144.8 J132300.86+294144.7 3FGL J1323.0+2942
B 13h23m02s.5191 +29◦4103200.967b – – –
C 13h23m04s.140 +29◦4101500.03c – – –
Z – – J132303.03+294126.4 J132303.04+294126.7 –
Notes.(a)7.6-GHz VLBA observations(b)14.94-GHz VLA A-configuration observation (Cornwell et al. 1986)(c)4.86-GHz VLA A-configuration observation (Cornwell et al. 1986)
4.2. One object, two objects, or three?
The nature of the radio sources of Complexes B and C is however still uncertain. In the following we discuss possible scenarios of the connections of the three radio complexes.
In principle all of them can be related to one source. In that case, Complexes B and C can be jet features or hot spots in the jet of the blazar residing in Complex A. The angular sep- arations of Complexes B and C from the blazar are 2400.5 and 5100.2, corresponding to projected linear sizes of∼202 kpc and
∼ 422 kpc, respectively at the redshift of Complex A. Assum- ing that they are at z = 1.142, their 1.49-GHz radio powers are PB = 4.9×1027W Hz−1, PC1 = 1.2×1027W Hz−1, and PC2 =6.8×1026W Hz−1. These values alone do not contradict the proposed picture, for example, Kharb et al. (2010) studied the kpc-scale radio morphologies of a flux-limited sample of blazars and found radio powers as high as 1028W Hz−1. In this scenario one would expect to see similar jet-related features on the other side of Complex A, however there are no such radio- emitting features present there as can be seen for example, in the FIRST image in Fig. 1. Additionally, the morphology of Complex B is hard to reconcile with a south-east directed jet, it may indicate interaction with the surrounding medium.
Another possibility is that the three radio complexes belong to two different sources: Complex A is a blazar, and Complexes B and C are part of another object only in chance alignment with the blazar. Complexes B and C can be the two radio lobes of a radio galaxy as suggested already by Cornwell et al. (1986). In that case the faint optical source, SDSS-Z (and the associated infrared source WISE-Z) between them could be identified with the host galaxy. In that scenario, the lobe located closer to the observer would be the brighter radio feature, Complex B. This is also supported by the fact that Complex B is more polarized than Complex C (Cornwell et al. 1986). In the usual picture of expanding radio galaxies, the advancing lobe (i.e., closer to the observer) is seen further away from the host galaxy in projection based on light travel time arguments (Longair & Riley 1979);
the arm-length ratio of the bright to faint lobes are larger than one. However, Complex B, the brighter of the lobes is closer to the assumed host galaxy, the arm length ratio of Complex B to Complex C is∼0.5. This could mean that instead of projection effects, the distance to the host galaxy and the brightness of the radio lobes are mostly influenced by the surrounding medium, which is significantly asymmetric on the two sides of the host galaxy.
Alternatively, Complexes B and C could also be gravita- tionally lensed images of the same background source. Their radio spectral indices agree within the uncertainties, support- ing this idea. If the two radio sources are indeed images of one background source, the image separation would be com- parable to the the largest one reported so far, which is 2200.5, in the case of SDSS J102913.94+262317.9 (Inada et al. 2006).
Such large image separation requires a massive lensing ob- ject - a cluster of galaxies (Inada et al. 2003). In the case of SDSS J102913.94+262317.9, the possible lensing cluster of galaxies could be detected in optical wavelengths. In our case, however, there is no indication of a cluster near the radio sources in the SDSS.
According to Cornwell et al. (1986), the probability of an unrelated source with 1.49-GHz flux density similar to those of Complexes C or A at a distance of∼ 2500 from Complex B is
∼5×10⁻⁵. If the radio features belong to different galaxies their proximity can be explained if their hosts reside in a galaxy clus- ter as suggested by Cornwell et al. (1986). However, according to the SDSS images, there is no indication of the existence of a galaxy cluster in this region.
5. Summary
Theγ-ray source 3FGL J1323.0+2942 is associated with the ra- dio source 4C+29.48, and classified as a blazar of unknown type (Acero et al. 2015). Its elongated radio structure seen in the NVSS map is resolved into three bright radio features, Com- plexes A, B, and C, in the better-resolution FIRST image (Fig.
1). VLBI observation of Lico et al. (2016) pointing close to the middle source, Complex B, was not able to detect compact ra- dio emission. The wide-field imaging of Morgan et al. (2011) showed that only Complex A includes pc-scale compact VLBI feature.
We analyzed archival, not yet published EVN and VLBA ob- servations and re-analyzed VLA observations of Cornwell et al.
(1986) and Saikia et al. (1984). These revealed that Complex A is a blazar with a north-northwest jet structure at pc-scales, which is most probably bent by∼90◦to create the east-bound jet fea- ture seen at kpc scales. Complexes C and B consist of features with steep radio spectra, they are more reminiscent of lobe-like radio emission.
The accurate radio coordinates of the blazar in Com- plex A are right ascension 13h23m00s.87350 and declination +29◦4104400.812. It has an optical counterpart in the SDSS DR12 at a redshift of 1.142, and an infrared counterpart in the All- WISE catalog. The infrared colors of the WISE source place it in an area of the WISE three-color color–color diagram where most of theγ-ray emitting blazars reside according to D’Abrusco et al. (2012). Thus this is the most probable counterpart of the Fermi-detectedγ-ray source. We compared the SED of Complex A to the average SED ofFermi-detected blazars (Ghisellini et al.
2017). The observedγ-ray flux density is much higher than those expected from the low-energy part of the SED. This is possibly due to variability since the radio, infrared, optical andγ-ray data were not observed at the same time.
The nature of Complexes B and C is still ambiguous. They are unlikely to be related to the blazar in Complex A. In that case
one would expect to detect similar radio-emitting feature(s) on the other side of the blazar. If they are physically unrelated to Complex A, they can still belong to a single object, (i) being the two lobes of a radio galaxy or (ii) being the gravitationally lensed images of one background source. In the first case, the faint op- tical source and coincident infrared source located between the two radio-emitting features might be the host galaxy. However, the surrounding interstellar matter has to be quite asymmetric to cause an advancing lobe (Complex B) seen much closer to the host galaxy in projection than the receding one. In the second case, a cluster of galaxies are needed to act as a lens to provide the large image separation observed. However, there is no sign of such in the SDSS images.
Intermediate-resolution deep radio observations may reveal additional faint radio-emitting features providing support for the scenario which explains Complexes B and C as lobes of a radio galaxy. Additional sensitive optical observation can shed light on the nature of the optical and infrared source located between the two radio Complexes B and C.
Since the radio source 4C+29.48 when imaged with suf- ficiently high resolution consists of three potentially unrelated radio sources seen in projection, we suggest the Fermi source 3FGL J1323.0+2942 to be associated with the blazar residing in Complex A and we suggest to name it J1323+2941A in sub- sequent additions of the Fermi catalog. Additionally, we pro- pose to designate Complexes B and C as J1323+2941B and J1323+2941C, respectively. This would eliminate potential mis- interpretations arising because the coordinates of 4C+29.48 are close to those of the middle component (Complex B), while we have shown that theγ-ray source is almost certainly the blazar J1323+2941A (Complex A) atz=1.142.
References
Abdo, A. A., Ackermann, M., Ajello, M., et al. 2010, ApJS, 188, 405 Acero, F., Ackermann, M., Ajello, M., et al. 2015, ApJS, 218, 23 Ackermann, M., Ajello, M., Atwood, W. B., et al. 2015, ApJ, 810, 14 Alam, S., Albareti, F. D., Allende Prieto, C., et al. 2015, ApJS, 219, 12 Archambault, S., Archer, A., Benbow, W., et al. 2016, AJ, 151, 142
Beasley, A. J. & Conway, J. E. 1995, in ASP Conf. Ser., Vol. 82, Very Long Baseline Interferometry and the VLBA, ed. J. A. Zensus, P. J. Diamond, &
P. J. Napier, 327
Becker, R. H., White, R. L., & Helfand, D. J. 1995, ApJ, 450, 559 Boller, T., Freyberg, M. J., Trümper, J., et al. 2016, A&A, 588, A103
Bridle, A. H. & Schwab, F. R. 1999, in ASP Conf. Ser., Vol. 180, Synthesis Imaging in Radio Astronomy II, ed. G. B. Taylor, C. L. Carilli, & R. A. Perley, 371
Condon, J. J., Cotton, W. D., Greisen, E. W., et al. 1998, AJ, 115, 1693 Cornwell, T. J., Saikia, D. J., Shastri, P., et al. 1986, Journal of Astrophysics and
Astronomy, 7, 119
Cutri et al., R. M. 2014, VizieR Online Data Catalog, 2328 D’Abrusco, R., Massaro, F., Ajello, M., et al. 2012, ApJ, 748, 68 Deller, A. T., Tingay, S. J., Bailes, M., & West, C. 2007, PASP, 119, 318 Dermer, C. D. 1995, ApJ, 446, L63
Dermer, C. D. & Schlickeiser, R. 2002, ApJ, 575, 667 Fanti, C. 2009, Astronomische Nachrichten, 330, 120
Gabányi, K. É., Frey, S., Xiao, T., et al. 2014, MNRAS, 443, 1509
Gaia Collaboration, Brown, A. G. A., Vallenari, A., et al. 2016a, A&A, 595, A2 Gaia Collaboration, Prusti, T., de Bruijne, J. H. J., et al. 2016b, A&A, 595, A1 Ghisellini, G., Righi, C., Costamante, L., & Tavecchio, F. 2017, MNRAS, 469,
255
Giommi, P., Padovani, P., Polenta, G., et al. 2012, MNRAS, 420, 2899 Greisen, E. W. 2003, Information Handling in Astronomy - Historical Vistas,
285, 109
Homan, D. C., Kovalev, Y. Y., Lister, M. L., et al. 2006, ApJ, 642, L115 Hovatta, T., Aller, M. F., Aller, H. D., et al. 2014, AJ, 147, 143 Inada, N., Oguri, M., Morokuma, T., et al. 2006, ApJ, 653, L97 Inada, N., Oguri, M., Pindor, B., et al. 2003, Nature, 426, 810 Kharb, P., Lister, M. L., & Cooper, N. J. 2010, ApJ, 710, 764
Kim, J.-Y. & Trippe, S. 2014, Journal of Korean Astronomical Society, 47, 195 Lico, R., Giroletti, M., Orienti, M., & D’Ammando, F. 2016, A&A, 594, A60
Longair, M. S. & Riley, J. M. 1979, MNRAS, 188, 625
Manganaro, M., Becerra, J., Nievas, M., et al. 2016, in Journal of Physics Con- ference Series, Vol. 718, Journal of Physics Conference Series, 052022 Massaro, F., D’Abrusco, R., Tosti, G., et al. 2012, ApJ, 750, 138 Massaro, F., Thompson, D. J., & Ferrara, E. C. 2016, A&A Rev., 24, 2 Morgan, J. S., Mantovani, F., Deller, A. T., et al. 2011, A&A, 526, A140 Nolan, P. L., Abdo, A. A., Ackermann, M., et al. 2012, ApJS, 199, 31 Readhead, A. C. S. 1994, ApJ, 426, 51
Saikia, D. J., Shastri, P., Sinha, R. P., Kapahi, V. K., & Swarup, G. 1984, Journal of Astrophysics and Astronomy, 5, 429
Shepherd, M. C., Pearson, T. J., & Taylor, G. B. 1994, BAAS, 26, 987 Sikora, M., Begelman, M. C., & Rees, M. J. 1994, ApJ, 421, 153
Stickel, M., Padovani, P., Urry, C. M., Fried, J. W., & Kühr, H. 1991, ApJ, 374, 431
Szomoru, A. 2008, in Proceedings of the 9th European VLBI Network Sympo- sium on The role of VLBI in the Golden Age for Radio Astronomy and EVN Users Meeting (Proceedings of Science (PoS, Trieste, Italy)), 40
Urry, C. M. & Padovani, P. 1995, PASP, 107, 803
Wright, E. L., Eisenhardt, P. R. M., Mainzer, A. K., et al. 2010, AJ, 140, 1868
Acknowledgements. This project was supported by the János Bolyai Research Scholarship of the Hungarian Academy of Sciences, by the Hungarian Na- tional Research Development and Innovation Office (OTKA NN110333), and by the China–Hungary Collaboration and Exchange Programme by the Inter- national Cooperation Bureau of the Chinese Academy of Sciences (CAS). T.
A. acknowledges the grant of the Youth Innovation Promotion Association of CAS. KÉG wishes to thank G. Orosz for his help with the SED plotting. We made use of the Astrogeo VLBI FITS image database (http://astrogeo.
org/vlbi_images). The National Radio Astronomy Observatory is a facility of the National Science Foundation operated under cooperative agreement by Associated Universities, Inc. The European VLBI Network is a joint facility of independent European, African, Asian, and North American radio astronomy institutes. Scientific results from data presented in this publication are derived from the following EVN project code: EL034A. This research has made use of the NASA/IPAC Extragalactic Database (NED) which is operated by the Jet Propulsion Laboratory, California Institute of Technology, under contract with the National Aeronautics and Space Administration. Funding for SDSS- III has been provided by the Alfred P. Sloan Foundation, the Participating In- stitutions, the National Science Foundation, and the U.S. Department of Energy Office of Science. The SDSS-III web site is http://www.sdss3.org/. SDSS-III is managed by the Astrophysical Research Consortium for the Participating In- stitutions of the SDSS-III Collaboration including the University of Arizona, the Brazilian Participation Group, Brookhaven National Laboratory, Carnegie Mellon University, University of Florida, the French Participation Group, the German Participation Group, Harvard University, the Instituto de Astrofisica de Canarias, the Michigan State/Notre Dame/JINA Participation Group, Johns Hopkins University, Lawrence Berkeley National Laboratory, Max Planck In- stitute for Astrophysics, Max Planck Institute for Extraterrestrial Physics, New Mexico State University, New York University, Ohio State University, Penn- sylvania State University, University of Portsmouth, Princeton University, the Spanish Participation Group, University of Tokyo, University of Utah, Vander- bilt University, University of Virginia, University of Washington, and Yale Uni- versity. This publication makes use of data products from the Wide-field In- frared Survey Explorer, which is a joint project of the University of California, Los Angeles, and the Jet Propulsion Laboratory/California Institute of Technol- ogy, funded by the National Aeronautics and Space Administration. This work has made use of data from the European Space Agency (ESA) missionGaia (https://www.cosmos.esa.int/gaia), processed by theGaiaData Process- ing and Analysis Consortium (DPAC,https://www.cosmos.esa.int/web/
gaia/dpac/consortium). Funding for the DPAC has been provided by na- tional institutions, in particular the institutions participating in theGaiaMultilat- eral Agreement. Part of this work is based on archival data, and online services provided by the Space Science Data Center - ASI.