The radio structure of the peculiar narrow-line Seyfert 1 galaxy candidate J1100+4421
K. ´ E. Gab´ anyi,
1,2?S. Frey,
1Z. Paragi,
3E. J¨ arvel¨ a,
4,5T. Morokuma,
6T. An,
7,8M. Tanaka,
9I. Tar
101Konkoly Observatory, MTA Research Centre for Astronomy and Earth Sciences, Konkoly Thege Mikl´os ´ut 15-17, H-1121 Budapest, Hungary
2MTA-ELTE Extragalactic Astrophysics Research Group, ELTE TTK P´azm´any P´eter s´et´any 1/A, H-1117, Budapest, Hungary
3Joint Institute for VLBI ERIC, P.O. Box 2, 7990 AA Dwingeloo, The Netherlands
4Aalto University Mets¨ahovi Radio Observatory, Mets¨ahovintie 114, FI-02540 Kylm¨al¨a, Finland
5Aalto University Department of Electronics and Nanoengineering, P.O. Box 15500, FI-00076 Aalto, Finland
6Institute of Astronomy, Graduate School of Science, University of Tokyo, 2-21-1, Osawa, Mitaka, Tokyo 181-0015, Japan
7Shanghai Astronomical Observatory, Chinese Academy of Sciences, 80 Nandan Road, 200030 Shanghai, P. R. China
8Key Laboratory of Radio Astronomy, Chinese Academy of Sciences, 210008 Nanjing, P. R. China
9National Astronomical Observatory of Japan, Mitaka, Tokyo 181-8588, Japan
10Department of Astronomy, E¨otv¨os University, P.O. Box 32, H-1518 Budapest, Hungary
Accepted XXX. Received YYY; in original form ZZZ
ABSTRACT
Narrow-line Seyfert 1 galaxies (NLS1) are an intriguing subclass of active galactic nuclei. Their observed properties indicate low central black hole mass and high ac- cretion rate. The extremely radio-loud NLS1 sources often show relativistic beaming and are usually regarded as younger counterparts of blazars. Recently, the object SDSS J110006.07+442144.3 was reported as a candidate NLS1 source. The character- istics of its dramatic optical flare indicated its jet-related origin. The spectral energy distribution of the object was similar to that of theγ-ray detected radio-loud NLS1, PMN J0948+0022. Our high-resolution European Very Long Baseline Interferometry Network observations at 1.7 and 5 GHz revealed a compact core feature with a bright- ness temperature of & 1010K. Using the lowest brightness temperature value and assuming a moderate Lorentz factor of ∼9 the jet viewing angle is .26◦. Archival Very Large Array data show a large-scale radio structure with a projected linear size of∼150 kpc reminiscent of double-sided morphology.
Key words: galaxies: active – galaxies: Seyfert – galaxies: individual: SDSS J110006.07+442144.3
1 INTRODUCTION
Narrow-line Seyfert 1 galaxies (NLS1, e.g.Pogge 2000) form a special subclass of active galactic nuclei (AGN). They were first recognized as Seyfert 1 galaxies with unusually narrow Hilines (Osterbrock & Pogge 1985). NLS1 sources are identified by three features: (i) narrow permitted opti- cal lines, with full width at half-maximum FWHM(Hβ) <
2000 km s−1, (ii) a flux ratio of [Oiii]λ5007 to Hβ smaller than 3, and (iii) the strong emission feature caused by Feii multiplets. The latter indicates a direct view to the accretion disk, although very recently, based upon the spectroscopic studies of a large sample of NLS1 candidate sources,Cracco et al.(2016) concluded that NLS1 sources do not necessar-
? E-mail: gabanyi@konkoly.hu
ily have strong Feii emission lines. The relatively narrow widths of the permitted lines are explained with the lower velocities of the clouds in the broad-line region orbiting a low-mass black hole, 106−108 M (Mathur 2000). These low-mass black holes in NLS1 sources accrete at high rates, close to the Eddington limit (e.g. Collin & Kawaguchi 2004, and references therein).
Concerning the radio emission, statistical studies showed that only ∼7 per cent of NLS1 sources are radio loud (e.g.Zhou et al. 2006;Komossa et al. 2006). The radio- loudness is commonly assessed following the original pre- scription ofKellermann et al.(1989), using the ratio of the 6 cm radio flux density to the 4400˚A optical flux density (R), and sources are usually classified to be radio-loud if
R&10 (e.g.,Komossa et al. 2006). Most of the radio-loud
NLS1 (RLNLS1) sources have steep spectra and resemble
arXiv:1709.07202v1 [astro-ph.GA] 21 Sep 2017
the compact steep-spectrum sources (Komossa et al. 2006).
However, the extremely radio-loud NLS1s (∼ 2.5 per cent of NLS1 sources, withR≥100;Komossa et al. 2006) show blazar-like properties: flat radio spectrum, compact radio cores, substantial variability, high brightness temperatures, flat X-ray spectra, and blazar-like spectral energy distribu- tion (e.g.Yuan et al. 2008). Thus, these objects are thought to possess relativistic jets which are seen at a small angle to the line of sight, similarly to blazars. This claim was fur- ther strengthened by the Fermisatellite discovery of high- energy emission from a handful of RLNLS1 sources (e.g.Yao et al. 2015;Karamanavis 2015;Foschini 2011, and references therein). Further support of their blazar-like nature came from the Monitoring Of Jets in Active galactic nuclei with VLBA Experiments (MOJAVE, Lister et al. 2009) survey.
Among the fiveFermi-detected RLNLS1 sources included in their sample, three show jet components moving at super- luminal speeds (Lister et al. 2016; see alsoFuhrmann et al.
2016).
Thus, flat-spectrum RLNLS1 sources are thought to be similar to blazars, but residing (mostly) in spiral host galax- ies with central black holes of lower masses (Crenshaw et al.
2003). A statistical study by Berton et al. (2015) showed that the black hole mass distribution is the same for steep- spectrum and flat-spectrum RLNLS1 sources. The suggested scenario ofBerton et al.(2015) is that at larger inclination angle, instead of flat-spectrum RLNLS1 sources, one starts to see steep-spectrum RLNLS1 sources. At even larger in- clination angles, the Doppler effect broadens the line in the disk-like shaped broad-line regions (e.g., Shen & Ho 2014) and a broad-line radio galaxy hosted by a disk galaxy can be observed. Finally, when looking through the obscuring torus, the objects are described as narrow-line radio galax- ies hosted by disk galaxies.
The multi-wavelength study of J¨arvel¨a et al. (2015) showed that the jet is the main source of the radio, optical and X-ray emission in RLNLS1 sources, while in radio-quiet NLS1 sources the infrared and radio emission mostly orig- inate from star formation. The origin of infrared emission in RLNLS1 sources however is unclear, it is possible that star-formation and reradiated emission from the torus also contribute (Caccianiga et al. 2015;J¨arvel¨a et al. 2015).
SDSS J110006.07+442144.3 (hereafter, J1100+4421) is a newly-discovered NLS1 candidate source. It was found in the Kiso Supernova Survey (Morokuma et al. 2014) by Tanaka et al.(2014) thanks to its dramatic optical flare on 2014 February 23.
Follow-up observations ofTanaka et al.(2014) revealed that the FWHMs of the broad components of Mgiiand Hβ lines in J1100+4421 are smaller than 2000 km s−1. The red- shift of the source was measured to bez= 0.84. It was clas- sified as an NLS1 candidate.Tanaka et al.(2014) calculated the black hole mass,∼1.5×10⁷ M, using the Mgii line, and∼1.0×10⁷Musing the Hβline. They also calculated the bolometric luminosity (6×1044erg s−1), which is 30 per cent of the Eddington luminosity. These values are consis- tent with the findings ofFoschini et al.(2015), who analyzed the multi-wavelength properties of 42 RLNLS1s, and found Eddington ratios of 1 per cent to 49 per cent, and black hole masses in the range of 106−108 M. However J1100+4421 did not show a Feii bump, and the flux ratio of the [Oiii] line to the Hβis much larger (∼5−9) than the value used to
define NLS1 sources. According toTanaka et al.(2014), the former can be attributed to the flaring state of the source, which can cause the emergence of strong continuum emis- sion. With respect to the latter, the luminosity of the [Oiii] line was shown to correlate with the radio power (Labiano 2008). Thus, Tanaka et al.(2014) argue that the especially luminous line in J1100+4421 may be related to strong jet emission in the source. The presence of jet is also indicated by the extreme radio-loudness of J1100+4421. The ratio of the 1.4 GHz flux density measured in the Faint Images of the Radio Sky at Twenty-Centimeters (FIRST) survey (Becker et al. 1995) to the quiescent flux density measured at 4400˚A is∼3000. When the optical flux density is measured at the highest point of the flaring state, this ratio is still ∼ 400 (Tanaka et al. 2014).
To image the radio structure of the source at mil- liarcsecond (mas) resolution and ascertain whether it has a blazar-like jet emission, we observed J1100+4421 with very long baseline interferometry (VLBI) using the Euro- pean VLBI Network (EVN) at 1.7 and 5 GHz. We also searched for a possibleγ-ray counterpart to J1100+4421 in the latestFermi/Large Arae Telescope (LAT) data. In the following, we assume a flat ΛCDM cosmological model with H0 = 70 km s−1Mpc−1, Ωm = 0.27, and ΩΛ = 0.73. At the redshift of the source (z= 0.84), 100angular size corresponds to 7.754 kpc projected linear size (Wright 2006).
2 OBSERVATIONS AND DATA REDUCTION 2.1 EVN Data
The EVN observations of J1100+4421 took place on 2015 February 10 at 1.7 GHz and on 2015 March 24 at 5 GHz.
At 1.7 GHz, the interferometric array consisted of seven antennas: Effelsberg (Germany), the Jodrell Bank Mark 2 telescope (the United Kingdom), Medicina (Italy), Onsala (Sweden), Toru´n (Poland), the Westerbork Synthesis Radio Telescope (WSRT, the Netherlands), and Sheshan (China).
At 5 GHz, Noto (Italy) and Yebes (Spain) were also added to the array. However, Medicina did not observe and the WSRT produced no useful data at the higher frequency.
The observations were carried out in e-VLBI mode (Szomoru 2008). The signals received at the radio telescopes were transmitted over optical fiber networks directly to the central data processor for real-time correlation. The correla- tion with 2 s integration time was done at the EVN software correlator (SFXC,Keimpema et al. 2015), in the Joint In- stitute for VLBI ERIC (JIVE), Dwingeloo, the Netherlands.
Eight intermediate frequency channels (IFs) were used in both polarizations at both bands. Each IF had a width of 16 MHz and was divided into 32 spectral channels. The total bandwidth was 256 MHz. The observations were performed in phase-reference mode (Beasley & Conway 1995). The tar- get and the phase calibrator were observed alternately, with
∼ 3.5 min spent on the target and ∼ 1 min spent on the calibrator. The phase-reference calibrator used at both fre- quencies was J1108+4330, separated by ∼ 1.7◦ from the target in the sky. Its coordinates are right ascensionαcal= 11h08m23.s47694 and declinationδcal= +43◦30053.006571, the
uncertainties are 0.2 mas in both directions.1 Additionally, 4C39.25 was included as fringe-finder at both bands. The observations lasted for 4.5 h and 4.25 h, and on-source inte- gration times were 164 min and 119 min, at 1.7 and 5 GHz, respectively.
The data were reduced in the standard manner (Dia- mond 1995) using the U.S. National Radio Astronomy Ob- servatory (NRAO) Astronomical Image Processing System (aips, Greisen 2003). First, interferometric visibility am- plitudes were calibrated using the gain curves and system temperature measurements obtained at the telescope sites.
Then fringe-fitting was performed on the phase-calibrator and fringe-finder sources. Their visibility data were exported to be imaged with the difmap program package (Shep- herd et al. 1994). The hybrid mapping procedure was used with several cycles ofcleaning (H¨ogbom 1979) and phase self-calibration. Gain correction factors were determined in difmapand subsequently were used inaipsto scale the am- plitudes. The average corrections factors did not exceed 10 per cent. Four-four channels, the most affected by the band- pass response function, were discarded at the beginning and end of each IF. Then fringe-fitting on the calibrator was repeated in aips, now taking into account its brightness distribution using its cleancomponent model obtained in difmap. The derived solutions were interpolated and ap- plied to the target source, J1100+4421. The hybrid map- ping of the target was also performed indifmap. No ampli- tude self-calibration was attempted on the source, and phase self-calibration was not done for Sheshan for time intervals shorter than 60 min at 1.7 GHz and 15 min at 5 GHz.
Since J1100+4421 was sufficiently bright and compact, we also performed fringe-fitting directly on the target source at both frequencies. Then we imaged the source in the same way as described above. The images obtained (Fig. 1 and Fig.2) were in good agreement with those obtained by trans- ferring the phase solutions of the calibrator. Comparing the peak brightness values in the two images in both bands, the coherence loss in phase-referencing was 1 per cent at 1.7 GHz and 14 per cent at 5 GHz.
2.2 Archival VLA data
J1100+4421 was also observed during a 40-s snapshot at 8.4 GHz with the Very Large Array (VLA) in its most ex- tended A configuration on 1995 August 15 (project code:
AM484) within the Cosmic Lens All-Sky Survey (Myers et al. 2003). The data were downloaded from the NRAO archive2 and analyzed following standard data reduction steps in aips. The absolute flux density calibrator used in the project was 3C286. The calibrated visibility data were exported from aips, imaging was done in difmap. The re- sulting map is shown in Fig. 3. The weights of the data points are set inversely proportional to the amplitude errors (natural weighting).
1 Data are obtained from http://astrogeo.orgmaintained by L. Petrov, rfc2015b solutions
2 http://archive.nrao.edu
2.3 Fermi Large Area Telescope data
J1100+4421 has no associated counterpart in the newest and so far most comprehensiveγ-ray catalogue theFermi/LAT 4-Year Point Source Catalogue (3FGL, Acero et al. 2015).
The closest 3FGL source is 3FGL J1105.7+4427 with a sep- aration of more than 600.
We analysed data from LAT using the Fermi/LAT Science Tools v10r0p53 software package. The LAT data were extracted in a circle with 15◦ radius around the co- ordinates of J1100+4421, over the whole energy range, choosing only LAT data type ‘photon’. We used the un- binned likelihood analysis and followed the provided tu- torial4 in the data reduction. The parameters used for different tasks were the ones suggested in the tutorial.
First, only events of class ‘source’ in the energy band of 100 MeV – 100 GeV were chosen using gtselect, and a zenith angle cut of 90◦ was implemented to remove the disturbance caused by the Earth’s limb. Next gtmktime was used to select only the good time intervals for fur- ther analysis. Exposure map was generated usinggtltcube and gtexpmap. The newest galactic diffuse emission model (gll iem v06.fits) and the extragalactic isotropic diffuse emission model (iso P8R2 SOURCE V6 v06.txt), which in- cludes the residual cosmic-ray background, were used for computing the diffuse source responses withgtdiffrps. Fi- nally, J1100+4421 and all the sources within 10◦radius (29 sources) were modeled withgtlikeusingpowerlaw2model and the unbinned likelihood algorithm with optimizerMI- NUIT.
We first integrated over the whole time period from 2008 August 5 00:00:00 UTC to 2016 December 19 00:00:00 UTC (3058 days) for which we have data. There are some very faint sources nearby, having test statistic (TS) values less than 0, causing the fit not to converge. We kept remov- ing the sources with TS<0, except J1100+0044, and run- ning the reduction again, until the TS values of all nearby sources were positive. Over the whole period the TS value for J1100+0044 was negative, meaning that the fit without the source is better than with it, implying that it is very im- probable that this source has emitted detectableγ-rays dur- ing this period. To verify this result we integrated over the same time period in bins of 180 days, resulting in 17 bins, using the same parameters and procedure. The TS value for J1100+4421 was negative in every bin, further indicat- ing that J1100+4421 has not been active atγ-rays between 2008 August and 2016 December. The upper limit of the γ-ray flux is 9.9×10⁻¹⁰photon cm−2s−1 in the 100 MeV–
300 GeV energy band.
3 RESULTS
3.1 The pc-scale radio structure
A single, compact radio-emitting feature was detected at 5 GHz in our EVN observations (Fig. 2). At 1.7 GHz, an additional feature is detected north from the central source
3 http://fermi.gsfc.nasa.gov/ssc/data/analysis/software/
4 http://fermi.gsfc.nasa.gov/ssc/data/analysis/scitools/
likelihood$_$tutorial.html
C
N
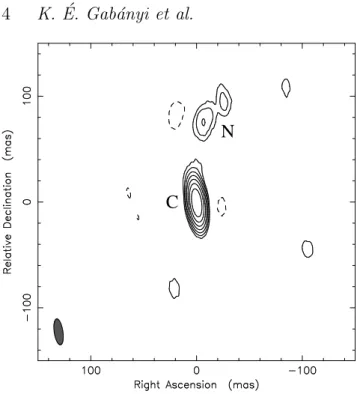
Figure 1. Naturally-weighted 1.7-GHz EVN image of J1100+4421. Observation took place on 2015 February 10.
The peak brightness is 19.4 mJy beam−1, the restoring beam is 24.8 mas×8.2 mas (FWHM) at a position angle of 9◦and shown in the lower left corner of the image. The lowest contours are at
±3.5σ noise level (±0.1 mJy beam−1), further positive contour levels increase by a factor of two. The dashed line represents negative contour. The labels denote the Gaussian components fitted to the visibility data.
(Fig. 1). The phase-referencing observations allowed us to obtain the accurate coordinates of J1100+4421. We used the maxfit verb inaips to determine the right ascension and declination of the brightness peak at the 5-GHz EVN image:
αt= 11h00m06.s0571,δt = +44◦21044.00383. The coordinates are the same within the uncertainties at the two observing frequencies. We estimate that the obtained coordinates are accurate within 1 mas.
We used difmap to fit the visibilities with brightness distribution models. At 1.7 GHz, two circular Gaussian com- ponents are needed (labelled C and N), while at 5 GHz, a single circular Gaussian component (C) adequately mod- elled the visibilities. The parameters of the fitted compo- nents (projected separations from the core, flux densities and FWHM sizes) are summarized in Table1.
Using the size and flux density values derived from the higher frequency measurement, one can calculate the bright- ness temperature as
TB= 1.22×10¹²(1 +z) S
θ2ν2K (1)
where z is the redshift of the source,S is the flux density given in Jy,θis the FWHM size in mas, andνis the observ- ing frequency in GHz. The obtained brightness temperature is (1.56±0.4)×1010K. However, if the FWHM size derived from the modelfit is smaller than the smallest resolvable size of the array, the component is unresolved, and the bright- ness temperature value is only a lower limit. According to Kovalev et al.(2005), the minimum resolvable FWHM size of a Gaussian component in our observation at 5 GHz would
C
Figure 2.Naturally-weighted 5-GHz EVN image of J1100+4421.
Observation took place on 2015 March 24. The peak bright- ness is 23.2 mJy beam−1, the restoring beam is 3.8 mas×1.2 mas (FWHM) at a position angle of 16◦and shown in the lower left corner of the image. The lowest contours are at±3.5σnoise level (±0.2 mJy beam−1), further positive contour levels increase by a factor of two. The dashed line represents negative contour. The label denotes the Gaussian component fitted to the visibility data.
be 0.18 mas along the major axis of the restoring beam, in- dicating that the feature is not unresolved. However, the more recent work of Natarajan et al. (2017) showed that calibration uncertainties have significant effect on the min- imum resolvable size. Investigating synthetic observations made with an array very similar to our EVN observation, they concluded that the minimum resolvable size can be a factor of two larger,∼0.4 mas. Therefore, the fitted FWHM size of the component is an upper limit, and the derived brightness temperature of J1100+4421 can be regarded as a lower limit only.
The recovered flux density of the core component was somewhat larger at 5 GHz than at 1.7 GHz. Formally the compact source has a spectral index of α = 0.20±0.03 (S∼να). However, we note that the EVN observations were not simultaneous but separated by 6 weeks. Compact radio- emitting AGN are known to show variations in the radio on timescales of weeks to months.5 Therefore, flux density variability may affect the spectral index estimate. We did not see at 5 GHz any counterpart of the northern feature detected at 1.7 GHz (Fig.1). The largest recovarable size of an interferometer array can be estimated as∼λ/(2Bmin), whereλis the observing wavelength andBmin is the short-
5 Notably, near-infrared and optical monitoring of J1100+4421 byMorokuma et al.(2017) showed that J1100+4421 underwent a major flare a few days prior to our 5 GHz EVN observation.
Table 1.Details of the EVN observations of J1100+4421 (right ascensionαt = 11h00m06.s0571, declinationδt = +44◦21044.00383). In Cols. 2, 3, 4, 5, and 6, the parameters of the fitted circular Gaussian components are listed. In Cols. 7, 8, 9 and 10, the peak intensity, the size and position angle of the restoring beam and the rms noise levels of the radio images shown in Figs.1and2are given.
ν ID Relative position Flux density FWHM peak beam size PA rms
(GHz) RA (mas) Dec. (mas) (mJy) (mas) mJy beam−1 (mas×mas) (◦) (mJy beam−1)
1.7 C – – 20.9±0.1 2.5±0.2 19.4 24.8×8.2 9 0.029
1.7 N −12.5±2.0 79±2.0 1.5±0.3 16.0±4.0 – – – –
5 C – – 25.0±0.4 0.38±0.05 23.2 3.8×1.2 16 0.057
Declination (J2000)
Right Ascension (J2000)
11 00 06.20 06.15 06.10 06.05 06.00 05.95 05.90 44 21 46.0
45.5
45.0
44.5
44.0
43.5
43.0
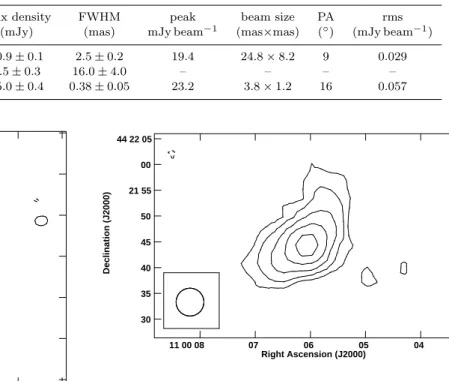
Figure 3. 8.4-GHz VLA image of J1100+4421. The observa- tion was performed on 1995 August 15. The peak brightness is 18.4 mJy beam−1. The FWHM size of the restoring beam is 0.0027×0.0025 at a position angle of −81◦, as shown in the bottom left corner of the image. The lowest contours are at
±0.5 mJy beam−1corresponding to 3σimage noise level, further positive contour levels increase by a factor of two.
est baseline in the array (Wrobel 1995). In our 5 GHz EVN observation, the shortest baseline isBmin≈637 km (the dis- tance between Onsala and Toru´n), thus the largest recover- able size is 9.7 mas. Therefore, a radio feature as large as the northern component in the 1.7-GHz image, 16 mas, can- not be detected by our array used at 5 GHz. If it is smaller than the largest recoverable size (9.7 mas) at 5 GHz, then its non-detection implies that its flux density is.2.1 mJy con- sidering the 3.5σimage noise level (0.2 mJy beam−1). Either way, we cannot meaningfully constrain the spectral index of this component. However, its characteristics measured at 1.7 GHz are indicative of a more extended jet-related emis- sion. The non-detection at 5 GHz also shows that there is no compact bright radio emitting region within this structure.
3.2 The kpc-scale radio structure
In the archival 8.4-GHz VLA map of J1100+4421 (Fig.3) a single radio source can be seen. Model-fitting to the visibility data was performed indifmap. A model containing a single circular Gaussian component adequately describes the data.
Its flux density and FWHM size are 19.4±0.7 mJy and 54.6±
0.7 mas, respectively.
Declination (J2000)
Right Ascension (J2000)
11 00 08 07 06 05 04
44 22 05 00 21 55 50 45 40 35 30
Figure 4.1.4-GHz VLA map of J1100+4421 from the FIRST survey (Becker et al. 1995). The observation was performed on 1997 Februray 25. The peak brightness is 8.3 mJy beam−1, the restoring beam is circular with FWHM size of 5.004, and shown in the lower lef corner of the image. The lowest contour levels are at
±0.4 mJy beam−1 at 3σ image noise level, further positive con- tour levels increase by a factor of two. The dashed line represents negative contour.
According to the FIRST (Becker et al. 1995) survey, J1100+4421 shows an extended radio structure at 1.4 GHz (Fig.4). In the most recent FIRST catalog (Helfand et al.
2015), the source is described with an elliptical Gaussian component with a FWHM size of (7.001±0.003)×(3.000±0.003), at a position angle of 131◦±2◦and integral flux density of 15.76±0.4 mJy. (The errors of the flux density and the po- sition angle are not given in the catalog, therefore we deter- mined it from the FIRST image directly.) The peak bright- ness in the 1.4-GHz FIRST image is 8.3±0.1 mJy beam−1. The mean epoch of the observation is 1997.158 with an rms of 1.59 d. The flux density of the radio features de- tected with our EVN observation (22.4 mJy) at a close fre- quency (1.7 GHz) originates from the central region not re- solved by FIRST, while the EVN is not sensitive to arcsec- scale emission recovered in FIRST. Thus the radio core of J1100+4421 must have brightened significantly during the
∼18 yr elapsed between the FIRST and EVN observations.
At larger scales, J1100+4421 is unresolved in the 1.4- GHz NRAO VLA Sky Survey (NVSS,Condon et al. 1998), with a flux density of 20.8±0.8 mJy. This is higher than the flux density measured in the FIRST survey. The differ- ence can be because of possible additional large-scale struc- ture that was resolved out in the FIRST map but was im- aged at the lower resolution of the NVSS, or this can be
also due to flux density variability of the compact core of J1100+4421. The NVSS observations took place two years before the FIRST observation. The mean epoch of the NVSS observations is 1995.25, with an rms of 27.9 d.
4 DISCUSSION
4.1 The characteristics of the VLBI jet
The derived brightness temperature value is close to but does not exceed the commonly-used equipartition bright- ness temperature limit of∼5×10¹⁰K byReadhead(1994).
It is still lower than the intrinsic brightness temperature of TB,int= 3×10¹⁰K derived byHoman et al.(2006) for a sam- ple of radio-loud AGN during their quiescent (not flaring) state, and thus the Doppler factor would beδ=TB/TB,int<
1. However, since the derived brightness temperature is just a lower limit, Doppler boosting in J1100+4421 cannot be excluded. If the source is indeed unresolved in our 5GHz EVN observation and the FWHM size of the emitting re- gion is much smaller than the modelfit result, < 0.2 mas, the brightness temperature would exceed the equipartition limit.
In general the low brightness temperature value is not uncommon in RLNLS1 sources. Gu et al. (2015) ob- served fourteen RLNLS1 sources with very high radio- loudness value (R > 100) using the Very Long Baseline Array (VLBA) between 3.9 and 7.9 GHz. They found that the brightness temperature values of the core components are within 108.4K and 1011.4K, with a median value of 1010.1K, which agrees well with the brightness temperature we derived for J1100+4421. Gu et al. (2015) explain the low brightness temperature values with intrinsically low jet power. Based upon the moderate radio variability seen in a sample of RLNLS1 sources, Angelakis et al. (2015) also propose that the jets of RLNLS1 are mildly relativistic, and similar conclusion was drawn by Richards & Lister(2015) who investigated three RLNLS1 with large scale radio struc- tures. It was hypothised that the lower bulk jet speed can be related to the lower black hole mass compared to the more energetic blazars (Foschini et al. 2015).
If we assume a Lorentz factor e.g., γ ∼ 9 which was derived by Karamanavis (2015) for the RLNLS1 source 1H 0323+342 with a similar black hole mass (Zhou et al.
2007) as that of J1100+4421, and supposing that the bright- ness temperature is close to the derived lower limit, we ob- tain a viewing angle of∼26◦. This should be considered as an upper limit on the actual viewing angle. The compact mas-scale radio morphology does indicate that the viewing angle of the jet cannot be too large, since above a few tens of degrees, one would expect to see a morphology reminis- cent of a more resolved source rather than a single compact feature.
Tanaka et al. (2014) pointed out that the observed optical variability is similar to that of the γ-ray detected RLNLS1 sources. They compared the spectral energy dis- tribution of J1100+4421 to the γ-ray-loud RLNLS1s of PMN J0948+0022, and PKS 2004−447 (Abdo et al. 2009a,b) and hypothesized that assuming the same photon index as that of PMN J0948+0022, the upper limit of its γ-ray lu- minosity would be comparable to the measured γ-ray lu- minosity of PMN J0948+0022. However, our analysis of all
100 1000 10000
Frequency (MHz) 10
100
Flux density (mJy)
TGSS
WENSS
NVSS FIRST
AM484 GB6
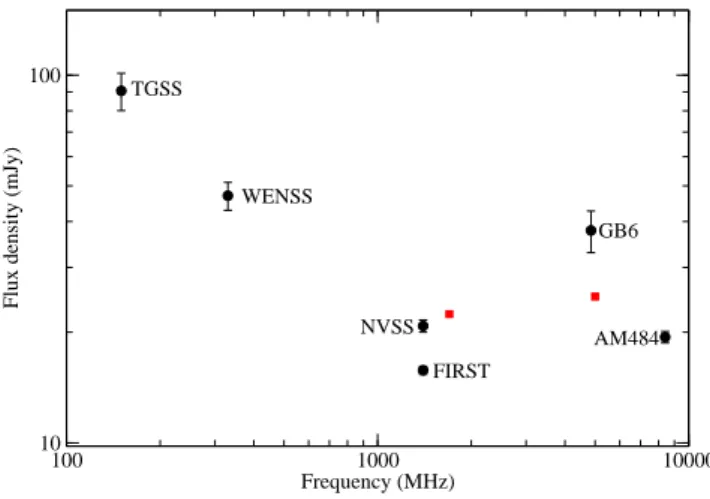
Figure 5. Non-contemporaneous radio flux density measure- ments of J1100+4421. Black circles show data from various sur- veys, the Giant Meterwave Radio Telescope 150 MHz all-sky radio survey (TGSS,Intema et al. 2017), the Westerbork Northern Sky Survey (WENSS,Rengelink et al. 1997), the NVSS, the FIRST, the Green Bank 4.85 GHz survey (GB6, Gregory et al. 1996), and the flux density from the archival 8.4-GHz VLA observation (project code: AM484). Red squares show the sum of the flux density of the fitted components of our EVN data.
availableFermi/LAT data resulted in no detection ofγ-rays at the position of J1100+4421.
Morokuma et al.(2017) conducted extensive monitor- ing of J1100+4421 in the optical and near-infrared bands.
They showed that based upon the spectral shape, the opti- cal and near-infrared emission of the source is dominated by emission from the jet. From the fastest observed variations, and assuming a Doppler factor of 10, they estimate that the region responsible for the variability must be smaller than 5.4×1015cm.
4.2 The large-scale radio structure
In Fig. 5, the radio flux density measurements of J1100+4421 are summarized. The data are not simultane- ous, and the observations are conducted with different an- gular resolutions, therefore source variability as well as res- olution issues may complicate the picture. Nevertheless, up until 1.4 GHz, the spectrum seems to follow a steep power- law, which might flatten afterwards. The red symbols repre- sent the total flux density recovered in our high resolution EVN observations. The 1.7-GHz datapoint clearly shows the source variability (as discussed in Sect.3.2), while the dis- crepancy between the two 5-GHz data points can also be caused by the different resolutions of the observations (the EVN observation recovered only the pc-scale core emission, while in the Green Bank 4.85-GHz radio survey (Gregory et al. 1996) the kpc-scale scale structure could have been measured as well), as well as source variability.
The kpc-scale radio emission around J1100+4421 can only be seen in the FIRST image. In the 8-GHz VLA image, there was no additional radio emission above 0.8 mJy beam−1, 4.5σ image noise level in a 3000×3000 re- gion around the source. This may indicate that the extended emission has a steep spectrum between 1.4 GHz and 8.4 GHz.
The circular Gaussian component describing the northern feature detected at 1.7 GHz in our EVN observation is at
∼ 80 mas, corresponding to ∼ 620 pc projected distance form the core. This feature may be the jet connecting to the northern lobe seen in the FIRST image. There is no sign of any other radio emission down to a noise level of 0.13 mJy beam−1 (4σ) at a region of 800×800 around the center in the EVN image. If the two lobes contained com- pact features, the sensitivity of our EVN observation would have been adequate to detect them. Therefore, they are not compact, their sizes have to be larger than the largest re- coverable size of the interferometer (Wrobel 1995), which is
∼ 70 mas in the 1.7-GHz EVN observation, corresponding to∼540 pc at the redshift of J1100+4421.
The morphology of the large-scale structure of J1100+4421 can be classified as two-sided.Doi et al.(2012) calculated the core dominance parameter for six RLNLS1 with kpc-scale radio structures as the flux density ratio between the core and lobes measured in the FIRST im- ages. To disentangle the emission from the lobe and core region, we fitted the central region of the FIRST image of J1100+4421 with a circular Gaussian component. To keep this feature compact, we used a fixed size of 5.004×5.004, the clean beam size of the image. The resulting flux density of this unresolved component is 11.0±0.2 mJy. Then we used the aips verb imstat to measure the flux density of the lobes in the residual image. They each have flux densities of∼3 mJy. Thus, the core dominance parameter is 1.8 for J1100+4421, the smallest among the core-dominated sources inDoi et al.(2012). FollowingDoi et al.(2012), we can esti- mate the jet kinetic energy in the large-scale radio structure of J1100+4421. The 1.4-GHz radio power of a∼3 mJy flux density lobe in J1100+4421 assuming a spectral index of
−0.7 is∼ 9×1024W Hz−1. According to the scaling rela- tion ofCavagnolo et al.(2010) the jet kinetic power is thus 3×1037W. This value is slightly higher than the minimum value,∼1037W estimated to be necessary to create super- sonic lobes according to Doi et al. (2012). Thus the radio power in the extended structure of J1100+4421 is intermedi- ate between the radio powers in FRI and FRII radio galaxies (Fanaroff & Riley 1974).
Currently, there are a handful RLNLS1 sources reported to have extended, kpc-scale radio structure (Whalen et al.
2006;Ant´on et al. 2008;Gliozzi et al. 2010;Doi et al. 2012;
Richards & Lister 2015;Congiu et al. 2017), the projected size ranging between∼23 kpc and∼100 kpc. Additionally, recentlyYao et al.(2015) reclassified a flat-spectrum quasar, SDSS J122222.55+041315.7 as an NLS1 source. According to its FIRST image and the VLA measurement at 1.4 GHz reported byKharb et al.(2010), this RLNLS1 also exhibits a significant extended radio emission, with a projected linear size of∼160 kpc. Thus the extended radio emission seen in J1100+4421 (Fig.4), with a projected size of ∼150 kpc at 1.4 GHz, is among the largest of the known RLNLS1 sources.
Assuming similar kpc-scale velocities as the ones for the six RLNLS1 sources investigated by Doi et al. (2012), it would require∼106yr to build the radio morphology seen in the FIRST image. However this is a lower limit only, since the viewing angle of the structure is not known, therefore its deprojected size might be larger. On the other hand, the similar flux density values seen in both lobes may indicate that the structure is oriented close to the plane of the sky.
Morokuma et al. (2017) report on the detection of a faint galaxy at a distance of 2.007 to the east from J1100+4421. We did not detect any radio counterpart at the position of this galaxy down to 0.5 mJy beam−1 and 0.1 mJy beam−1, 3σ level from the VLA 8-GHz data and our EVN 1.7-GHz data, respectively. However it seems un- likely, it cannot be completely ruled out that the large-scale radio structure detected in the FIRST observation is partly related to this galaxy.
5 SUMMARY
The source J1100+4421 was discovered during a dramatic optical flare by Tanaka et al. (2014). Based upon the follow-up optical observations, which showed unusually nar- row broad lines, the source was classified as a candidate NLS1 source. However, the two other defining charater- istics of NLS1 sources (presence of Feii bump and low flux of [Oiii]λ5007 compared to Hβ line) do not apply to J1100+4421. Nevertheless, the derived low black hole mass and relatively high Eddington rate are in agreement with the proposed possible NLS1 nature of the source (Cracco et al.
2016).Tanaka et al.(2014) suggested that the optical flare is most probably caused by the jet emission, and the op- tical and near-infrared monitoring campaign ofMorokuma et al.(2017) showed that both the optical and near-infrared emissions are dominated by synchrotron radiation from the jet.
Our high-resolution EVN observations showed that the source indeed has a mas-scale compact radio struc- ture, similar to other very radio-loud NLS1 sources. The derived lower limit on the brightness temperature is 1.56×10¹⁰K, which is below but still consistent with the equipartition limit, therefore we cannot exclude the pres- ence of Doppler boosting in the source. At lower resolution, J1100+4412 shows an extended, two-sided radio morphol- ogy of∼150 kpc, which is among the largest of the known RLNLS1 sources. Somewhat contrary to the results of the VLBI observations, the large-scale radio emission indicates that the radio structure is oriented close to the plane of the sky. So far the source has not been detected in the Fermi/LATγ-ray mission.
To reveal the connection and possible jet bending be- tween the inner, compact radio-emitting feature and the large-scale lobes, high-sensivity, intermediate-resolution ra- dio interferometric observations are desirable. Comparing the flux densities measured in different radio observations, it is clear that J1100+4421 shows significant variability at cm wavelengths at least on time scales of years. If the source show radio variability on shorter time scales, frequent radio flux density monitoring could provide independent estimate of the Doppler factor.
ACKNOWLEDGEMENTS
We thank the referee for careful reading of the manuscript and for his/her comments, which helped to improve the paper. K. ´E. G. was supported by the J´anos Bolyai Re- search Scholarship of the Hungarian Academy of Sciences.
We wish to thank Venkatessh Ramakrishnan for the help
with the Fermi data reduction. The European VLBI Net- work is a joint facility of independent European, African, Asian, and North American radio astronomy institutes. Sci- entific results from data presented in this publication are derived from the following EVN project code: EG087. The e-VLBI research infrastructure in Europe was supported by the European Community’s Seventh Framework Programme (FP7/2007-2013) under grant agreement RI-261525 NEX- PReS. The research leading to these results has received funding from the European Commission Seventh Frame- work Programme (FP/2007-2013) under grant agreement no. 283393 (RadioNet3). This research was supported by the Hungarian National Research Development and Innovation Office (OTKA NN110333) and the China–Hungary Collab- oration and Exchange Programme by the International Co- operation Bureau of the Chinese Academy of Sciences. T. A.
acknowledges the grant of the Youth Innovation Promotion Association of CAS.
REFERENCES
Abdo A. A., et al., 2009a,ApJ,699, 976 Abdo A. A., et al., 2009b,ApJ,707, L142 Acero F., et al., 2015,ApJS,218, 23 Angelakis E., et al., 2015,A&A,575, A55
Ant´on S., Browne I. W. A., March˜a M. J., 2008,A&A,490, 583 Beasley A. J., Conway J. E., 1995, in Zensus J. A., Diamond P. J.,
Napier P. J., eds, ASP Conf. Ser. Vol. 82, Very Long Baseline Interferometry and the VLBA. p. 327
Becker R. H., White R. L., Helfand D. J., 1995,ApJ,450, 559 Berton M., et al., 2015,A&A,578, A28
Caccianiga A., et al., 2015,MNRAS,451, 1795
Cavagnolo K. W., McNamara B. R., Nulsen P. E. J., Carilli C. L., Jones C., Bˆırzan L., 2010,ApJ,720, 1066
Collin S., Kawaguchi T., 2004,A&A,426, 797
Condon J. J., Cotton W. D., Greisen E. W., Yin Q. F., Perley R. A., Taylor G. B., Broderick J. J., 1998,AJ,115, 1693 Congiu E., et al., 2017,A&A,603, A32
Cracco V., Ciroi S., Berton M., Di Mille F., Foschini L., La Mura G., Rafanelli P., 2016,MNRAS,462, 1256
Crenshaw D. M., Kraemer S. B., Gabel J. R., 2003,AJ,126, 1690 Diamond P. J., 1995, in Zensus J. A., Diamond P. J., Napier P. J., eds, ASP Conf. Ser. Vol. 82, Very Long Baseline Interferom- etry and the VLBA. Astron. Soc. Pac., San Francisco, p. 227 Doi A., Nagira H., Kawakatu N., Kino M., Nagai H., Asada K.,
2012,ApJ,760, 41
Fanaroff B. L., Riley J. M., 1974,MNRAS,167, 31P
Foschini L., 2011, in Foschini L., Colpi M., Gallo L., Grupe D., Komossa S., Leighly K., Mathur S., eds, Narrow-Line Seyfert 1 Galaxies and their Place in the Universe. Proceedings of Science (PoS, Trieste, Italy), p. 24
Foschini L., et al., 2015,A&A,575, A13
Fuhrmann L., et al., 2016, Research in Astronomy and Astro- physics,16, 176
Gliozzi M., Papadakis I. E., Grupe D., Brinkmann W. P., Raeth C., Kedziora-Chudczer L., 2010,ApJ,717, 1243
Gregory P. C., Scott W. K., Douglas K., Condon J. J., 1996, ApJS,103, 427
Greisen E. W., 2003,Information Handling in Astronomy - His- torical Vistas,285, 109
Gu M., Chen Y., Komossa S., Yuan W., Shen Z., Wajima K., Zhou H., Zensus J. A., 2015,ApJS,221, 3
Helfand D. J., White R. L., Becker R. H., 2015,ApJ,801, 26 H¨ogbom J. A., 1979, A&AS,36, 173
Homan D. C., et al., 2006,ApJ,642, L115
Intema H. T., Jagannathan P., Mooley K. P., Frail D. A., 2017, A&A,598, A78
J¨arvel¨a E., L¨ahteenm¨aki A., Le´on-Tavares J., 2015, A&A,573, A76
Karamanavis V., 2015, PhD thesis, Max-Planck-Institut f¨ur Ra- dioastronomie,doi:10.5281/zenodo.48650
Keimpema A., et al., 2015,Experimental Astronomy,39, 259 Kellermann K. I., Sramek R., Schmidt M., Shaffer D. B., Green
R., 1989,AJ,98, 1195
Kharb P., Lister M. L., Cooper N. J., 2010,ApJ,710, 764 Komossa S., Voges W., Xu D., Mathur S., Adorf H.-M., Lemson
G., Duschl W. J., Grupe D., 2006,AJ,132, 531 Kovalev Y. Y., et al., 2005,AJ,130, 2473
Labiano A., 2008,A&A,488, L59 Lister M. L., et al., 2009,AJ,138, 1874 Lister M. L., et al., 2016,AJ,152, 12 Mathur S., 2000,MNRAS,314, L17 Morokuma T., et al., 2014,PASJ,66, 114
Morokuma T., et al., 2017, preprint, (arXiv:1707.05416) Myers S. T., et al., 2003,MNRAS,341, 1
Natarajan I., Paragi Z., Zwart J., Perkins S., Smirnov O., van der Heyden K., 2017,MNRAS,464, 4306
Osterbrock D. E., Pogge R. W., 1985,ApJ,297, 166 Pogge R. W., 2000,New Astron. Rev.,44, 381 Readhead A. C. S., 1994,ApJ,426, 51
Rengelink R. B., Tang Y., de Bruyn A. G., Miley G. K., Bremer M. N., Roettgering H. J. A., Bremer M. A. R., 1997,A&AS, 124
Richards J. L., Lister M. L., 2015,ApJ,800, L8 Shen Y., Ho L. C., 2014,Nature,513, 210
Shepherd M. C., Pearson T. J., Taylor G. B., 1994, BAAS,26, 987
Szomoru A., 2008, in Proceedings of the 9th European VLBI Net- work Symposium on The role of VLBI in the Golden Age for Radio Astronomy and EVN Users Meeting. Proceedings of Science (PoS, Trieste, Italy), p. 40
Tanaka M., et al., 2014,ApJ,793, L26
Whalen D. J., Laurent-Muehleisen S. A., Moran E. C., Becker R. H., 2006,AJ,131, 1948
Wright E. L., 2006,PASP,118, 1711
Wrobel J. M., 1995, in Zensus J. A., Diamond P. J., Napier P. J., eds, ASP Conf. Ser. Vol. 82, Very Long Baseline Interferom- etry and the VLBA. p. 411
Yao S., Yuan W., Zhou H., Komossa S., Zhang J., Qiao E., Liu B., 2015,MNRAS,454, L16
Yuan W., Zhou H. Y., Komossa S., Dong X. B., Wang T. G., Lu H. L., Bai J. M., 2008,ApJ,685, 801
Zhou H., Wang T., Yuan W., Lu H., Dong X., Wang J., Lu Y., 2006,ApJS,166, 128
Zhou H., et al., 2007,ApJ,658, L13
This paper has been typeset from a TEX/LATEX file prepared by the author.