Smartphone-based Data Collection with Stunner, the Reality of Peer-to-Peer Connectivity and Web Real-Time Communications Using Crowdsourcing: Lessons
Learnt while Cleaning the Data
Zolt´an Szab´o∗, Vilmos Bilicki∗, ´Arp´ad Berta†, and Zolt´an Rich´ard J´anki∗
∗Department of Software Engineering University of Szeged, Hungary
Email:{szaboz, bilickiv, jankiz}@inf.u-szeged.hu
†MTA-SZTE Research Group on AI University of Szeged, Hungary Email:berta@inf.u-szeged.hu Abstract—The increasing popularity of smartphones makes them
popular tools for various big data collecting crowdsourcing campaigns, but there are still many open questions about the proper methodology of these campaigns. Beyond this, despite the growing popularity of this type of research, there are familiar difficulties and challenges in handling a wide range of uploads, maintaining the quality of the datasets, cleaning the datasets containing noisy, incorrect data, motivating the participants, and providing support for data collection regardless of the remoteness of the device. In order to collect information about the Network Address Translation (NAT)-related environment and the Peer- to-Peer (P2P) networking capabilities of mobile phones, we utilized a crowdsourcing approach. We collected more than 70 million data records from over 100 countries measuring the NAT characteristics of more than 1,300 carriers and over 35,000 WiFi environments during the three-year project. Since then, we have also expanded and released our application to collect even more data concerning the Peer-to-Peer capabilities. Here, we introduce our data collecting and Peer-to-Peer architectures, some of the most prominent problems we have encountered since its launch, some of the solutions and proposed solutions to handle difficulties.
Keywords–smartphones; data cleaning; Peer-to-Peer; crowd- sourcing.
I. INTRODUCTION
In recent years, smartphones have become part of our everyday lives. Their wide range of uses along with multiple sensors, networking and computational capabilities have also made them seemingly ideal platforms for research. One re- search area is data collection, with the collected datasets avail- able for a wide area of analysis, including network mapping, discovering and analysing various networks, and the network coverage of certain areas.
Different research teams from all over the world have dis- covered these new opportunities, and they employ smartphones as crowdsourcing tools in a wide variety of ways. Through crowdsourcing, they assign tasks to different users with dif- ferent device types to collect data in real-life situations, or a monitored environment, providing huge amounts of realistic data. In recent years, we have seen a lot of successful, and interesting approaches to this methodology. In our conference paper, we have shown our approach to data collection and data cleaning [1].
However, there is still a question of how exactly crowd- sourcing campaigns should be implemented. Several research projects, such as SmartLab [2], the behaviour-based malware
detection system Crowdroid [3], and the cross-space public information crowdsensing system FlierMeet [4] recruited a small number of users, who could be trusted, contacted if nec- essary, and provided the data taken from a known environment, specifically chosen, or created for the crowdsourcing project.
This limited the variability and the amount of the data, but the results were of a high quality and easy to validate.
Another approach for recruitment is to upload the smart- phone application to the Google Play store, or the Apple App Store, making it available for download by anyone world-wide, and opening up data collecting opportunities for anyone who agreed to the terms and services of the software package. With proper marketing, the results could include enormous datasets obtained from around the world. The NoiseTube project [5]
for crowdsourcing noise pollution detection was downloaded by over 500 people from over 400 regions world-wide. The Dial¨akt App [6], one of the most well-known crowdsourcing campaigns in recent years, was the most downloaded iPhone app in Switzerland after its launch, with wide media coverage, and over 78,000 downloads from 58,923 users by the time they had published their results. Many more datasets were collected in the Bredbandskollen project, later to be used in various smartphone-based research projects [7], which has collected network data from 3,000 different devices and over 120 million records since its launch in 2007, and the OpenSignal [8]
application, which between 2012 and 2013 collected over 220 million data records from more than 530,000 devices and from over 200 countries.
However, collecting data using smartphones is not without its difficulties, and there are a number of challenges when smartphones are used as the prime source of information.
Among these, battery consumption and network state are among the most important elements, as constantly accessing the state of the phone sensors and listening to specific events takes a heavy toll on the battery, making data collection inadvisable in certain situations (for example, after a device signalled a battery low event), and it is feasible, but pointless in other situations (the phone is on a charger while the user is asleep - the energy is there, but the valuable information is only a fraction of what we would get from an active user). Network state again has to be taken into account, as even today in many environments, we cannot ensure that a device will always have a connection strong enough to send the collected data to the server. Privacy is also an issue, since the data has to remain identifiable yet not contain any trace of personal information.
Aside from all of the above, if data collection was success- ful, we still have the problem of noisy, incorrect, disorganised data. We have to take into consideration the fact that there are different devices, different versions of the same OS, bugs, such as duplicated records uploaded by the client on network error and damaged records resulting from a similar event. We also have to take user interference into account, who may not wish to provide valuable data (e.g., by deliberately leaving the phone at home on a charger or having it switched off during specific hours, etc.). Their results will still be counted as valuable data, but this can severely distort the collected dataset, as well as the results used in evaluations.
An even bigger problem, when crowdsourcing is a global campaign, is that of time synchronisation. Not only do we have to find a good solution for the various time zones of the devices, but also the different time codes of the phone collecting and sending the data and the server storing this data, and recognize the possibility that the user might have manually altered the date and time on the test phone as well.
All of the possibilities mentioned above result in a mixed situation where the power and potential of the smartphones, as research tools cannot be denied, but to acquire correct, useful data is a challenge in itself. This requires careful planning, taking into account almost every possible cause of data distor- tion, well-defined filters and data cleaning algorithms before any actual research can be performed on the data collected.
In this article, we are going to present our solutions with this type of data collection, and our solutions to the problems that emerged.
Our goal was to develop an Android app in order to collect important network information for research on the P2P capabilities of smartphones, including the NAT type, network type and network provider. It does so by taking measurements on a regular basis as well as during specific events. When taking the measurements, the app sends a request to a randomly chosen Session Traversal Utilities for NAT (STUN) Server from a list, displaying useful network information, such as the IP address and NAT type to the user, while also storing the necessary data in an SQLite database, which later gets uploaded to a data collector server for analysis. The application called Stunner has been available for download from the Play Store since December 2013 [9].
Since then we have continued the development, and the current version of the application also contains the implemen- tation of the WebRTC project. Soon, we aim to implement P2P algorithms through P2P connections and collect the specific P2P metrics of the results. In our latest developments we also upgraded the data storage, along with the classic data collector server, both the NAT measurements and the new P2P data are stored on a Parse database server. The new version of Stunner is available in the Play Store since 25th April, 2018.
Using the collected data, we can compare the earlier NAT measurements to the new P2P measurements. Also, in the future, we will be able to define the graph model of a worldwide, P2P smartphone network. In this model, we seek to test various P2P protocols to measure the capabilities of a serverless network architecture, where the phones can slowly update their datasets and generate various statistics, without the data ever leaving this smartphone network. The ultimate goal of our research is the creation of an Application Programming Interface (API), through which developers can utilize these P2P capabilities to create various data collecting and processing applications (for example, general mood or
health statistic researching applications for a specific region) without the need of a processing server.
II. RELATEDWORK
The challenges outlined above have been collected from the research results of other teams (Table I) - and nearly all of them offered good design viewpoints during the development of our own data collecting application.
Perhaps the best overview of the possible difficulties was provided by Earl Oliver [10]. While developing a data col- lecting application for BlueBerry, he defined five of the most common and serious problems, namely volatile file systems on mobile devices (as file systems can be easily mounted and unmounted on nearly any device), the energy constraints, the intervention of third-party applications running in the background, the non-linear time characteristics of the devices, and malicious user activity (file manipulation, simulated ma- nipulation, etc.).
He solved these by exploiting many trends of BlackBerry users: the general maintenance of high battery levels, retrieving manifests of active applications, and data analysis for patterns of manipulation attacks. However, even he could not define a general solution for every problem, and these problems were not the only ones encountered by other research teams. In fact, they found other challenges to be rather common among data collecting applications.
The researchers at Rice University, while developing Live- Lab [11], a methodology used to measure smartphone users with a similar logging technique, encountered the problem of energy constraints, with various optimisations needed to lower the high consumption of the logging application. They also recognized the problem associated with data uploading, namely the connectivity to the server which collects the data from the devices and updates them with new information. They chose rsync for its ability to robustly upload any measurement archive which failed earlier.
A similar method of re-uploading the failed archives was used by a research team at the University of Cambridge in their Device Analyzer project [12], which sought to build a dataset that captured real-world usage of Android smartphones, again with a similar event logging based solution. They found that repeated attempts at uploading caused duplicated data on the server, which could simply be removed by the server before saving it to a database. They also solved the above- mentioned problem of nonlinear time by timestamping every measurement with the device’s uptime in milliseconds, record- ing the wall-clock time of the device when their application started, and later recording every adjustment to it by listening to the notifications caused by these adjustments. From these three elements, a simple server-side processing algorithm was able to reconstruct the exact wall-clock time of any given measurement.
Members of the Italian National Research Council [13]
also confirmed these challenges (i.e., the scarcity of resources, difficulties with network monitoring and privacy) while also highlighting two more problems, caused by the participants using the devices - the much more complex control tasks in these types of research projects, and the issue of user motivation to get them carry out the tasks required to get valid data.
The collected data - even after correction - did not give satisfactory answers to the emerging questions of P2P con- nections with mobile devices. Therefore, we have to examine
TABLE I. COMPARISON OFDATACOLLECTINGPROJECTS
Problem BlackBerry logger Device Analyzer Portolan Livelab
Energy constraints OS callback based logging
Only 2% of the energy consumption
Computational and analyzation processes are run by the server and the collecting is not too energy consuming
The logging events are optimized,
some of the data being collected directly from the system logs
Non-linear time
Dates are logged in a UTC timezone;
datetime modifications recorded
Every measurement stamped with a device uptime in milliseconds;
on startup, the device time is logged, like every modification on device time
Not described (there is a strict communication between client and server, probably kept in sync by this procedure)
Not described, the datetime is most likely to be among the logged data
Offline state, unsuccessful upload -
Batched uploads only when the device is online and the charger is connected
Uploads are handled by proxy servers
Rsync protocol keeps trying until the upload is successful
Multiplicated data -
Every device has a file on the server, multiple copies of data being detected by the server
This is solved by proxy servers
Not described most likely to be filtered by the server
Figure 1. WebRTC Architecture
how the mobile devices behave in a real P2P environment.
In most use cases the peers are computers that execute Web applications in a browser. In these environments the requirements of power and network are not as important as in mobile environments. To establish a P2P connection between two mobile devices we choose the Web Real-Time Communications (WebRTC) technology, which is an open source project that provides browsers and mobile applications with Real-Time Communications (RTC) capabilities via APIs [14]. The WebRTC exploits the concept of differentiating the media plane and the signaling plane. The signaling is managed solely on the application layer. It is so because the different applications prefer diverse signaling protocols [15].
Managing P2P connections via WebRTC, we have to handle NAT traversal and signaling. These are implemented in the Libjingle C++ library, which was integrated into the WebRTC implementation. The Libjingle library is a collection of C++
programming code and sample applications that help develop- ers with building P2P applications. The Libjingle team created its own protocol based on Jingle and Extensible Messaging and Presence Protocol (XMPP). Figure 1 shows the architecture of WebRTC in our Android environment.
In this article, we present our experiences with crowdsourcing-based data collection along with our methods and results of data cleaning on the present dataset.
• We propose a solution for the biggest challenge of the batched data uploads, namely the time synchronisa- tion among the different elements of the architecture, utilising a 3-way logging solution, and lightweight log synchronisation.
• We introduce heuristics to analyse incorrect NAT values, in order to decide which cases failed because of server side problems, and which cases originated from the client side.
• We also introduce a data cleaning algorithm to correct timestamp overlaps, using battery-based smartphone heuristics to detect anomalies among consecutive mea- surements, such as excessively rapid charging, or charging when the smartphone is in a discharging state or when no charger is connected.
• We represent a P2P architecture operating on mobile devices using WebRTC and we share the experiences gathered from establishing the connections.
III. OUR FRAMEWORK
A. Peer-to-Peer Architecture
We also needed to see how these NAT types and network information both affect a real P2P communication model. To achieve this, we have implemented a P2P module using only STUN servers and the Google Firebase Cloud Message (FCM) service. When starting the P2P measurement, the first step is to initialize a few important attributes, such as the list of STUN servers to be used and the various parameters of the commu- nication channel. With the STUN servers, the application can determine the IP address and ports available for the outside world. After these parameters were achieved, the initiating peer has to create an offer for the Signaling Server containing the available address and port. Based on this, the signaling server (the FCM service in our case) saves the device and returns a package with the Session Description Protocol (SDP) and several packages for the Interactive Connectivity Establishment (ICE) mechanism. These packages contain all the information on the peer needed by the future partner devices for commu- nication. The most important attributes include the ice-pwd, which is the device’s password to the server, the ice-ufrag containing the username of the device, and the IP address - port combination contained by the SDP. The ICE packages
also describe the protocol, which is needed to communicate with the port they represent (the two most common being TCP and UDP). For these kinds of P2P measurements, the UDP is much more suitable since the acknowledgement-based approach of the TCP is too slow and not necessary when a small degree of package loss is acceptable in the typical P2P applications (streaming, video chat, etc.). After the offer was saved on the initiating peer, it sends the SDP description and the ICE candidates to the target peer through the signaling server. The Google FCM supports multiple types of messages, from which we chose the data message. The main benefit of this is being a special ”silent push” message type, requiring no activity from the device owner, and being able to even wake the background service if it is in a sleeping state. The receiving peer has to know which peer is initiating the session, what is the type of the message (SDP or ICE) and naturally, the con- tents of the message. The connection-handling is implemented in the class called P2PService. This receives the messages, SDP packages and ICE candidates sent via push notification.
The SDP is immediately saved with a response description created instantly and sent back to the initiating peer. The ICE candidates are handled by a specific algorithm. The received candidates are organized in a list, with the lower port number receiving the higher priority. The algorithm always tries to connect to the port with the highest priority, moving on through the candidates if the most recent attempt failed. The Service sends a STUN protocol message based on the chosen ICE candidate. If a response is received, the target IP address and port for the P2P session is successfully chosen. After this step, the previously initialized parameters of the communication channel are altered. Our datachannel implementation includes built-in functions for sending messages and a default listener for receiving these. The current state of the P2P session is also determined with listeners. The localPeerConnectionObserver in our code is an instance of the PeerConnection.Observer class, which monitors every step of the connection initializing process, the SdpObserver instance in the P2PService listens to updates concerning the SDP packages, and the DataChan- nel.Observer class is responsible for monitoring the state of the communication channel. The device ids are stored in a Firebase Realtime Database, this is the source from which initiating peers can choose their targets for P2P communication. Every time the application is opened, the MainActivity component sends a query to this database for the available peers. Later on, when a P2P connection is needed, a random device id is chosen from the result of this query. The list is also dynamically updated. When an instance of the Stunner application is closed, the destroying process sends a last message to the signaling server, notifying it to remove its id from the database. Similarly to the NAT measurements, the logs of the P2P connections are collected on our Parse database server. The attributes of these logs are described in Table II.
B. Statistics
Our application went live on 20th December, 2013. To promote the usage of the application we also launched a campaign, during which we provided 80 university students and users with smartphones, who agreed to download and provide data with the application for the duration of one year.
On 14th February, 2018 the application had been downloaded and installed by 20,634 users on 1,184 different device types representing 1,300+ carriers and 35,000+ WiFi networks.
Our target API level was originally 19 (Android 4.4), but the application is still being downloaded and installed on more
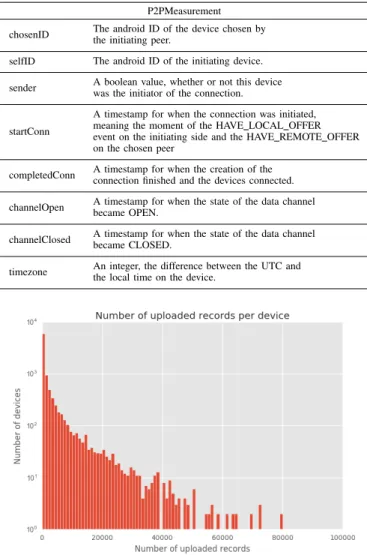
TABLE II. P2PMEASUREMENT
P2PMeasurement chosenID The android ID of the device chosen by
the initiating peer.
selfID The android ID of the initiating device.
sender A boolean value, whether or not this device was the initiator of the connection.
startConn
A timestamp for when the connection was initiated, meaning the moment of the HAVE LOCAL OFFER event on the initiating side and the HAVE REMOTE OFFER on the chosen peer
completedConn A timestamp for when the creation of the connection finished and the devices connected.
channelOpen A timestamp for when the state of the data channel became OPEN.
channelClosed A timestamp for when the state of the data channel became CLOSED.
timezone An integer, the difference between the UTC and the local time on the device.
Figure 2. The plot shows the uploaded data per device
and newer devices, with Android 8.0 being currently the most popular on active installs.
We have also reached a wide variety of different types of devices, upon which the application got installed. The application also successfully reached hundreds of different mobile providers in different countries, which provided us with various, realistic NAT patterns and traces - which will be im- portant later on, after the data cleaning phase is completed, and the analysis and usage of the data collected has commenced.
1) The collected data and the most important descriptive statistics: Based on the size of the dataset collected and our good track record since the 2013 release, it is safe to say that our application and data collecting campaign were both a success (with 70+ million records).
The chart (see Figure 2) shows the number of uploaded records per device. The majority of users did not provide any measurements, but the decline of the slope lessened, indicating that the users who provided data were more likely to stay and keep providing data.
During the summer of 2015 we had to reassign some resources to other projects, resulting in an absence of data in the given time period. However, after restarting the server, our input declined only slightly, resulting in a steady amount
Figure 3. The plot shows the uploaded data per day during the whole measurement period.
PSEUDO CODE :
d a t a [ ’ d u p l i c a t e d ’ ] = = d a t a . d u p l i c a t e d ( s u b s e t = [ a l l c l i e n t s i d e c o l u m n s ] , k e e p = ’ f i r s t ’ )
Figure 4. JSON sample
of data arriving to this day despite a gap of a few months (Figure 3).
An interesting aspect is that although the daily uploads have been pretty steady since the hiatus, the number of active devices providing the uploads has been on a steady decline since early 2016. We hope that with our current developments, this decline can be reversed, and a new record on both the number of active devices and daily uploads can be obtained.
Following the hiatus, the first spike above shows all the collected data uploaded to the server at the same time. While the WiFi-based tests closely follow the trends of active devices and daily uploads, the Mobile Operator-based measurements have been taken at a relatively low, but steady rate. We can monitor more than 200 mobile networks and over 500 WiFi environments day after day. Here we have shown that a significant amount of data has been collected over the three- year period. The real value of the data depends on the quality of the timestamps. Now, we will describe our findings in the area of data cleaning.
IV. ISSUES WITH COLLECTED DATA
A. Data Duplication
In spite of the theoretically sound software environment where the server-side logic was implemented in JEE with transactional integrity taken into account, it turned out that a significant proportion of the dataset had been duplicated. We applied simple heuristics in order to filter out the duplicate measurement records by comparing only the client-side content and skipping the server-side timestamp and other added infor- mation. In practice, we utilized the Python Pandas framework duplicate filtering method shown in Figure 4 to remove the duplicates.
We found that out of the 70+ million rows only 30+ million rows were unique, while the remaining rows were duplicates.
We investigated the possible root cause of this phenomenon.
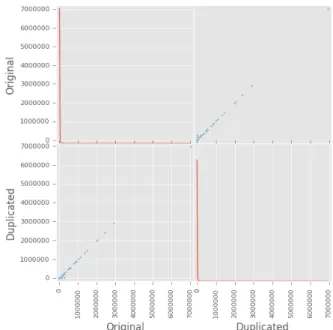
Figure 5 shows the total submitted records per device versus the duplicated records per device. It clearly shows that there is a linear relationship between the two values. This is evidence that this is a system-level symptom and not a temporal one related to server overloading. The same is true if we check the
Figure 5. The plot shows the duplicated data per device vs the total number of records submitted by that device
Figure 6. The plot concerning the duplicated data per day (server side)
temporal dimension of the duplicated records during the given period (Figure 6).
After an in-depth investigation of the client code, we found that the default HttpClient configuration contained a very robust upload model, with a default value of 3 retries for every HyperText Transfer Protocol (HTTP) operation, if it failed with a timeout. This is a very useful method for simple data upload, but in our case, if the timeout chosen in the settings was too short, the client might have uploaded the same batch of records up to four times to the server, which would acknowledge and store all of them. In order to stop further multiple uploads, we will need to carefully look at the correct timeout and retry values and also identify the upload batches, so the server will be able to detect the retries on upload.
1) Detecting the overlap of the client-side timestamps:
The actual unreliability of the client-side timestamps was a surprise for us. Figure 7 shows the difference between the Android timestamp and the date captured on the server side.
A significant number of measurements have big differences between these two dates. The difference between the two
Figure 7. Difference between the Android and Server date
TABLE III. HEURISTICS FORDETECTION
Name Description Detection capability
Fast change detector (ABC and SBC) (the first letter codes the ordering applied:
A - android, S - server side, this coding being consistent among the different detectors)
We used the battery percentage and its sluggish behaviour to detect the fast changes. We defined the speed of change as the ratio of the two consecutive timestamps and the battery percentage difference between these two timestamps. We defined a threshold high enough to be able to recognize the measurement as an error.
For time-reset starting date estimation.
Rules based on charging and plugged state
This method focuses on the rules defined without time being included.
Rules: Charging (more than 20% change) while not on charger (ACEU-SCEU)
Charging (more than 20% change) while in discharging state (ACED-SCED) Big changes between consecutive elements (charging 20%, discharging 6%) (AP-SP) Charging (more than 20% change) while not on the charger and the phone is in a discharging state (ASC-SSC)
These methods could be applied in order to detect the beginning of a new measurement period (among the overlapped timestamps)
timestamps is only an indication that there could be an error in the measurements as a week or weeks may pass by after capturing and uploading the data to the server in the case of missing or inadequate network conditions.
We started to examine the nature of the Android timestamp.
First, we noticed records with timestamps that were signifi- cantly earlier (e.g., 01.01.1970) or later (01.01.2023) than our other measurements. Finding invalid time periods was trivial (like 2023), but it transpired during our in-depth investigation that several phones were reset to a valid date that lay within the observation period. In order to be able to properly detect this anomaly, we elaborated several simple heuristics for detection, these being shown in Table III.
We applied the anomaly detection heuristics mentioned above in order to compare two basic sorting approaches;
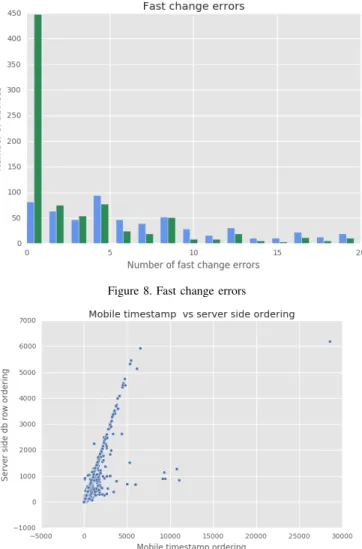
namely, sorting by the server-side information (e.g., serial number) and the sorting based on the mobile timestamp. We observe that for about 6-7 thousand devices the number of errors is zero. So, about 1/8 of the total devices are affected by the time overlap. Figure 8 shows the results of the fast change detector applied for the two ordering approaches (it was run on a filtered dataset, skipping the valid data). The green line (server-side sorting) indicates fewer fast change errors in most cases (it was able to eliminate this error on about 40% of the affected devices). The scatterplot below (Figure 9) also shows a clear correlation between the two sorting approaches and the number of fast change errors. The slope of the correlation line (and the points under the line) tells us that the server side sorting was able to reduce the fast change errors in most
Figure 8. Fast change errors
Figure 9. Mobile timestamp and server-side ordering
cases. Based on these findings, one simple approach for time overlap fixing might be the hybrid sorting approach where a given number of records are located after a fast change error had been sorted based on the server-side sorting.
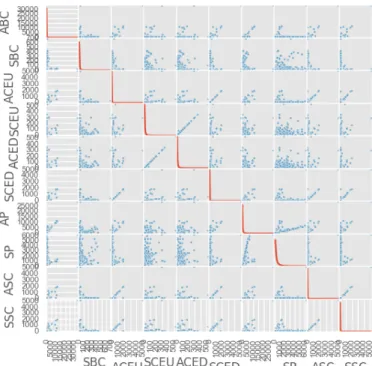
The effectiveness of the simple server-side sorting is also shown in the Figure 10 concerning the correlation between different error detection heuristics and the sorting methods. It is apparent that server-side sorting can significantly decrease the error level for all error detectors (when comparing the same method with S and A sorting, most of the points are below or above the similarity line).
With the previously described heuristics, we were able to demonstrate that the server-side sort order can reduce the rows suspected of being in the wrong position to about 1/10 of the total dataset. A further decrease in the suspected errors could be achieved with a richer ruleset that incorporated different mathematical models for batteries. For our purposes, the current reliability level of the causality dimension of the dataset is quite sufficient.
B. Sorting by client-side timestamps
Another advanced utilisation of our collected data is inter- preting the multiple user-sessions as a trace of a real network, where each user can communicate to each other in real time.
In an ideal world, we may assume sorting by client-side timestamps while the client-side timers are synchronised with
Figure 10. Error detectors
each other. However, as we mentioned above, there is a lot of uncertainty on the local timer, which is a major concern for us. In addition to this, the previously proposed methods do not fully cover this problem. This is because we need a sorting based on the local timestamps, which is in the same timeline with respect to actual time and we also need a filtering process for all the potential errors. Hence, here we will present a filtering proposal which ensures that the retained client-side timestamps are reliable.
Every examined timestamp has the same format, and it represents the number of milliseconds that has elapsed since Unix Epoch (UTC). The client-side timestamps are captured from the local timer. However, there is no further information about the local timer. All the methods below are performed for each user. In a nutshell, our solution is a three-step filtering procedure. First, we prefilter the data based on some basic rules. Second, we assume that we can trust the client-side timer and perform a sort. After, we look for clues about remaining errors. In the case of a hit the affected phase is filtered. From a bird’s eye view, the method is permissive while everything seems to be normal and the method performs a systematic search for errors when an unconventional event has occurred.
At the very beginning, we perform a rule-based prefiltering.
We discard all the records that have a more recent client-side timestamp than the server-side timestamp. We also discard all the records that have an older client-side timestamp than the actual appversion release date. The duplications are also prefiltered as described in Section IV-A.
Then, as we mentioned before we assume that the uncer- tainty about local timer is negligible. With this assumption, we can perform a sorting by client-side timestamps. Also, we record the previous position number from sorting by server- side timestamps for further examination. Now let us look at the assumption that we made. In the prefiltering phase we handled a lot of misleading measurement records, but not the whole.
Therefore, our assumption is basically wrong. Hence, we need to analyse the new order and filter the remaining error.
Next, we will describe the essential part of our method.
We look for a pattern that indicates the start of an error in consecutive records. If we find an error, we discard every record until any evidence is found for a certain phase. And we start the troubleshooting process repeatedly to the end. The consecutive pairs are expected to have the same incremen- tation for the previous and the recent sorting. Consequently, the main clue for a potential error is the difference in the incrementation of previous position number from server-side timestamp sorting. However, the examined record pair may still be in the correct order. This by itself is not a proof of an error. Therefore, further examination is needed. After, this event triggers a leap to aquestionablestate. In a questionable state, we are looking for evidence about consistency of the two consecutive records. If we do not find any error then we leave it as it is. In most cases, an error in obviously offline pairs does not bother us. This is because the order of the offline records does not have an effect on the properties of the network. Only the online ones do. To explain what we mean by a reliable pair, let us first check the uptime information of the device.
If both records have one, we compare their difference against the difference between the local timestamps. A one-second deviation is tolerated. If the deviation is sufficiently small, then the pair is reliable. We continue our examination with the change in battery level. An increasing or identical battery level is the proper change when the device is charging up.
Similarly, a decreasing or identical battery level is the proper change when the device is not charging up. In both cases, a one-unit deviation is tolerated in the opposite direction because of the inaccuracy of the measured battery level. A change in the charger status is not permitted, unless a proper trigger event about the change has occurred. These are very strict conditions for deciding whether a pair is reliable or not. In any other case the correctness is not guaranteed and this causes the troubleshooter to move into theerrorstate, which is a substate of questionable state. We also look for many reliable pairs to end these sessions. More specifically, these phases need to be at least one hour long from the last known questionable or error pair. This is the event that triggers the end of the questionable state and the error state. Upon quitting a questionable state without an error state, the whole examined phase is left as it is. However, when quitting an error state, the first record is left, as at the end of the previous session, and the whole phase is deleted (good or bad pairs equally) up to the last questionable or error pair. From these pairs, the first is also deleted and the last will be the first record of the next session.
The troubleshooting process is restarted from the end of the previously found, reliable one-hour session. Also, a one-hour difference between two consecutive records separates them.
In this case, the first record ends the previous phase, and the second starts a new one.
Lastly, let us discuss the number of discarded records. As the result of our filtering method, 2.33% of the records have been erased. Thanks to our consistency check, another 0.45%
of the records were temporal candidates for deletion, but they have survived.
C. NAT discovery result code corrections
The main feature of our application is the discovery of the NAT type. Users can ask the application about their NAT information and public IP address. This method is based on User Datagram Protocol (UDP) message-based communication between the device and a randomly picked STUN server. A STUN server can discover the public IP address and the type of NAT that the clients are behind.
We were faced with a problem that was caused by the prefixed STUN server list. It contains a list of 12 reliable servers that are suitable for NAT detection, this list being embedded inside the application code. It allows the device to randomly pick a STUN server. As a result, every measured NAT type in the timeline is based on a different STUN server’s NAT test. Hence it makes the measured data more trustworthy.
This random pick approach was well designed and worked very well initially. However, after a time four of the STUN servers went offline without any prior notice. Since then these four failed STUN servers provide the same NAT discovery result code as firewall blocked connections. As a result of this error, some uncertainty exists in the NAT discovery result code. Therefore, we propose a solution on how to correct it and make the collected data useable afterwards. Quite clearly, another solution is needed to avoid connections to a failed STUN server.
Now we need to discuss the obscure NAT discovery result code. This is the 16.76% of the total measurement records.
We carried out this examination over the dataset, which had already been prefiltered and processed, the order being based on the approach defined above (see Figure 11).
Firstly we need to discuss the FIREWALL BLOCKS result code. This code corresponds to NAT tests that have an open communication channel, but never get any response from the STUN server. In the normal case it means that the firewall blocks the connection. Unfortunately, the records also have no response from failed server, even though a part of these records may have an online NAT type. Therefore, these records are uncertain and further examination is required.
Below, we present a method for filtering the STUN server errors from the FIREWALL BLOCKS discovery result code.
This set of records contains uncertain potential online states.
The server fails with a 4/12 probability, and the event of consecutive repeated fails has an exponential pattern. Conse- quently, we define sessions with consecutive repeated FIRE- WALL BLOCKS discovery result codes and look at their distribution. If the distribution has roughly an exponential distribution, then we can interpret them as online and we can define their network properties. Otherwise, those that do not have an exponential fit will remain FIREWALL BLOCKS.
This means that in this way we cannot prove the opposite (the firewall blocks the connection). In general, we are looking for a session that begins and ends with the same network property and there are only uncertain online states between them. These sessions may be interpretable based on the begin- end enclosures. More specifically, the sessions must
• begin and end with the same NAT discovery result code
• begin and end with the same Service Set Identifier (SSID) in the case of a WiFi connection
• begin and end with the same mobile operator in the case of a mobile data connection
• contain only uncertain online states
• contain a time gap between two records only in a range of 0 to 15 minutes based on the fact that the maximum time gap between two regular online records is almost 10 minutes. However, it is not very accurate because of the Android support scheduler with its inexact trigger time requirements.
• not be interrupted by trigger events that correspond to any potential change in the network properties.
We show the above-defined candidate sessions in Figure 13 and Figure 14. Let us first take a look at how many
uncertain discovery result codes are enclosed by these sessions in Figure 13. It is clear that the first four points seem to fit an exponential curve. Consequently, it is still open to interpretation and the rest of the points remain undefined.
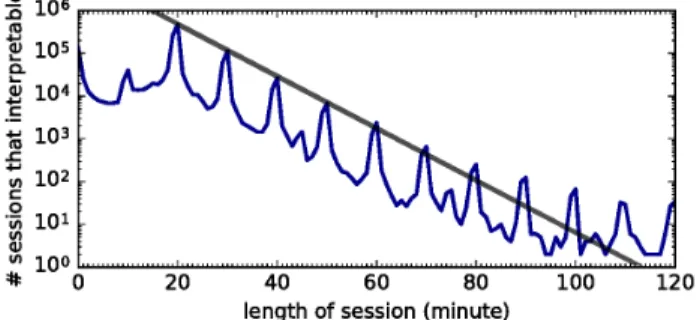
Next, Figure 14 shows length of the above-defined sessions.
There are some peaks every 10 minutes or so. These peaks correspond to the BATTERY SCHEDULED trigger event, which is scheduled every 10 minutes and this is the most common trigger event. For example, if there is exactly one uncertain FIREWALL BLOCKS value in the appropriate ses- sion and every taking of a measurement is triggered by this schedule event, then its length of time is around 20 minutes.
Based on this example, an above-defined session that contains three unknown records lasts for 50 minutes. Accordingly, we examined the points from the first phase up to 50 minutes. Our examination revealed that it also had an exponential pattern.
In contrast to the distribution in Figure 13, this distribution appears more complex, but it is still acceptable. Next, we associate the two findings. More specifically, the intersection of the two sets is an above-defined session that contains fewer than five uncertain elements and it lasts no longer than 50 minutes. Based on this rule, we can correct the network properties of 6.7% of the measurement records.
Next, we should mention some other minor errors asso- ciated with data collection. In very few cases there was no network connection, but it still has some errors in the discovery result code (mainly code 0). Here, we simply correct all of them to the no-connection state (-2).
Now let us have a look at the final results of the NAT data correction in Figure 12. The records with FIRE- WALL BLOCKS code have dropped to 10%, and the records with an online state have increased.
V. LESSONS LEARNT
A. NAT measurements
Based on our findings, some of the challenges encountered proved to be quite trivial, and required only some small modifications to the algorithm, while others still have to be tested with our proposed solutions.
On the client side, we have found several elements where the default approach of Android development proved insuffi- cient, and special consideration was needed for proper data collection. We found that the timeout value of the Android application should be increased in proportion to the connectiv- ity quality with the data collector server, while the number of retries should be reconsidered and perhaps revised with upload batches accompanied by identifiers to make duplicate detection easier.
The detection of the NAT anomalies was made significantly easier through the NetworkInfo and WifiInfo objects of the Android system. When collecting network data, we found it highly advisable to include as many attributes from these rich objects as possible - such as SSID, whether the phone is in the roaming mode and whether the network is connection metered -, since any of these could explain possible anomalies in the dataset. For example, the phone might be connected to a WiFi network, but the router is not necessarily connected to the Internet; or, if it is located at a public establishment, it may redirect the requests to the establishment’s login site instead of the original destination - all of which are serious problems, and they could go unnoticed without detailed information about the network.
Regarding the NAT problem, it is also advisable to recon- sider storing the list of external servers in a constant array
Others
4 3
6 7 12
1 17
5 21
-2 40
NAT Discovery Result Code
-2 NO CONNECTION 11951611 40.03%
-1 ERROR 29 <0.01%
0 OPEN ACCESS 706662 2.37%
1 FIREWALL BLOCKS 5002770 16.76%
2 SYMMETRIC FIREWALL 198442 0.66%
3 FULL CONE 1993739 6.68%
4 RESTRICTED CONE 280969 0.94%
5 PORT RESTRICTED CONE 6240586 20.90%
6 SYMMETRIC CONE 3482591 11.66%
Figure 11. Discovery Result Code
Others
3 3
1 8 10
6 14
5 24
-2 42
NAT Discovery Result Code after correction
-2 NO CONNECTION 12401805 41.53%
-1 ERROR 29 <0.01%
0 OPEN ACCESS 284206 0.95%
1 FIREWALL BLOCKS 2999985 10.05%
2 SYMMETRIC FIREWALL 230693 0.77%
3 FULL CONE 2295290 7.69%
4 RESTRICTED CONE 318136 1.07%
5 PORT RESTRICTED CONE 7272018 24.35%
6 SYMMETRIC CONE 4055237 13.58%
Figure 12. NAT Discovery Result Code after correction
Figure 13. Discovery result code enclosed by sessions
Figure 14. Length of candidate sessions
(a practice which is very common based on our experiences), because if one of those servers goes offline, it might generate huge amounts of incorrect data. A proxy which stores the server list, keeps it updated by using regular checkups, and forwards the list to the phones on request, would be a better solution here.
Also, while the deletion of previous data is a good practice to stop the application from taking up too much storage space, the 24-hour limit might be too short, since important events could get lost in that time period. The time limit for storage before deletion should be featured among the settings. Even after a delete, it is necessary to leave some trace of the deleted data - at least a log -, so the anomalies in the later, successful uploads could be interpreted.
The timestamp desynchronisation between the server and the client remains perhaps the most challenging problem, with the battery-based sortings providing some improvements in the dataset. One solution might be a lightweight log timestamping.
In this case only a hash of the log would be sent to the server frequently (in order to minimise the mobile traffic and save the battery), where a reliable timestamp would be attached on the server side to this hash and saved in a permanent storage. In this way, we may define reliable milestones which are independent of the mobile side timestamps. On the mobile
side, it is important to preserve the total order of the events.
This could be achieved by using a simple increasing indexing procedure in the SQLite database.
We mentioned earlier that even NAT types may be mislead- ing, despite the quality of the connection. Once again, some of these incorrect values could be corrected by simply checking the actual state of connectivity during the upload. The NAT type in the remaining records is mostly corrected by a pattern recognition method. Hopefully, this problem may never occur again after the proposed changes have been made to handle a dynamic STUN server list.
B. Peer-to-Peer measurements
After the first implementation of the P2P connection we wanted to know about the time of establishing a connection, making a disconnection and detecting the peer’s disappearance.
In addition, we wanted to know what happens to the peers if they make a reconnection or if they connect to another access point.
In order to discover the capabilities of WebRTC and understand how the peers work in practice, we have to keep the whole signaling mechanism in hand. These expectations address several challenges.
Firstly, we want the measurements not to be influenced by users, so we cannot use the normal push notifications.
Firebase Cloud Messaging (FCM) provides a solution for sending notifications without visible alerts, this is the so-called silent push notification. With the help of FCM, we can send data to the application that runs on a device; however, the process does not need user interaction.
Using the silent push notification, we have recognized other issues. This type of notification can wake up a device if the application runs in the background. If we kill the application that runs in the background, the silent push cannot address
Unanswered 94
Answered
6
Figure 15. Ratio of answered and unanswered offers
Others
5 4-5
3 6-3
3 3-5
4 5-4
4
5-6 11
5-3 14
6-5 14
43 5-5
Caller’s NAT type Callee’s NAT type Ratio of P2P connections
Open Access (0) Full Cone (3) 2.5%
Symmetric Firewall (2) Full Cone (3) 1.8%
Full Cone (3) Port Restricted Cone (5) 3.6%
Restricted Cone (4) Port Restricted Cone (5) 2.7%
Port Restricted Cone (5) Open Access (0) 0.7%
Port Restricted Cone (5) Full Cone (3) 14.3%
Port Restricted Cone (5) Restricted Cone (4) 3.9%
Port Restricted Cone (5) Port Restricted Cone (5) 42.8%
Port Restricted Cone (5) Symmetric Cone (6) 10.7%
Symmetric Cone (6) Full Cone (3) 2.9%
Symmetric Cone (6) Port Restricted Cone (5) 14.3%
Figure 16. Number of P2P connections with different NAT types
the device. When the application starts, the mobile device subscribes to the Firebase Realtime Database. Hence, we store the set of available devices in this database with a hashed identifier. If the user quits from the application, the device unsubscribes from the database. Since killing an application is a different event compared to the sophisticated quit method, the onDestroy() method will never be called. Hence, we had to catch the small time gap that occurs right before killing the application.
During the tests we have also discovered that the resources for an application that runs in the background are only allo- cated for a given time. Unfortunately, we cannot catch the exact timestamp of deallocation, so the devices that take the resources away from Stunner are shown as still available, but the notification cannot wake up them. We also have to take into account this anomaly.
Under the examination of the collected logs, we have also realized that in many cases the SDP information are not satisfying to establish P2P connection. In some cases, only IPv6 information are retrieved from the STUN server and the necessary IPv4 information are missing. Sometimes the public IP address and available ports are missing and only the private IP address is given. Due to lack of necessary information, the P2P connection cannot be established between two peers.
Knowing these issues, we have cleaned the collected P2P logs first, then we started to analyze the remaining data.
The first version of Stunner - that contains the P2P module - was published on 25th April, 2018. Since then we have released 3 different updates that improved the performance of the application a lot. Since the new version of Stunner was released, we have collected more than 200,000 logs.
The collected data showed that more than 90% of the offers were unsuccessful because the silent push notification could not awake the slept application. As it can be seen in Figure 15, the number of sent offer dominates the number of sent answers. The ratio was calculated from the Firebase server logs.
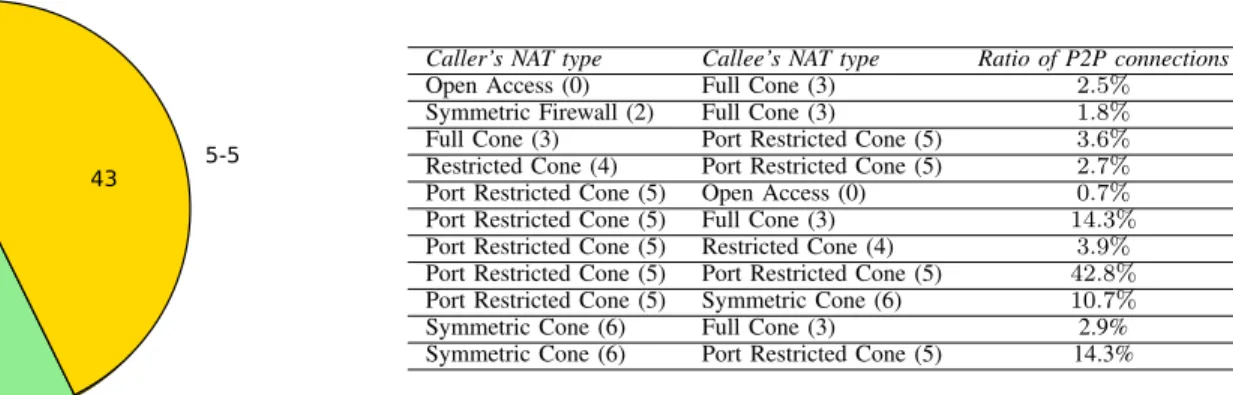
After the data cleaning, we still have a huge number of useful data. From the remaining data, we have seen that the peers behind different NAT types show an interesting pattern to the P2P connections. Figure 16 shows ratios of the successful P2P connections. An interesting fact is that most of the successful P2P measurements were done by devices behind
Port restricted NATs. Surprisingly, we have also experienced that in many cases, the mobile devices with Symmetric Cone NAT could also connect to other devices.
Another interesting point is how much time the P2P connection takes to establish. We determined this by logging four different timestamps. The first one is the time when the peer started to gather its information from the STUN server, and the second one is the time when both the peers shared their information with each other. The third one is the beginning of the time when the datachannel is created and the fourth one is the time when the connection is totally closed.
The disconnection is a very fast process, but establishing a connection takes 6.745 seconds on average. It takes this much time, because the device that begins the connection has to turn to the STUN server for getting the information about the IP addresses and available ports, get a list of available peers, choose one from the list, send the data via signaling server and create the datachannel between the two WebRTC clients.
VI. CONCLUSIONS
As the reader can no doubt see, our approach worked well in the above-mentioned areas of data cleaning. Since the application was launched in 2013, it has been downloaded by more than 20,000 users from over 1,300 different carriers and 35,000 different WiFi areas, to hundreds of different device types, which is providing enormous amounts of valuable data for the analysis of NAT traces, patterns, and later on, for the simulation of the above attributes.
Compared to other crowdsourcing projects, our crowd- sourcing approach was a hybrid methodology, where we pro- vided a certain number of users with smartphones, and released the app to the Play Store for wider availability, and took more data measurements from different parts of the world. We did not reach the volume of OpenSignal or Bredbandskollen with their 100-200+ million datasets, but this hybrid solution still provided us with a much bigger amount of valuable data than a closely monitored environment like FlierMeet or SignalLab that had roughly 40 devices, a shorter collection time period, and operated in a restricted environment like a university campus or a development environment.
Lastly, we have implemented the WebRTC project in our application, and have started gathering useful information about the various metrics of P2P connections. With this data,
we will be able to create an even better smartphone simulation network, where the events and metrics will be able to reflect the actual, real-life behaviour of the test algorithms. Our next major step will be the in-depth testing of P2P algorithms, find- ing better solutions for the keep-alive issues of the application and the determination of the speed and stability of smaller applications running in a simulated environment.
ACKNOWLEDGMENT
This research was supported by the Hungarian Govern- ment and the European Regional Development Fund under the grant number GINOP-2.3.2-15-2016-00037 (”Internet of Living Things”).
REFERENCES
[1] Z. Szab´o, V. Bilicki, ´A. Berta, and Z. R. J´anki, “Smartphone-based Data Collection with Stunner Using Crowdsourcing: Lessons Learnt while Cleaning the Data,” in ICCGI 2017, The Twelfth International Multi- Conference on Computing in the Global Information Technology, July 2017, pp. 28–35.
[2] G. Chatzimilioudis, A. Konstantinidis, C. Laoudias, and D. Zeinalipour- Yazti, “Crowdsourcing with smartphones,” IEEE Internet Computing, vol. 16, no. 5, 2012, pp. 36–44.
[3] I. Burguera, U. Zurutuza, and S. Nadjm-Tehrani, “Crowdroid: behavior- based malware detection system for android,” In Proceedings of the 1st ACM workshop on Security and privacy in smartphones and mobile devices, October 2011, pp. 15–26.
[4] B. Guo and et al., “FlierMeet: a mobile crowdsensing system for cross-space public information reposting, tagging, and sharing,” IEEE Transactions on Mobile Computing, vol. 14, no. 10, 2015, pp. 2020–
2033.
[5] M. Stevens and E. D’Hondt, “Crowdsourcing of Pollution Data using Smartphones,” in Workshop on Ubiquitous Crowdsourcing, held at Ubicomp ’10, September 2010, pp. 1–4.
[6] A. Leemann, M. J. Kolly, R. Purves, D. Britain, and E. Glaser,
“Crowdsourcing language change with smartphone applications,” PloS one, vol. 11, no. 1, 2016, pp. 1–25, e0143060.
[7] T. Linder, P. Persson, A. Forsberg, J. Danielsson, and N. Carlsson,
“On using crowd-sourced network measurements for performance pre- diction,” in In Wireless On-demand Network Systems and Services (WONS), 2016 12th Annual Conference on. IEEE, January 2016, pp. 1–8.
[8] A. Overeem and et al., “Crowdsourcing urban air temperatures from smartphone battery temperatures,” Geophysical Research Letters, vol. 40, no. 15, 2013, pp. 4081–4085.
[9] A. Berta, V. Bilicki, and M. Jelasity, “Defining and understanding´ smartphone churn over the internet: a measurement study. In Peer-to- Peer Computing (P2P),” in 14-th IEEE International Conference on.
IEEE, September 2014, pp. 1–5.
[10] E. Oliver, “The challenges in large-scale smartphone user studies,” In Proceedings of the 2nd ACM International Workshop on Hot Topics in Planet-scale Measurement, June 2010, p. 5.
[11] C. Shepard, A. Rahmati, C. Tossell, L. Zhong, and P. Kortum, “LiveLab:
measuring wireless networks and smartphone users in the field,” ACM SIGMETRICS Performance Evaluation Review, vol. 38, no. 3, 2011, pp. 15–20.
[12] D. T. Wagner, A. Rice, and A. R. Beresford, “Device Analyzer:
Large-scale mobile data collection,” ACM SIGMETRICS Performance Evaluation Review, vol. 41, no. 4, 2014, pp. 53–56.
[13] A. Faggiani, E. Gregori, L. Lenzini, V. Luconi, and A. Vecchio,
“Smartphone-based crowdsourcing for network monitoring: Opportu- nities, challenges, and a case study,” IEEE Communications Magazine, vol. 52, no. 1, 2014, pp. 106–113.
[14] A. B. Johnston and D. C. Burnett, WebRTC: APIs and RTCWEB Protocols of the HTML5 Real-Time Web. Digital Codex LLC, 2012.
[15] M. H. Rahaman, “A Survey on Real-Time Communication for Web,”
Scientific Research Journal (SCIRJ), vol. 3, no. 7, 2015, pp. 39–45.