Stunner: A Smart Phone Trace for Developing Decentralized Edge Systems
?Zoltán Szabó1[0000−0003−3863−7595], Téglás Krisztián1, Berta
Árpád1[0000−0002−4005−2273], Márk Jelasity1,2[0000−0001−9363−1482], and Vilmos Bilicki1
1 University of Szeged, Szeged, Hungary
2 MTA SZTE Research Group on Artificial Intelligence, Szeged, Hungary
Abstract. Conducting research into edge and fog computing often in- volves experimenting with actual deployments, which is costly and time- consuming, so we need to rely on realistic simulations at least in the early phases of research. To be able to do so we need to collect real data that allows us to perform trace-based simulation and to extract crucial statistics. To achieve this for the domain of distributed smartphone ap- plications, for many years we have been collecting data via smartphones concerning NAT type, the availability of WiFi and cellular networks, the battery level, and many more attributes. Recently, we enhanced our data collecting Android app Stunner by taking actual P2P measurements.
Here, we outline our data collection method and the technical details, including some challenges we faced with data cleansing. We present a preliminary set of statistics based on the data for illustration. We also make our new database freely available for research purposes.
1 Introduction
Distributed computing over the edge as part of various smart systems is becom- ing a popular research topic [4]. Research into algorithms that are suitable to such environments often involves actual deployments, because realistic conditions are non-trivial to model, yet they are crucial for finding an optimally efficient and robust solution. Still, this severely limits the possibilities of exploratory research.
One important domain is smartphone applications that can form a part of many smart systems such as smart city or e-health solutions [14]. In this do- main, it is important to fully understand the capabilities and limitations of the devices and their network access as well. This includes battery charging patterns, network availability (churn) and network attributes (for example, NAT type).
?The original publication is available at link.springer.com. In Proc. DAIS 2019, LNCS 11534, pp. 108–115, 2019. DOI: 10.1007/978-3-030-22496-7_7. This work was supported by the Hungarian Government and the European Regional Develop- ment Fund under the grant number GINOP-2.3.2-15-2016-00037 (“Internet of Liv- ing Things”) and by the Hungarian Ministry of Human Capacities (grant 20391- 3/2018/FEKUSTRAT).
Our team started to develop the smartphone appStunnerin 2013 to collect data concerning the NAT properties of smartphones using the STUN protocol [2], as well as many other attributes such as battery level and network availability.
Since then, we have collected a large trace involving millions of individual mea- surements. Recently, we also updated the application to collect data concerning direct peer-to-peer capabilities based on a basic WebRTC implementation.
There have been many data collection campaigns targeting smartphones.
This included the famous Mobile Data Challenge (MDC) [6], which aimed to collect large amounts of data from smartphones for various research studies, in- cluding sensory data, cell towers, calls, etc. and ran between 2009 and 2011, resulting in the largest and most widely known dataset yet. After this, the most prominent project to achieve similar results was the Device Analyzer Experi- ment. started in 2011 by the University of Cambridge, aiming to not only record similar attributes to the MDC, but also system-level information such as phone types, OS versions, energy and charging [13, 3]. This trace has been used, for example, to determine the most energy consuming Android APIs [7] or to recon- struct the states of battery levels on the monitored smartphones [5]. Our dataset is unique in that, apart from being five years long, it contains all the necessary attributes to simulatedecentralized applications.
Another set of projects are concerned with measuring the network (e.g., de- tecting NAT boxes) as opposed to collecting a full trace from the devices, which is our main goal. For instance, in 2014 a study was initiated to analyze the de- ployment rate of carrier-grade NATs that can hide entire areas behind a single public IP address [11]. The measurement was based on Netalyzr, as well as on crawls of BitTorrent DHT tables to detect possible leaked internal addresses due to hairpin NAT traversal. In another study across Europe, an application called NAT Revelio was developed [9]. Yet another data collection campaign attempted to collect traceroute sessions from smartphones using the custom TraceboxAndroid application [12]. The application detects the exact number of middleboxes and NAT translations encountered between the device and a specified test target. In a similar two-week campaign, the Netpicularapplica- tion was deployed [15]. Also, a mobile application called Mobil Traceboxwas deployed to carry out traceroute measurements [16]. This campaign ran for an entire year. A summary of these NAT studies can be found in Table 1.
While our NAT measurements are simply based on STUN server feedback [8], thus underestimating the complexity of the network, our P2P measurements indicate that our NAT type data is a good basis for predicting connection success (see Section 3).
Our contribution is fourfold: (1) our applicationStunnerhas been collecting data for a much longer time than any of these applications, which allows us to observe historic trends; (2) in the latest version, we measure direct P2P connec- tions allowing us to collect NAT traversal statistics; (3) we collect a wide range of properties simultaneously, including NAT type, battery level, network avail- ability, and so on, to be able to fully model decentralized protocols; and (4) we make our trace publicly available athttp://www.inf.u-szeged.hu/stunner.
Table 1.Comparison between various NAT measurement campaigns Source Collected Attributes Length Public Tools [11] local, external and public
IP addresses
2014-2016 No Netalyzr
[9] external IP, mapped port, traceroute results, UPnP query results
2016 May and August
No NAT Revelio
[16] traceroute results 2016 Feb - 2017 Feb
No Mobile Tracebox [15] traceroute results, number
of detected middleboxes
2011 Jan., 2 weeks
No Netpiculet [12] traceroute results, number
of detected middleboxes
2014 May - Sep
No TraceboxAndroid
2 Data collection methodology
The functionality of our Android appStunneris to provide the user with infor- mation about the current network environment of the phone: private and public IP, NAT type, MAC address, and some other network related details [2]. At the same time, the app collects data about the phone and logs it to our servers. The app was launched in April 2014, when it was simply made public without much advertising. Since then, at any point in time we had a user base of a few hundred to a few thousand users, and over 40 million measurements have been collected from all over the world.
In the original version measurements were triggered either by the user (when the app is used) or by specific events that signal the change of some of the properties we measure: battery charging status, network availability. There was periodic measurement as well every 10 minutes, if no other events occurred.
The latest version was completely redesigned. This was necessary because Android has become very hostile to background processes when the phone is not on a charger, in an effort to save energy. For this reason, we now collect data only when the phone is on a charger. This, however, is not a real issue, because for decentralized applications these are the most useful intervals, when it is much cheaper to communicate and to perform computing tasks in the background.
Android event handlers have also became more restricted, so we can use them only under limited circumstances or on early Androids. The events raised by connecting to a charger or a network can still be caught by the Android job scheduler, but the timing of these events is not very reliable.
For this reason, instead of relying on event handlers, we check the state of the phone every minute, and if there is a change in any important locally available networking parameter or in charging availability, we perform a full measurement.
A measurement is still triggered if the user explicitly requests one, and it is
Connection open failed Connection open but transport error
Connection lost Timed out after successful signaling
Timed out without peer Offer rejected Timed out with peer
Unsuccessful connection or transport (40%) Successful connection and transport (34%) Signaling related error (26%)
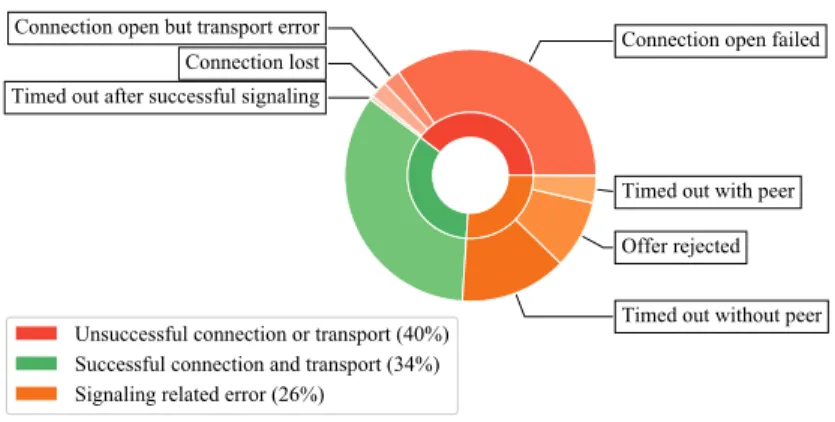
Fig. 1.Proportions of the possible outcomes of P2P connection attempts.
also triggered by an incoming P2P measurement request. Also, if there is no measurement for at least 10 minutes, a full measurement is performed.
P2P connection measurements are also a new feature in the latest version that are performed every time a measurement is carried out. They are based on the WebRTC protocol [1], with Firebase as a signaling server [10], and a STUN server [8]. We build and measure only direct connections, the TURN protocol for relaying is not used. Every node that is online (has network access and is on a charger) attempts to connect to a peer. To do this, the node sends a request to the Firebase server after collecting its own network data. The server attempts to find a random online peer and manages the information exchange using the Session Description Protocol (SDP) to help create a two-way P2P connection over UDP. If the two-way channel is successfully opened then a tiny data massage is exchanged. The channel is always closed at the end of the measurement. One connection is allowed at a time, every additional offer is rejected. The signaling server maintains an online membership list.
3 Some measurement results
For illustration, we present some of the interesting patterns in our trace. Figure 1 shows the proportions of the outcomes of 63184 P2P connection attempts.
Out of all the attempts,34% was completed successfully. Let us briefly describe the possible reasons for failure. First, signaling related error means that the SDP data exchange via the signaling server failed. This can happen, if the server contacts a possible peer but the peer replies with a reject message (offer rejected), or it does not reply in time (timed out with peer), or we cannot see proof in the trace that any peer was actually contacted (timed out without peer). Note that a peer rejects a connection if it has an ongoing connection attempt of its own.
If the signaling phase succeeds, we have a pair of nodes ready to connect.
The most frequent error here is failing to open the channel, most likely due to incompatible NAT types. After the channel is open, transporting the test
OA FC RC PRC SC SF FB N/A
OA FC RC PRC SC SF FB N/A
initiator’s NAT type
peer’s NAT type
0 20 40 60 80 100
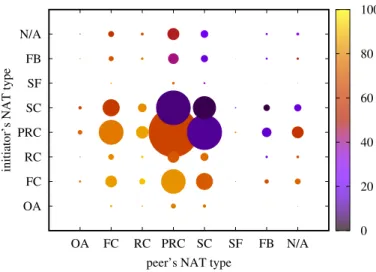
Fig. 2.Statistics over successful connections as a function of NAT type. The area of a disk is proportional to its observed frequency, the color signifies the success rate.
Examined NAT types: OA - Open Access, FC - Full Cone, RC - Restricted Cone, PRC - Port Restricted Cone, SC - Symmetric Cone, SF - Symmetric UDP Firewall, FB - Firewall blocks, N/A-missing type
message is still not guaranteed to succeed (transport error). Participant nodes may disconnect with an open connection (connection lost). In some rare cases a timeout also occurred after successful signaling, that is, the WebRTC call did not return in time.
Figure 2 shows statistics over successful connections as a function of NAT type. Here, we do not include signaling related errors. Note that NAT type discovery is an independent process executed in parallel with the P2P connection test. Therefore, there are some cases where the NAT type information is missing but the signaling process is completed nevertheless.
We illustrate the dynamics of the NAT distribution over the years in Figure 3 (left). The distribution is based on continuous sessions of online users. These continuous sessions of homogeneous network conditions were determined based on the measurement records. A session has a start time, a duration, and a NAT type. The distribution is calculated based on the number of aggregated millisec- onds of session durations falling on the given day. The distribution of online time per day is near8%almost every time. Recall, that here the online state is meant to imply that the phone is on a charger.
The plot has gaps because in 2015 the data collector server was down, when the project was temporarily neglected. In addition, the first version of our P2P connection measurement implementation caused lots of downtime in 2018. Also, some of the STUN servers that were initially wired in to the clients disappeared over the years. As a result, theFirewall blocked NAT type is not reliable, so we
2014-042014-102015-042015-102016-042016-102017-042017-102018-042018-102019-04 0.0
0.2 0.4 0.6 0.8 1.0
<=0 1 2 3 4 5 6
session length (ln) 0
5000 10000 15000 20000 25000
number
SCPRC RCFC SFFB OA
Fig. 3.(1) NAT distribution per day over 5 years (2) Session length distribution
2014 2016 2017 2018 South America 0.0
0.2 0.4 0.6 0.8 1.0
2014 2016 2017 2018
North America 2014 2016 2017 2018
Europe 2014 2016 2017 2018
Asia 2014 2016 2017 2018
Africa 2014 2016 2017 2018 Oceania
2014 2016 2017 2018 VODACOM
0.0 0.2 0.4 0.6 0.8 1.0
2014 2016 2017 2018 Chunghwa Telecom2014 2016 2017 2018
AT&T 2014 2016 2017 2018 Magyar Telekom2014 2016 2017 2018
Korea Telecom 2014 2016 2017 2018 PCS Systems 2014 2016 2017 2018
TWC Internet 2014 2016 2017 2018 Xfinity 2014 2016 2017 2018
Verizon 2014 2016 2017 2018 Deutsche Telekom
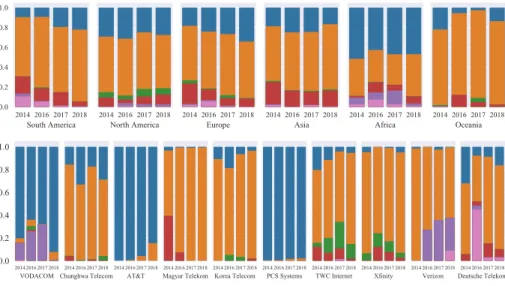
Fig. 4.NAT type distribution by continent in 4 different years (top) and NAT type distribution by the top 10 providers in 4 different years (bottom). Colors represent types as defined in Figure 3.
exclude that category from the figure. Note that the distribution is surprisingly stable over the years.
We present session length distribution as well in Figure 3 (right). Session length is in minutes, the bins for the histogram are defined on a logarithmic scale. Sessions shorter than one minute are not always measured accurately due to our one minute period of observation, so we group such sessions in one bin (<= 0).
Figure 4 contains stacked bar charts illustrating the distribution of different NAT types in the 6 continents and in the networks of the top 10 most repre- sented providers in 4 different years. The most common NAT type is the Port
Restricted Cone except in Africa where the Symmetric Cone has a relatively larger share. According to the chart the rarest NAT type is Open Access ev- erywhere. Interestingly, the NAT type distribution is very different among the different providers, unlike in the case of the distributions based on geographic location.
4 Conclusion
Here, we outlined the latest version of our Android app Stunnerfor collecting a smartphone trace. Our motivation was to enable exploratory research into de- centralized algorithms for edge systems. Our trace contains locally observable at- tributes such as battery status and network availability, STUN measurements, as well as direct P2P connection data. In this unique combination, we can combine these sources of data to be able to predict, for example, P2P connection success, or to simulate distributed protocols over overlay networks of smartphones. Our trace spans over five years and contains over 40 million measurements. We also make the anonymized version of our trace publicly available.
References
1. Webrtc 1.0: Real-time communication between browsers (2018),https://www.w3.
org/TR/webrtc/
2. Berta, A., Bilicki, V., Jelasity, M.: Defining and understanding smartphone churn over the internet: a measurement study. In: 14-th IEEE International Conference on Peer-to-Peer Computing. IEEE (2014)
3. Cheng, X., Fang, L., Hong, X., Yang, L.: Exploiting mobile big data: Sources, features, and applications. IEEE Network 31(1), 72–79 (2017)
4. Garcia Lopez, P., Montresor, A., Epema, D., Datta, A., Higashino, T., Iamnitchi, A., Barcellos, M., Felber, P., Riviere, E.: Edge-centric computing: Vision and chal- lenges. SIGCOMM Comput. Commun. Rev. 45(5), 37–42 (Sep 2015)
5. Gechter, F., Beresford, A.R., Rice, A.: Reconstruction of battery level curves based on user data collected from a smartphone. In: Artificial Intelligence: Methodology, Systems, and Applications. pp. 289–298. Springer International Publishing (2016) 6. Laurila, J.K., Gatica-Perez, D., Aad, I., Blom, J., Bornet, O., Do, T.M.T., Dousse, O., Eberle, J., Miettinen, M.: The mobile data challenge: Big data for mobile computing research (2012)
7. Li, L., Beitman, B., Zheng, M., Wang, X., Qin, F.: edelta: Pinpointing energy deviations in smartphone apps via comparative trace analysis. In: 2017 Eighth International Green and Sustainable Computing Conference (IGSC). pp. 1–8. IEEE (2017)
8. MacDonald, D., Bruce, L.: NAT behavior discovery using session traversal utili- ties for NAT (STUN). No. RFC 5780. (2010),http://www.rfc-editor.org/info/
rfc5780
9. Mandalari, A., Lutu, A., Dhamdhere, A., Bagnulo, M., claffy, k.: Tracking the Big NAT across Europe and the U.S. Tech. rep., Center for Applied Internet Data Analysis (CAIDA) (Apr 2017)
10. Moroney, L.: Firebase Cloud Messaging, pp. 163—188. Apress, Berkeley, CA (2017)
11. Richter, P., Wohlfart, F., Vallina-Rodriguez, N., Allman, M., Bush, R., Feldmann, A., Paxson, V.: A multi-perspective analysis of carrier-grade nat deployment. In:
Proceedings of the 2016 Internet Measurement Conference. ACM (2016)
12. Thirion, V., Edeline, K., Donnet, B.: Traffic Monitoring and Analysis, chap. Track- ing Middleboxes in the Mobile World with TraceboxAndroid, pp. 79—91. Springer (2015)
13. Wagner, D.T., Rice, A., Beresford, A.R.: Device analyzer: Understanding smart- phone usage. In: Mobile and Ubiquitous Systems: Computing, Networking, and Services. pp. 195–208. Springer International Publishing (2014)
14. Wang, J., Cao, B., Yu, P.S., Sun, L., Bao, W., Zhu, X.: Deep learning towards mobile applications. In: IEEE 38th International Conference on Distributed Com- puting Systems (ICDCS). pp. 1385–1393 (Jul 2018)
15. Wang, Z., Qian, Z., Xu, Q., Mao, Z., Zhang, M.: An untold story of middleboxes in cellular networks. In: Proceedings of the ACM SIGCOMM 2011 conference. ACM (2011)
16. Zullo, R., Pescapé, A., Edeline, K., Donnet, B.: Hic sunt NATs: Uncovering address translation with a smart traceroute. In: 2017 Network Traffic Measurement and Analysis Conference (TMA). IEEE (2017)
![Table 1. Comparison between various NAT measurement campaigns Source Collected Attributes Length Public Tools [11] local, external and public](https://thumb-eu.123doks.com/thumbv2/9dokorg/1288693.103166/3.918.202.726.200.435/comparison-between-various-measurement-campaigns-collected-attributes-external.webp)