Community ECology 20(3): 230-237, 2019 1585-8553 © AkAdémiAi kiAdó, BudApest
dOi: 10.1556/168.2019.20.3.3
Introduction
The contribution of microbiology to biological research has been highlighted with advances in sequencing technolo- gies, as shown in Figure 1. Newly developed tools for data analysis in microbiology need to be able to be adapted to a growing number of possible interpretations of the data; the rich variety of tasks requires tools to address an almost con- tinuous stream of questions.
Amplicon gene sequencing remains one of the most im- portant methods to study microbial communities (Segata et al. 2013, Boughner and Singh 2016, Hugerth and Andersson 2017), and the conventional bioinformatics pipelines, used to process sequencing data in these studies, can be roughly divided into two stages: a resource-consuming stage of se- quence clustering and taxonomic annotation, and different types of analysis and interpretation, including diversity cal- culations, hypothesis testing, and data visualisation. The first stage, considered in details, is subdivided into picking the amplified fragments of the reference gene into operational taxonomic units (OTU), and the assignment of the taxonomic annotation to each OTU. In the conventional systems of mi-
crobial taxonomy, seven levels are used to annotate the bac- teria: phylum, class, order, family, genus, and species. The annotation of OTUs might be not precise enough and identifi- cation might be limited to a genus or even to a higher level of the hierarchy (Almeida et al. 2018).
The most informative experiments include simultaneous processing of several samples. Therefore, the results from the first stage of pipeline can usually be presented in a rela- tively compact form of abundance tables for taxonomic units, i.e., the number of reads included in each OTU for each of the samples. This tabular data is supported by standardised formats, such as the “Biology observation matrix” (BIOM) format (McDonald et al. 2012). In addition, for the whole metagenome and metatranscriptome sequencing, software packages such as sortmerna (Kopylova et al. 2016) enable the representation of the microbiome community composi- tion under study in the form of a table of abundance counts.
The integrated downstream pipeline with all the conven- tional types of data analysis and visualisation (such as diver- sity estimates, heatmaps, and PCA charts) could be useful to present a wide range of experiments. However, in some situations, the scientist should find a clue to the interpretation
Tools and a web server for data analysis and presentation in microbial ecology
S. Feranchuk
6, N. Belkova
1, U. Potapova
2, I. Ochirov
3, D. Kuzmin
4,5and S. Belikov
21 Scientific Centre for Family Health and Human Reproduction Problems, 664003 Irkutsk, Russia
2 Limnological Institute, Siberian Branch of Russian Academy of Sciences, 664033 Irkutsk, Russia
3 Regional Medical and Sports Clinic “Zdorovie”, 664003, Irkutsk, Russia
4 Laboratory of Forest Genomics, Genome Research and Education Center, Siberian Federal University, 660036 Krasnoyarsk, Russia
5 Department of High Performance Computing, Institute of Space and Information Technologies, Siberian Federal University, 660074 Krasnoyarsk, Russia
6 Corresponding author; e-mail: feranchuk@gmail.com
Key words: Data analysis; Free software; Graphical presentation; Interactive visualization; Microbial ecology; Web server.
Abstract: The methods for data presentation are important in bioinformatics as data processing algorithms. The article describes the software package for the extensive analysis of tables with estimates of bacterial abundance levels in environmental samples.
The package was designed to be executed in a distributed hardware environment, with powerful packages in Python in the back- end and interactive front-end forms. Most of microbial ecology-specific functionality is implemented by the scikit-bio Python package, together with the other Python packages intended for big data analysis. Interactive visualisation tools are implemented by the D3.js software library, therefore, the software project is named D3b. The package is a suite of tools for the analysis of microbial ecology data implemented as a web-service and as a desktop application. It supports a substantial part of the graphi- cal and analytical descriptions of microbial communities used in scientific publications. Source codes are available at github (sferanchuk/d3b_charts) and the on-line version of the system is accessible at d3b-charts.bri-shur.com.
Abbreviations: BIOM–Biology Observation Matrix; MDS–Multi-Dimensional Scaling; OTU–Operational Taxonomic Unit;
PCA–Principal Components Analysis; RDP–Ribosomal Database Project.
of the experiment, and the interactive flexible tools for data presentation could help in this task.
Unification of mathematical concepts from different ar- eas of science could be implemented within a single software infrastructure such as Python, so that the software interface for the Euclidean measure in geometry and Hamming dis- tance in informatics could be almost the same as the Bray- Curtis and Jaccard dissimilarity measures in ecology, by us- ing the ‘scipy.spatial.distance’ Python library. This opens the possibility to satisfy the declared requirements of wide flex- ibility of data analysis tools for microbiologists. Expressive and clear graphics contribute significantly to clarifying the interpretations of the data, however, software tools, devel- oped to manage graphics objects at a sufficiently high level of abstraction, also allow the results to be represented in the most convenient ways.
The other side to the observed development and unifica- tion of software libraries is, firstly, the care taken to ensure the mutual consistency of heterogeneous packages which are composed together to support the wide spectrum of repre- sentations at another end of a software system. A sign that the problem of inconsistencies is growing is development of packaging systems, such as Anaconda, at an increasing rate.
Furthermore, the scarcity of resources, directed to software development and to the teaching of newly developed tools, leads to problems, such as competition and increased inequal- ity in the allocation of that resource, revealing the problems typical of the most of societies, even with an increased con- trast.
The list of software packages developed for microbiolo- gists, presented below as an overview of related projects, is definitely incomplete. However, several important features could be stressed which could in some way characterise all of the listed packages. First, many of the packages are de- signed to be incorporated into a wide software infrastructure, such as the C++, R, or Python environment. Second, the most important and costly effort, which accomplishes the develop-
ment of a package with sufficient usability, is the care taken to ensure the mutual consistency of component libraries. It is achieved either when software tools are provided as web-ser- vices (RDP (Cole et al. 2014)), or are incorporated into a sin- gle binary, with source codes which are mostly independent from auxiliary libraries (Mothur (Schloss et al. 2009)). In the QIIME project (Caporaso et al. 2010), the balance is achieved when several robust core pipelines are implemented, support- ed by specialised Python libraries and uclust software, where elaborated algorithms are incorporated into the pipelines.
This software project allows easy incorporation of additional expansions, such as sortmerna/sumaclust. Consistency of the project is supported by distribution within the anaconda pack- aging system. Just as the QIIME project effectively uses the advantages of the development within the Python environ- ment, the vegan project (Oksanen et al. 2007) uses advantag- es of the development within an R environment, with ability to use general-purpose tools from data science. And, aside from the microbiology software, two long-lasting projects for visualisation in structural bioinformatics, UCSF Chimera (Pettersen et al. 2004), and Pymol (The PyMOL molecular graphics system, 2017), use advantages of the development within a Python environment.
Since the volume of expected traffic and computational costs in the downstream analysis are relatively low, web- based tools are well-suited for implementation of the user in- terface in the interactive data presentation system. JavaScript and node.js packaging systems could be considered as an in- frastructure to implement efficient online visualisation tools.
The Biojs project (Yachdav et al. 2015) is an example of the general-purpose bioinformatics environment within the JavaScript infrastructure, similarly to projects such as biopy- thon or bioruby in Python and Ruby, respectively.
The JavaScript infrastructure attracts the attention of de- velopers aside from bioinformaticians, and the D3.js project (Bostock et al. 2011) should be considered as a universal framework for development of online applications, such as Figure 1. The growth in interest related to analysis of the microbiome, demonstrated using a chart provided by Google Trends (left) and the annual number of publications in PubMed (right).
232 Feranchuk et al.
those used for the semantic analysis and text mining (Borke and Härdle 2016), and in healthcare (Schroeder et al. 2017).
The tools provided by D3.js are comparable in efficiency with universal graphics libraries used in Python and R envi- ronments (matplotlib, ggplot2), and these libraries are often used to prepare publication-quality images in microbiology research projects.
Materials and methods Overview
The design of the D3b system was composed from sever- al parts: JavaScript-based tools for data presentation on a cli- ent side, back-end tools for data processing on the server side, and a web framework on the side of the hub server which manages user queries between the client and server sides. The instruments from the D3.js library were used to generate ex- pressive images based on the input data and the user queries defined as html-based input forms. The Python environment was chosen as an infrastructure for development of tools for data processing on the server side, and this allows us to use functionality of both the scikit-bio library with the function specific to microbial ecology, and general-purpose libraries, such as scipy and sklearn.
Since the resources which could be directed to develop- ment of the D3b package were limited, the project was not aimed to compete with packages where a lot of effort had been directed to support the consistency of the project with other packages within the infrastructure. The project is depos- ited in github in source codes as an installable package (sfer- anchuk/d3b_charts), however, the installation of the package might require additional efforts due to inconsistencies with updates and modifications introduced in the new releases of the dependencies used in the package.
Instead, the aim of this project was to satisfy the require- ments from a local community of microbiologists from the Irkutsk scientific center and related organizations; therefore, the on-line version of the project is continuously support- ed at the bri-shur.com site. The bri-shur project has a long enough history, and, by design, the web-interface in that pro- ject is separated from the servers rendering data processing (Feranchuk et al. 2012). Therefore, in the present version, the infrastructure used in a hub server is implemented within the django framework in Python. However, it is relatively inde- pendent from both sides of the system and could be easily substituted by another type of the web framework in further development or adaptation of the project.
Rendering of graphics in the JavaScript framework is im- plemented in the user browser, however, the stable and con- sistent functionality for export of graphics in raster and vector formats is obligatory for that kind of the system. Therefore, the phantomjs command-line tool was adopted to run on the server side, as a converter of dynamic html pages to PNG and SVG formats. Export of the tables generated on-line is possible using conventional functionality of the browser and,
in addition, export to the tab-delimited format is supported in some cases.
Input data for the analysis, in the form of abundance tables, can be supplied in a biom format and tab-delimited format. When the input file is submitted, access becomes available in the menu of several tools which could be used to analyze the submitted data from different viewpoints. The privacy of the data is supported by assigning a unique url with a secure 32-byte key to access a page with any of data tables.
To be able to specify any subset of rows and columns of the submitted table, two types of descriptors could be assigned on-line, and stored together with an input table. The first kind of the descriptor, in the form of tag-value pairs, allows the selection of traits associated with each of the samples in the survey. The second type of the descriptor, in the form of a list of taxonomic identifiers, allows the analysis to be focused on specific taxonomic units, rather than on the whole content of the microbiome.
The figures below illustrating the services described are based on the surveys described in (Feranchuk et al. 2018).
Namely, one of the surveys presents bacterial symbionts of marine sponges in coral reefs near an Indonesian shore, as described in (Cleary et al. 2018). The second survey presents the gut microbiome of Anser indicus (Latham, 1790) geese with different breeding patterns, as described in (Wang et al.
2016). The third survey presents the microbiome of jaw bone osteomyelitis in patients with two types of the disease, as de- scribed in (Goda et al. 2014).
Specifications
Estimates of the alpha-diversity adopted in the system are based on implementations from the scikit-bio package (Shannon, Simpson, Chao1, Ace, Fisher α, Gini). In addi- tion, an alternative estimator of the Gini measure and two parametric diversity measures, as specified in (Feranchuk et al. 2018), are included in the set of estimators. The rar- efaction analysis uses the Python code, adapted from the scikit-bio package, and the ability to estimate the Michaelis- Menthen fit to rarefaction curves is included as an alpha- diversity estimator.
A set of metrics for distances between samples include weighted and unweighted Unifrac measures, as these are implemented in the scikit-bio package, and a set of metrics, composed of Bray-Curtis similarity, Jaccard similarity, and Euclidean distance, as these are implemented in the scipy package. Measures of Pearson, Spearman, and Kendall cor- relations are transformed into distances just by subtracting values of the correlation from its maximal value: d = 2 – c.
In addition, the Morisita-Horn measure is included in the set of metrics, using a Python code, incorporated in the system.
These distances could be used to construct dendrograms of proximity between samples, to run Permanova and Anosim tests which are implemented in the scikit-bio package, and to run the principal coordinate analysis, the correspondence analysis (implemented in scikit-bio package), the principal
components analysis or the multi-dimensional scaling (im- plemented in the sklearn package).
Results Overview
Tabular presentations of the data include a table of abun- dances, as it is loaded into the system, and with various op- tions for sorting the rows, merging the columns, reducing the level of taxonomic hierarchy, and others. Similar options are available for most of the services within the interactive system, where the interactive features of the d3 library are used. Namely, most of the input forms include the option of the level of taxonomic hierarchy, the possibility to restrict the analysis or data presentation to certain taxonomic groups, and the possibility to merge samples into pre-defined groups.
The tabular presentations also include:
1) Values of the alpha-diversity calculated using several of the most informative estimators.
2) Significance of differences for alpha-diversity values between several groups, calculated following the methods, described in (Feranchuk et al. 2018).
3) Significance of differences between groups of samples, calculated using the distances between samples, with several alternative measures of distance.
The graphical presentations, implemented with the use of d3.js library, include following charts:
1) A bubble chart and a heatmap, to represent absolute/
relative abundances.
2) 2D scatter charts, to represent the results of several data ordination methods, such as PCA or multi-dimensional scaling (MDS). The choice of several measures is available here to calculate distances between the samples.
3) A dendrogram (tree) to represent the degree of proxim- ity between samples.
4) A Venn diagram to represent the unique and shared taxonomic units for the samples, implemented with the use of the jVenn (Bardou et al. 2014) plugin and venn.js library.
5) Two kinds of diagrams to present distributions which describe a sample or a group of samples: a rank-abundance chart (Whittaker plot) to represent the distribution of relative species abundance, and a rarefaction curve to estimate the ef- fect of insufficient coverage and the sample size.
6) A ternary chart, to represent the relative abundances of bacterial phylotypes for three samples or groups of samples.
7) A volcano chart and a mean-distance plot, to represent distribution of abundances and differentiation between traits.
8) Two combined 2D charts, to represent the results of PCA decomposition, applied directly to a non-square matrix of abundances. One chart is for samples in the survey and the second adjacent chart is for bacterial species in rows of the submitted matrix.
Case studies
Figure 2 illustrates the variations in microbial communi- ties for different families of marine sponges, at the class level.
The colors in Figure 2 are assigned at the level of phyla, the most general category of taxonomy. The presented result con- firms both the original study (Cleary et al. 2018) and the wid- er research where the composition of sponge microbiomes was compared (Thomas et al. 2016). In the second paper, the relative composition of microbiomes was also demonstrated in Figure 3 at the level the phyla, using the heatmap chart. In particular, the Proteobacteria phylum is the most abundant in all sponge families, which is demonstrated in from Figure 2 and in the cited paper.
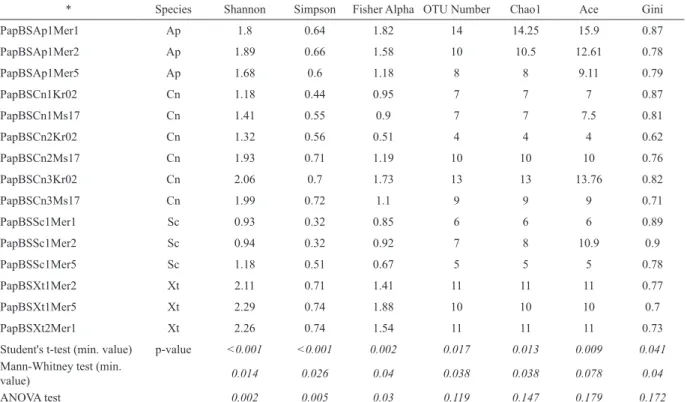
Figure 2 shows that several classes are specific to Xestospongia Laubenfels, 1932 sponge, and this is confirmed in Table 1, where the values of biodiversity are presented at the phylum level. This table was also generated using online tools, included in the described system. The significance for
Figure 2. The quantitative com- position of symbionts for three types of marine sponges at the level of bacterial phyla, present- ed as a ternary chart. Species of sponges are abbreviated as fol- lows: Xt, Xestospongia testudi- naria (Haplosclerida order); sc, Stylissa carteri (Halichondrida order); cn, Cinachyrella (Spiro- phorida order).
234 Feranchuk et al.
Table 1. For the t-test and Mann-Whitney rank-sum test, the minimum p-value, from six combinations of traits is shown. Species of sponges are abbreviated as follows: ap, Aaptos suberitoides (Suberitida order); xt, Xestospongia testudinaria (Haplosclerida order); sc, Stylissa carteri (Halichondrida order); c, Cinachyrella (Spirophorida order).
* Species Shannon Simpson Fisher Alpha OTU Number Chao1 Ace Gini
PapBSAp1Mer1 Ap 1.8 0.64 1.82 14 14.25 15.9 0.87
PapBSAp1Mer2 Ap 1.89 0.66 1.58 10 10.5 12.61 0.78
PapBSAp1Mer5 Ap 1.68 0.6 1.18 8 8 9.11 0.79
PapBSCn1Kr02 Cn 1.18 0.44 0.95 7 7 7 0.87
PapBSCn1Ms17 Cn 1.41 0.55 0.9 7 7 7.5 0.81
PapBSCn2Kr02 Cn 1.32 0.56 0.51 4 4 4 0.62
PapBSCn2Ms17 Cn 1.93 0.71 1.19 10 10 10 0.76
PapBSCn3Kr02 Cn 2.06 0.7 1.73 13 13 13.76 0.82
PapBSCn3Ms17 Cn 1.99 0.72 1.1 9 9 9 0.71
PapBSSc1Mer1 Sc 0.93 0.32 0.85 6 6 6 0.89
PapBSSc1Mer2 Sc 0.94 0.32 0.92 7 8 10.9 0.9
PapBSSc1Mer5 Sc 1.18 0.51 0.67 5 5 5 0.78
PapBSXt1Mer2 Xt 2.11 0.71 1.41 11 11 11 0.77
PapBSXt1Mer5 Xt 2.29 0.74 1.88 10 10 10 0.7
PapBSXt2Mer1 Xt 2.26 0.74 1.54 11 11 11 0.73
Student's t-test (min. value) p-value <0.001 <0.001 0.002 0.017 0.013 0.009 0.041 Mann-Whitney test (min.
value) 0.014 0.026 0.04 0.038 0.038 0.078 0.04
ANOVA test 0.002 0.005 0.03 0.119 0.147 0.179 0.172
Figure 3. The composition of the gut microbiome of Anser indicus at the level of bacterial classes, pre- sented as a bubble chart. Types of breeding are abbreviated as follows:
a, artificial breeding; w, wild type breeding; sa, semi-artificial breed- ing
separation of the samples is also shown in Table 1, using three statistical tests, applied to lists of diversity values.
Figure 3 illustrates significant differences in the composi- tion of gut microbiome of A. indicus geese, depending on the breeding pattern. In the original study (Wang et al. 2016), a result, similar to the one shown in Figure 3, was presented in Figure 4B using bar charts.
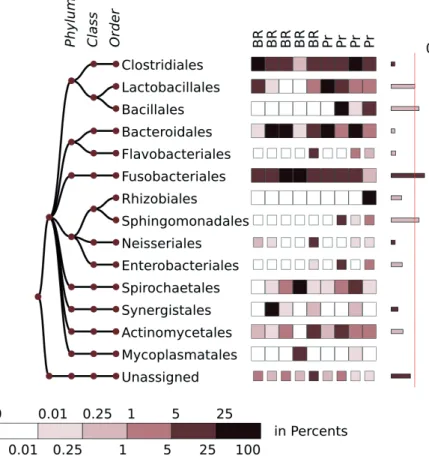
Figure 4 demonstrates composition of the microbiome in inflamed jaw bones, in an agreement with Figure 1 in the original study (Goda et al. 2014), where a similar result was presented using a bar chart. In the cited study the em- phasis was placed on a wide diversity of microbiomes in the inflamed bones, with a prevalence of anaerobic bacteria for most samples from patients with different diagnoses. The presentation in Figure 4 might also confirm this conclusion.
Although the relative presence of abundant phylotypes might vary in the different samples, no specific bacterial phylotype was specific to each of the sub-diagnoses with a sufficient confidence.
Discussion
With richness of the material and a wide spectrum of pos- sible applied results, the scientific research in microbiology becomes, to a great extent, a creative work rather than rou- tine investigation or description of the observed phenomenon within pre-defined rigorous templates. In addition, as it is common for any genre of creative work, a niche could easily be found to motivate development of any concept or idea,
even if it has an unlikely chance to generate a direct profit of any kind. The same is true for development of a software for microbiologists.
Recently, microbial ecology got to a new level of its de- velopment, due to appearance of easy and highly effective methods to study bacterial communities. Since the relation between price and quality has drastically changed in favor of researchers, the amplicon sequencing is available to almost everyone. But a qualitative analysis of data, obtained on a stage of sequencing, strongly depends on bioinformatics re- sources, which are used for an analysis. For a specialist in microbial ecology, some resources with unified algorithms are required, so that one may do a kind of creative work: to vary groups of samples in the underlying dataset, to introduce new criteria of inclusions or exclusions to groups of samples, to look up for trends and specifics in composition, structure and functions of microbial communities. At the moment, a number of software and services are available which allows to perform correct processing of amplicon libraries (RDP, Greengenes, QIIME), to run a deep comparative analysis (QIIME) or predictive analysis of functions (Picrust), but most of these services and packages require sufficient skills in bioinformatics.
An advantage of the D3b system is to provide possibil- ity for creative work even for a user with no specific training in bioinformatics. At first, it could be of interest to healthcare workers, who could rely on the data from amplicon sequenc- ing, e.g., samples of the gut microbiome, in a personalized ap- proach to plan diagnostics, prevention or treatment of diseases.
Figure 4. The composition of the microbi- ome in jaw bone osteomyelitis, presented as a heatmap chart. The 10 most abundant bacterial orders are shown. The orders present with an average abundance >2%
are highlighted. The scale of the heatmap indicates the abundance values as a per- centage. The bars on the right show the degree of separation between two groups for each of the presented phylotypes. The width of the bars is proportional to the –log(p-value) for the Mann-Whitney test.
Types of sub-diagnosis are abbreviated as follows: Pr, primary osteomyelitis; BR, bisphosphonate-related osteonecrosis of the jaw.
236 Feranchuk et al.
The system might be not sufficient or satisfactory to fit some templates which would allow it to be classified as a mature and consistent software project. It is in part a con- sequence of connection of several auxiliary libraries in one package, so that installation of the package could be unstable.
Also, as rendering of the data is implemented on the server side, the interactive functionality of D3 library is limited to pop-up tooltips and to the page with assignment of taxonomic filters.
The primary aim in development of the system was to provide a tool to prepare publication-ready images. And the system has a simple and easy-to-learn interface for grouping of data and for introduction of new criteria for analysis. In particular, the ability to assign taxonomy filtering allows to analyze target groups of bacteria in all the samples; it could arose from different taxons but compose a reference micro- flora in the gut microbiome.
The tables of variations between indices of the alpha-di- versity and distance measure provide an easy way to present the results, relying on a significance of separation between groups of samples. At the same time, the list of charts present almost a complete set of graphical presentations, developed at the moment, and allow easy ways to present both individual samples, and samples merged by certain traits.
And the presented system itself can be also described as a completed kind of creative work in a genre of software de- velopment. An expressiveness and usability – criteria used to estimate the value of a software tool – could be supported in the microbiology software in many ways, and a way provided in the D3b system, as we suppose, has a right to be considered at the same level as the most widely used brand names of similar applications.
Conflict of interest. The authors declare that there is no con- flict of interest.
Acknowledgements: The authors appreciate the contribu- tions from the specialists from NIPCHI, LIN, SIFIBR, and SFU to the development of the system, and are personally grateful to L. Mironova, A. Ponomaryova, A. Gladkikh, A.
Krasnopeev, Y. Putintseva, Y. Markova, and I. Petrushin. S.F.
and U.P. thank C.H. Brown for a long-term support of their research activity.
References
Almeida, A., A.L. Mitchell, A. Tarkowska and R.D. Finn. 2018.
Benchmarking taxonomic assignments based on 16S rRNA gene profiling of the microbiota from commonly sampled environ- ments. GigaScience 7(5):1–10.
Bardou, P., J. Mariette, F. Escudie, C. Djemiel and C. Klopp. 2014.
jvenn: an interactive Venn diagram viewer. BMC Bioinformatics 15(1):293.
Borke, L. and W. Härdle. 2016. Q3-D3-LSA, SFB 649 Discussion Paper, No. 2016-049, SFB 649, Economic Risk, Berlin.
Bostock, M., V. Ogievetsky and J. Heer. 2011. D3: data-driven docu- ments. IEEE Trans. Vis. Comput. Graph. 17(12):2301–2309.
Boughner, L.A. and P. Singh. 2016. Microbial ecology: where are we now? Postdoc. J. 4(11):3–17.
Caporaso, J.G., J. Kuczynski, J. Stombaugh, K. Bittinger, F.D.
Bushman, E.K. Costello, N. Fierer, A.G. Pena, J.K. Goodrich, J.I. Gordon, G.A. Huttley, S.T. Kelley, D. Knights, J.E. Koenig, R.E. Ley, C.A. Lozupone, D. McDonald, B.D. Muegge, M.
Pirrung, J. Reeder, J.R. Sevinsky, P.J. Turnbaugh, W.A. Walters, J. Widmann, T. Yatsunenko, J. Zaneveld and R. Knight. 2010.
QIIME allows analysis of high-throughput community sequenc- ing data. Nat. Methods 7:335–336.
Cleary, D.F.R., A.R.M. Polonia, L.E. Becking, N.J. de Voogd, P.H.
Gomes and N.C.M. Gomes. 2018. Compositional analysis of bacterial communities in seawater, sediment, and sponges in the Misool coral reef system, Indonesia. Mar. Biodiv. 48:1889.
Cole, J.R., Q. Wang, J.A. Fish, B. Chai, D.M. McGarrell, Y. Sun, C.T.
Brown, A. Porras-Alfaro, C.R. Kuske and J.M. Tiedje. 2014.
Ribosomal database project: data and tools for high throughput rRNA analysis. Nucl. Acids Res. 42:D633-D642.
Feranchuk, S., N. Belkova, U. Potapova, D. Kuzmin and S. Belikov.
2018. Evaluating the use of diversity indices to distinguish between microbial communities with different traits. Res.
Microbiol. 169:254–261.
Feranchuk, S., U. Potapova, V. Potapov, D. Mukha, V. Nikolaev and S. Belikov. 2012. Tools for protein structure prediction at the bri- shur.com web portal. J. Life Sci. 6:1074-1079.
Goda, A., F. Maruyama, Y. Michi, I. Nakagawa and K. Harada. 2014.
Analysis of the factors affecting the formation of the microbiome associated with chronic osteomyelitis of the jaw. Clin. Microbiol.
Infect. 20(5):O309–317.
Hugerth, L.W. and A.F. Andersson. 2017. Analysing microbial com- munity composition through amplicon sequencing: from sam- pling to hypothesis testing. Front. Microbiol. 8:1561.
Kopylova, E., J.A. Navas-Molina, C. Mercier, Z.Z. Xu, F. Mahe, Y.
He, H.W. Zhou, T. Rognes, J.G. Caporaso and R. Knight. 2016.
Open-source sequence clustering methods improve the state of the art. mSystems 1(1):pii:e00003-15.
McDonald, D., J.C. Clemente, J. Kuczynski, J.R. Rideout, J.
Stombaugh, D. Wendel, A. Wilke, S. Huse, J. Hufnagle, F.
Meyer, R. Knight and J.G. Caporaso. 2012. The Biological Observation Matrix (BIOM) format or: how I learned to stop worrying and love the ome-ome. GigaScience 1(1):7.
Oksanen, J., R. Kindt, P. Legendre, B. O’Hara, M.H.H. Stevens and M.J. Oksanen. 2007. The vegan package. Community ecology package. 10:631-637.
Pettersen, E.F., T.D. Goddard, C.C. Huang, G.S. Couch, D.M.
Greenblatt, E.C Meng and T.E. Ferrin. 2004. UCSF Chimera—a visualization system for exploratory research and analysis. J.
Comput. Chem. 25(13):1605–1612.
Schloss, P.D., S.L. Westcott, T. Ryabin, J.R. Hall, M. Hatmann, E.B. Hollister, R.A. Lesniewski, B.B. Oakley, D.H. Parks, C.J. Robinson, J.W. Sahl, B. Stres, G.G. Thallinger, D.J. Van Horn and C.F. Weber. 2009. Introducing Mothur: open-source, platform-independent community-supported software for de- scribing and comparing microbial communities. Appl. Environ.
Microbiol. 75:7537–7541.
Schroeder, J., J. Hoffswell, C.F. Chung, J. Fogarty, S. Munson and J. Zia. 2017. Supporting patient-provider collaboration to iden- tify individual triggers using food and symptom journals. CSCW Conf. Comput. Support Coop. Work 2017:1726–1739.
Segata, N., D. Boernigen, T.L. Tickle, X.C. Morgan, W.S. Garrett and C. Huttenhower. 2013. Computational meta’omics for microbial community studies. Mol. Syst. Biol. 9:666.
The PyMOL molecular graphics system. 2017. Version 2.0, Schrodinger LLC
Thomas, T., L. Moitinho-Silva, M. Lurgi, J.R. Bjork, C. Easson, C.
Astudillo-Garcia, J.B. Olson, P.M. Erwin, S. Lopez-Legentil, H.
Luter, A. Chaves-Fonnegra, R. Costa, P.J. Schupp, L. Steindler, D. Erpenbeck, J. Gilbert, R. Knight, G. Ackermann, J. Victor Lopez, M.W. Taylor, R.W. Thacker, J.M. Montoya, U. Hentschel and N.S. Webster. 2016. Diversity, structure and convergent evo- lution of the global sponge microbiome. Nat. Commun. 7:11870.
Wang, W., J. Cao, J.R. Li, F. Yang, Z. Li and L.X. Li. 2016.
Comparative analysis of the gastrointestinal microbial commu- nities of bar-headed goose (Anser indicus) in different breed-
ing patterns by high-throughput sequencing. Microbiol. Res.
182:59–67.
Yachdav, G., T. Goldberg, S. Wilzbach, D. Dao, I. Shih, S. Choudhary, S. Crouch, M. Franz, A. Garcia, L.J. Garcia, B.A. Gruning, D.
Inupakutika, I. Sillitoe, A.S. Thanki, B. Vieira, J.M. Villaveces, M.V. Schneider, S. Lewis, S. Pettifer, B. Rost and M. Corpas.
2015. Anatomy of BioJS, an open source community for the life sciences. Elife 8:4.
Received March 22, 2019 Revised August 23, September 16, 2019 Accepted September 22, 2019