arXiv:1810.01204v1 [astro-ph.GA] 2 Oct 2018
The loud and the quiet: searching for radio counterparts of two radio-weak BL Lac candidates with VLBI
Hong-Min Cao, 1,2⋆ S´ andor Frey, 3 Krisztina ´ E. Gab´ anyi, 3,4 Jun Yang, 5 Lang Cui, 1 Xiao-Yu Hong 6 and Tao An 6
1Xinjiang Astronomical Observatory, Chinese Academy of Sciences, 150 Science 1-Street, Urumqi, Xinjiang 830011, China
2School of Electronic and Electrical Engineering, Shangqiu Normal University, Wenhua Road 298, Shangqiu, Henan 476000, China
3Konkoly Observatory, MTA Research Centre for Astronomy and Earth Sciences, Konkoly Thege Mikl´os ´ut 15-17, H-1121 Budapest, Hungary
4MTA-ELTE Extragalactic Astrophysics Research Group, P´azm´any P´eter s´et´any 1/A, H-1117 Budapest, Hungary
5Department of Space, Earth and Environment, Chalmers University of Technology, Onsala Space Observatory, SE-43992 Onsala, Sweden
6Shanghai Astronomical Observatory, Key Laboratory of Radio Astronomy, Chinese Academy of Sciences, 80 Nandan Road, Shanghai 200030, China
Accepted 2018 XXX NN. Received 2018 XXX NN; in original form 2018 July 26
ABSTRACT
BL Lac objects are known to have compact jets inclined to our line of sight at a small angle, showing prominent radio emission. Two radio-weak BL Lac candidates with no counterparts in current radio surveys were recently reported byMassaro et al.
(2017). Both sources were selected as candidate low-energy counterparts of unassoci- ated Fermi γ-ray sources. We carried out very long baseline interferometry (VLBI) observations with the European VLBI Network (EVN) at 5 GHz to explore their radio properties at milli-arcsecond (mas) scale. One target, J1410+7405, is clearly de- tected with the EVN. Its measured 5-GHz flux density, 2.4 mJy, is consistent with recent interferometric measurements with the Karl G. Jansky Very Large Array, sug- gesting that the radio emission is confined to the inner <
∼10mas region. J1410+7405 is therefore identified as a radio-loud jetted active galactic nucleus, and its brightness temperature exceeds ∼109 K. Its properties are similar to those of other γ-ray de- tected BL Lac objects. On the other hand, the second target, J0644+6031, remains undetected with the EVN with a 6-σ brightness upper limit of 0.12 mJy beam−1. This source is thus radio-quiet, confirming its peculiarity, or possibly questioning its BL Lac nature.
Key words: galaxies: active – BL Lacertae objects: general – quasars: general – galaxies: individual: J0644+6031 – galaxies: individual: J1410+7405
1 INTRODUCTION
Blazars, a sub-class of active galactic nuclei (AGN), pro- duce prominent non-thermal emission across the entire elec- tromagnetic spectrum. This emission could even dominate over the thermal components coming from the accretion disk, the obscuring torus and the host galaxy. Blazars typi- cally exhibit flux density variability on multiple time scales, from minutes to years, and often show polarization in ra- dio and optical. All these observing characteristics are as- cribed to the twin relativistic jets closely aligned with the line of sight, launched from the AGN central engine, an ac- creting supermassive black hole. The approaching jet con-
⋆ E-mail:hongmin.cao@foxmail.com(H-MC)
tributes the most due to the Doppler-boosting effect (see Urry & Padovani 1995, for a review).
Blazars are traditionally divided into two main sub- classes: BL Lac objects and flat-spectrum radio quasars (FSRQs). The former have no or weak optical emission lines, while the latter have pronounced emission lines.
The rest-frame equivalent width (REW) of 5 ˚A is usu- ally considered as the dividing line between these two source populations (e.g. Stickel et al. 1991). The broad- bandlogνFν−logν spectral energy distributions (SEDs) of blazars show a double-hump feature which can be gener- ally explained in the context of the one-zone leptonic model (Ghisellini & Tavecchio 2009). Blazars are the dominant emitters in the γ-ray sky. Among the identified/associated Fermi sources in the third Large Area Telescope (LAT)
source catalogue (3FGL), about 57 per cent are blazars (Acero et al. 2015).
In theWide-field Infrared Survey Explorer (WISE)mid- infrared (mid-IR) color–color diagram, blazars appear to be located in a region different from those occupied by thermal sources. This is the WISE blazar strip (WBS), where the thermal emission is contaminated by the non-thermal emis- sion produced by the relativistic jet (Massaro et al. 2011).
The region of theγ-ray blazars is even narrower, and is called the WISE gamma-ray strip (WGS,D’Abrusco et al. 2012;
Massaro et al. 2012). TheWISE mid-IR colors falling into the WGS are widely considered as a piece of evidence for classifying a source as a blazar.
Very recently, Massaro et al. (2017) identified two sources, WISE J064459.38+603131.7 (hereafter J0644+6031) and WISE J141046.00+740511.2 (hereafter J1410+7405), as genuine radio-weak BL Lacs (RWBLs)1. They are particularly interesting because they have no radio counterparts at 1.4 GHz in the U.S. National Radio Astronomy Observatory (NRAO) Very Large Array (VLA) Sky Survey2 (NVSS, Condon et al. 1998). Both sources are outside the sky coverage of the VLA Faint Images of the Radio Sky at Twenty-centimeters3 survey (FIRST, White et al. 1997). Radio emission is usually seen as a representative characteristic of blazars with relativistic jets.
It is thus puzzling why these two alleged BL Lacs remained undetected in radio. Are they really silent, or do they have radio emission which is unknown just because it is below the detection limit (∼2.5mJy) of the NVSS?
We observed J0644+6031 and J1410+7405 using the technique of very long baseline interferometry (VLBI) with the European VLBI Network (EVN) at 5 GHz. These VLBI observations were sufficiently sensitive to detect compact emission if the sources are radio-loud. VLBI can provide direct proof of the blazar nature of an AGN by means of detecting milli-arcsecond (mas) scale radio emission origi- nating from the inner jet. The aim of our EVN experiment was thus confirming or ruling out that these two intriguing objects are BL Lacs.
The observed characteristics of the two targets are intro- duced in Section2. The details of the VLBI experiment and the data reduction are described in Section3. The results are presented in Section4 and discussed in Section5. A sum- mary is given in Section6. In this letter, we use a flatΛCDM model withH0=71km s−1Mpc−1,Ωm=0.27and ΩΛ=0.73 (Spergel et al. 2007) for cosmological distance estimation.
2 TARGET SOURCES
J0644+6031 was selected as a blazar candidate counterpart of 2FGL J0644.6+6034 (Massaro et al. 2013), an unassoci- ated γ-ray source (UGS) in the second FermiLAT source
1 Here the term “radio-weak” means no radio counterparts known in the current major radio surveys, thus low radio flux density.
However,Bruni et al.(2018) adopt 1.4-GHz monochromatic radio powerL1.4<1025.5W Hz−1, suggested byGregg et al.(1996) for radio-quiet AGN, to define RWBLs.
2 https://www.cv.nrao.edu/nvss/
3 http://sundog.stsci.edu/
catalogue (2FGL, Nolan et al. 2012). The nearest USNO- B (Monet et al. 2003) optical counterpart to this WISE source is just 0.′′3 away4. Follow-up optical spectroscopic observations byPaggi et al. (2014) revealed weak emission lines with REWs consistent with the threshold of 5 ˚A, sup- porting the BL Lac classification, and suggest a redshift of z=0.3582±0.0008.
J1410+7405 is coincident with one of the two X-ray sources found in the position error ellipse of an UGS 1FHL J1410.4+7408 (Landi et al. 2015), listed in the first Fermi LAT high-energy source catalogue (1FHL,Ackermann et al.
2013). Only one USNO-B optical source, 0.′′4 away from J1410+7405, is located in the error circle of the X-ray source (∼6′′ in radius, Landi et al. 2015). It has an optical spec- trum typical of BL Lacs, barely showing any emission or absorption lines and therefore prohibiting redshift determi- nation (Marchesini et al. 2016).
BothWISE sources (J0644+6031 and J1410+7405) lie in the subregion on the WGS populated by theγ-ray BL Lacs. They also show flux density variation known from their light curves built from the WISE single-epoch pho- tometric observations covering∼2days each. Moreover, the multi-band photometric data of these two sources can be well described by a log-parabolic function often used to fit the non-thermal SEDs of BL Lacs. The properties of their optical spectra, mid-IR colors and variability, and the shape of their broad-band SEDs together suggest the blazar nature of these twoWISEsources (Massaro et al. 2017).
3 OBSERVATIONS AND DATA REDUCTION 3.1 Observations
The 5-GHz EVN experiment, divided into two segments with project codes EC061A and EC061B, was conducted on 2017 October 26. There were thirteen participating antennas in both segments: Effelsberg (Ef, Germany), Jodrell Bank Mk2 (Jb, United Kingdom), Medicina (Mc, Italy), Toru´n (Tr, Poland), Westerbork (Wb, the Netherlands), Noto (Nt, Italy), Yebes (Ys, Spain), Tianma (T6, China), Urumqi (Ur, China), Svetloe (Sv, Russia), Badary (Bd, Russia), Ze- lenchukskaya (Zc, Russia), and Irbene (Ir, Latvia). For most of the antennas, the data were recorded at 2048 Mbps rate, with 2 polarizations, 8 intermediate frequency channels (IFs) per polarization, and 32 MHz bandwidth per IF. For Jb, Tr, and Wb, 4 IFs per polarization were used, with a recording rate of 1024 Mbps. The duration of each segment was about 2 h. The observations were carried out in phase-referencing mode (e.g.Beasley & Conway 1995), i.e., the antennas nod- ded between the nearby bright and compact phase calibrator and the target. The cycle time was 5-min long, with an on- target time of 3.5 min in each cycle. Short 5-min scans of bright fringe-finder sources (J1419+5423 and DA193 for seg- ments EC061A and EC061B, respectively) were also sched- uled. The recorded data from the individual stations were correlated at the Joint Institute for VLBI ERIC (JIVE) in Dwingeloo, the Netherlands, with 2 s integration time and 64 spectral channels per IF. Further observing information
4 http://vizier.u-strasbg.fr/viz-bin/VizieR-3?-source=I/284
Table 1.EVN observing information.
Project segment Target Right ascension RA err. Declination Dec err. Phase calibrator Separation
h m s mas ◦ ′ ′′ mas ◦
EC061A J1410+7405 14 10 45.9505 4.5 +74 05 10.905 4.1 J1353+7532 1.85
EC061B J0644+6031 06 44 59.3851 1.4 +60 31 31.655 1.6 J0650+6001 0.85
Notes:Cols. 3–6 – a priori equatorial coordinates (J2000) assumed for pointing to the target sources and their errors, taken from the GaiaDR1 catalogue (Gaia Collaboration 2016a,b); Col. 8 – angular separation between the target and the phase calibrator.
is given in Table 1. In this experiment, theGaiaData Re- lease 1 (DR1) coordinates5 (Gaia Collaboration 2016a,b) of the optical counterparts of the target sources were used for pointing the radio telescopes and for the correlation.
3.2 Data reduction
The VLBI data were calibrated in the NRAO Astronomi- cal Image Processing System (aips,Greisen 2003) in both segments separately, according to the EVN Data Reduction Guide6. A priori amplitude calibration was carried out us- ing the known antenna gain curves and system temperatures regularly measured at the VLBI stations during the observa- tions, or the nominal system equivalent flux densities where the system temperatures were not available. Parallactic an- gle and ionospheric corrections were then performed suc- cessively. Manual phase calibration, global fringe-fitting and bandpass calibration were also done.
The calibrated visibility data of the phase-reference and fringe-finder sources were exported to thedifmapprogram (Shepherd 1997) for hybrid mapping. The antenna-based amplitude correction factors obtained by thegscale com- mand were fed back intoaipsusing the taskclcor, to adjust the visibility amplitudes for the target sources as well. The factors lower than±5 per cent were not applied but correc- tions were typically higher. Fringe-fitting was then repeated in aips for the phase-reference calibrators, but this time their brightness distribution models produced in difmap were taken into account. This eliminates the influence of the structure that may cause residual phase errors. Finally, the solutions obtained for the reference sources were inter- polated to the targets inaips, and the phase-referenced cal- ibrated visibility data were analysed indifmap.
4 RESULTS
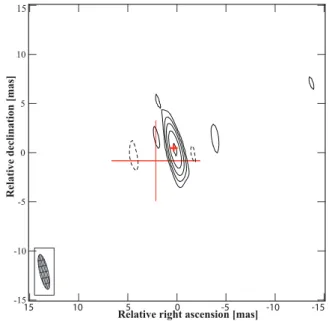
J1410+7405 is clearly detected with VLBI. A single cir- cular Gaussian model component was used to fit the source brightness distribution in the visibility domain in difmap. Due to the weakness of the source, self-calibration was not attempted. The naturally-weighted modelfit image is shown in Fig.1. VLBI phase-referencing allows us to measure the accurate J2000 coordinates of the radio brightness peak in J1410+7405. The right ascensionRA=14h10m45.s95002 and declinationDEC= +74◦05′10.′′9061were determined from the
5 https://gea.esac.esa.int/archive/
6 http://www.evlbi.org/user_guide/analysis.html
Relative declination [mas]
Relative right ascension [mas]
15 10 5 0 -5 -10 -15
15
10
5
0
-5
-10
-15
Figure 1. Phase-referenced VLBI image of J1410+7405 at 5 GHz, made with natural weighting and centred on the peak position. The first contours are drawn at±129µJy beam−1 (±5σ image noise level). The positive contours increase by a factor of 2. The peak brightness is 2.2 mJy beam−1. The Gaussian restor- ing beam with 3.6 mas×0.9 mas (FWHM) is shown in the lower left corner. The position angle of the beam major axis is 13◦, measured from north through east. The crosses denote the source optical positions taken fromGaiaDR1 (Table1) andGaiaDR2 (see the text), with their sizes indicating the uncertainties.
image using the aipstask tvmaxfit. The estimated posi- tional uncertainty of ∼ 0.2 mas is dominated by the sys- tematic error components, i.e., the positional uncertainty of the phase-reference calibrator J1353+7532, and the un- certainty caused by the target–calibrator angular separa- tion (Pradel et al. 2006). The statistical error is negligible in this case, due to the high dynamic range of the phase- referenced image. The Gaia DR1 optical position (see Ta- ble1and Fig.1) is consistent with that measured with VLBI within the errors, which strengthens the physical associa- tion of the optical and radio source. Note that the most recentGaiaDR2 (Gaia Collaboration 2018) optical position RA=14h10m45.s95006andDEC=74◦05′10.′′9063(uncertainty
∼0.3 mas, Fig.1) is also consistent with and is even closer to our VLBI position.
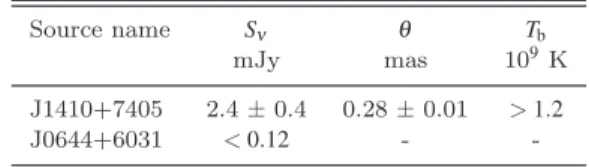
The measured parameters of J1410+7405 are listed in Table 2. The brightness temperature Tb in the source rest frame is calculated as
Tb=1.22×10121+z Sν
θ2νobs2 K (1)
Table 2.Parameters of the targets derived from the 5-GHz EVN observations.
Source name Sν θ Tb
mJy mas 109K
J1410+7405 2.4±0.4 0.28±0.01 >1.2
J0644+6031 <0.12 - -
Notes:Col. 2 – flux density; Col. 3 – circular Gaussian model component diameter (FWHM); Col. 4 – brightness temperature.
Modelfit errors are estimated according toLee et al.(2016) based on the 3-σimage noise level. For the flux density, additional 10 per cent error was considered, to account for the
VLBI amplitude calibration uncertainty.
(Condon et al. 1982), wherezis the redshift,Sν the observed flux density in Jy,θthe Gaussian component size (full width at half maximum, FWHM) in mas, andνobs the observing frequency in GHz. Since the redshift of J1410+7405 is un- known, we derived a lower limit (Tb>1.2×10⁹K) assuming z=0. This value suggests that the radio emission originates from a jet and is produced by non-thermal synchrotron radi- ation. The fitted component size (0.28±0.01 mas, Table2) is slightly smaller than the minimum resolvable size (e.g.
Kovalev et al. 2005), 0.31 mas, indicating the source is un- resolved. The latter value was used to calculate the bright- ness temperature. The strong phase coherence on one of the longest and the most sensitive Ef–T6 baseline confirms the compactness of J1410+7405.
In case of our other target,J0644+6031, we searched for compact radio emission in the naturally weighted dirty map with a field of view as large as2′′×2′′, even though the a prioriGaiaposition was accurate to mas level (Table 1).
However, nothing was detected above a signal-to-noise ratio of 6. The 6-σ brightness upper limit is 120 µJy beam−1. We conclude that any mas-scale compact radio source in J0644+6031 should be weaker than 0.12 mJy (Table2).
We repeated the analysis to constrain the VLBI network to relatively shorter baselines by removing data from T6, Ur and Bd, to become more sensitive to∼10mas scale ex- tended radio emission. For J1410+7405, one circular Gaus- sian component fitting gave a flux density of2.5±0.5mJy, consistently with that measured with the full VLBI array (Table2), which is another support for the source compact- ness. However, no radio source was found for J0644+6031.
5 DISCUSSION
Among the Fermiγ-ray sources, a large fraction still have no known counterparts in other electromagnetic wavebands.
For example, in 3FGL, about 30 per cent remain to be identi- fied/associated (Acero et al. 2015). Finding their low-energy counterparts is essential to reveal the physical origin of the γ-ray emission, and thus to better understand the wholeγ- ray sky. Considering that a large percentage of the associ- atedFermisources are blazars, if there is a blazar discovered within the positional error ellipse (normally at 95 per cent confidence level) of an UGS, then this blazar would be the most likely object where theγ-rays come from.
The compact radio emission detected with VLBI proves the existence of jet activity in J1410+7405. This
mid-IR source is positionally coincident with UGS 1FHL J1410.4+7408 (a.k.a. UGS 3FGL J1410.9+7406,Landi et al.
2015; Massaro et al. 2017). Based on the multi-band data available so far, J1410+7405 is the most promising γ-ray emitter in theFermierror ellipse.
This source is also detected with the Karl G. Jansky VLA at 5 GHz (2.2±0.1mJy) and 7 GHz (2.0±0.1mJy), in a large observing project carried out very recently, aim- ing to search for radio counterparts of all UGSs in 3FGL (Schinzel et al. 2017). The deduced flat spectrum with spec- tral index α =−0.28±0.28 is consistent with a compact synchrotron self-absorbed radio source (the spectral in- dex is defined asSν ∝να). Our 5-GHz VLBI flux density (2.4±0.4mJy) is identical within the errors with that mea- sured by the VLA, suggesting that the radio emission es- sentially comes from a small mas-scale region probed by the EVN. In addition, the accurate match of the source posi- tions measured with VLBI and Gaia, and the high com- pactness (the ratio of the VLBI and VLA flux densities close to 1) imply that the jet is oriented at a small viewing an- gle (e.g.Liuzzo et al. 2013). However, the VLA experiment (Schinzel et al. 2017) was carried out more than 2 years be- fore our EVN observations. We therefore cannot rule out flux density variability in J1410+7405 which is typical for compact blazars.
The relative strength of AGN jet activity could be char- acterised with the radio-loudness parameterR=SrSo. Here, Sr andSo denote the observed flux densities at 5 GHz and 4400 ˚A, respectively (Kellermann et al. 1989). Alternatively, the rest-frame flux density (Sν,rest∝ ν
α
1+z1+α) is also used to calculate the radio loudness (e.g. Wu et al. 2013). As the redshift (for J1410+7405) and the optical spectral indices (for both targets) are not known, we used the classical def- inition of radio loudness (Kellermann et al. 1989) with ob- served flux densities, but this will not change our conclu- sions. AGN are traditionally classified as radio-quiet ifR<10 and radio-loud ifR≥10. Known from the USNO-A2.0 cat- alogue7 (Monet et al. 1998), the optical B-band magnitude of J1410+7405 is 19.2. This, together with the 5-GHz ra- dio flux density, givesR≈40, indicating that J1410+7405 is radio-loud.
Taking the median redshift value of 1FHL BL Lac ob- jects, i.e.,z=0.2(Lico et al. 2016), we estimate the 1.4-GHz monochromatic radio powerL1.4=3.1±0.3×10²³W Hz−1for J1410+7405. This value is compatible with the RWBL defi- nition adopted byBruni et al.(2018). However, if the source is atz>
∼1.7, its powerL1.4≥1025.5 W Hz−1would classify it as radio-loud according toGregg et al.(1996), consistently with our radio-loudness estimation by theKellermann et al.
(1989) criterion.
The jet Doppler factor δ can be inferred from a single-epoch VLBI observation, i.e. δ=TbTeq, where Teq≈ 5×10¹⁰ K is the equipartition brightness temperature (Readhead 1994). A Doppler factor larger than unity would indicate Doppler-boosted emission and is often used as an important criterion for classifying a source as a blazar (e.g.
Coppejans et al. 2016). The measured brightness tempera- ture of J1410+7405 (Tb>1.2×10⁹ K) is only a lower limit and thus the Doppler factor isδ>
∼0.02. Even if a non-zero
7 http://vizier.u-strasbg.fr/viz-bin/VizieR-3?-source=I/252
redshift is assumed in Eq.1, the low limit of the core bright- ness temperature does not usefully constrain the Doppler factor in our case, leaving the question open whether the jet emission in J1410+7405 is not boosted or simply the angu- lar resolution is insufficient to measureδ>
∼1. The core can be blended with a more extended jet component, resulting in an overestimated angular size and thus an underestima- tion of the source brightness temperature (Natarajan et al.
2017).
Theγ-ray blazars in theRoma-BZCAT8(Massaro et al.
2015) show a bimodal feature in the distribution of the log- arithmic flux density ratio between 1.4 GHz in the radio and 3.4µm in mid-IR (see Fig. 10 inMassaro et al. 2017).
The available radio data of J1410+7405 allow us to calcu- latelogS1.4GHzS3.4µm=1.0, which is different from the value below 0.5 as expected byMassaro et al.(2017), and places the source to the region whereγ-ray BL Lacs populate the distribution.
Our second VLBI target, J0644+6031, is positionally consistent with UGS 2FGL J0644.6+6034, but lies outside the 95 per cent confidence positional error ellipse of UGS 3FGL J0644.6+6035, which has a somewhat more accurate position (see Fig. 8 inMassaro et al. 2017). Thus its physical association with theγ-ray source is rather uncertain. How- ever, not all known blazars appear detected byFermiLAT (Lister et al. 2015). Our 5-GHz flux density upper limit (120 µJy; Table2) for the mas-scale compact radio emission and the optical B-band magnitude (USNO(B)=19,Monet et al.
1998) provide a stringent upper limit ofR<
∼1.5for the radio loudness of J0644+6031. Assuming spectral indexα=0, we obtainL1.4<3.8×10²²W Hz−1andlogS1.4GHzS3.4µm<−0.86 for J0644+6031. The radio non-detection itself and the radio quietness confirm the unusual characteristics of J0644+6031 as a BL Lac object suggested by Massaro et al. (2017).
From our EVN data, there is no evidence for a radio jet in this source. However, it is also possible that the BL Lac identification of J0644+6031 is questionable. In this case, the BL Lac-type characteristics in wavebands other than the radio would call for alternative explanations. Indeed, J0644+6031 has a noisier optical spectrum than J1410+7405 (Paggi et al. 2014;Marchesini et al. 2016). A spectrum like this could be caused by the intrinsically weak broad emission lines, rather than those swamped by the continuum emission from the relativistic jet (Plotkin et al. 2010). Based on the data currently available, the nature of J0644+6031 remains elusive, and further efforts are required to draw a final con- clusion.
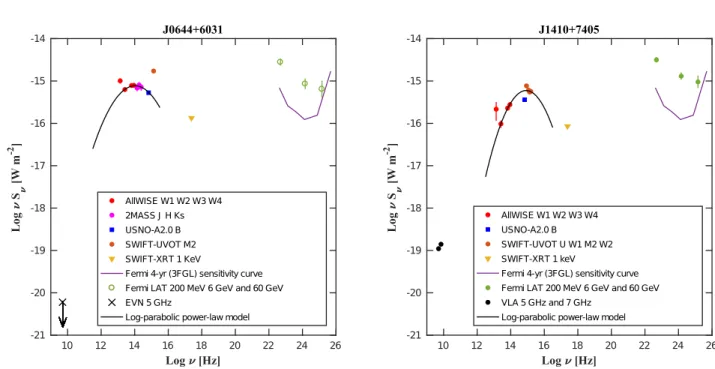
The broadband SEDs of the radio source J1410+7405 and the radio-undetected J0644+6031 are shown in Fig.2.
We calculated the WISE, 2MASS, and Swift UVOT/XRT fluxes following Massaro et al. (2017). The USNO-A2.0 B magnitude was first transformed to the Landolt magnitude9 and then corrected with the Galactic extinction accord- ing to Schlafly & Finkbeiner (2011). The γ-ray fluxes and the Fermi4-year sensitivity curves were obtained with the web-based tool provided by the ASI Science Data Center (ASDC)10. The synchrotron peak frequencies derived from
8 http://www.asdc.asi.it/bzcat/
9 http://www.quasars.org/docs/USNO_Landolt.htm
10 https://tools.ssdc.asi.it/
the log-parabolic fit (see Fig. 2) are 8.2±2.2×10¹⁴ Hz and 1.0±0.3×10¹⁴ Hz for J1410+7405 and J0644+6031, respectively. Thus, regarding the blazar classification by Abdo et al. (2010), the former source should belong to the intermediate-synchrotron peaked (ISP) BL Lacs, while J0644+6031, if indeed a BL Lac, would be around the divid- ing line between the ISP and low-synchrotron peaked (LSP) objects.
6 SUMMARY AND CONCLUSIONS
We observed with the EVN two radio-weak BL Lac can- didates, proposed as counterparts of unidentified Fermiγ- ray sources (Massaro et al. 2017). Our 5-GHz observations capable of mas-scale angular resolution did not detect any compact radio source at the position of J0644+6031. The inferred small value of radio-loudness parameterR<
∼1.5con- firms the peculiarity of this object found byMassaro et al.
(2017). It might either be a true RWBL or its BL Lac identi- fication should be revised since this class of objects is known to show synchrotron radio emission from relativistic jets closely aligned to the line of sight. Both the BL Lac na- ture of J0644+6031 and its association with aFermisource would require further supporting evidence.
On the other hand, compact radio emission from the source J1410+7405 is detected with VLBI. The measured brightness temperature of the 2.4-mJy component is in the order of109 K, not sufficient to prove that the jet emission is Doppler-boosted. Nevertheless, its properties are similar to those of other known 1FHL BL Lac objects. The radio loudness of the source is R≈40. The case of J1410+7405 demonstrates that the lack of detection in a relatively shal- low radio survey like the NVSS does not necessarily preclude the existence of mas-scale compact radio emission in a radio- loud (jetted) AGN.
ACKNOWLEDGEMENTS
We thank the anonymous referee for valuable suggestions.
The European VLBI Network is a joint facility of inde- pendent European, African, Asian, and North American radio astronomy institutes. Scientific results from data presented in this publication are derived from the fol- lowing EVN project code: EC061. H-MC acknowledges support by the CAS “Light of West China” programme (Grants No. 2016-QNXZ-B-21 & YBXM-2014-02) and the National Natural Science Foundation of China (Grants No. U1731103, 11573016 and 11503072). SF and K´EG thank the Hungarian National Research, Development and Innovation Office (OTKA NN110333) for support. K´EG was supported by the J´anos Bolyai Research Scholarship of the Hungarian Academy of Sciences. This work has made use of data from the European Space Agency (ESA) mission Gaia (https://www.cosmos.esa.int/gaia), processed by theGaiaData Processing and Analysis Consortium (DPAC, https://www.cosmos.esa.int/web/gaia/dpac/consortium).
Funding for the DPAC has been provided by national insti- tutions, in particular the institutions participating in the GaiaMultilateral Agreement.
10 12 14 16 18 20 22 24 26 Log [Hz]
-21 -20 -19 -18 -17 -16 -15 -14
Log S[W m-2 ]
J0644+6031
AllWISE W1 W2 W3 W4 2MASS J H Ks USNO-A2.0 B SWIFT-UVOT M2 SWIFT-XRT 1 KeV
Fermi 4-yr (3FGL) sensitivity curve Fermi LAT 200 MeV 6 GeV and 60 GeV EVN 5 GHz
Log-parabolic power-law model
10 12 14 16 18 20 22 24 26
Log [Hz]
-21 -20 -19 -18 -17 -16 -15 -14
LogS[Wm-2 ]
J1410+7405
AllWISE W1 W2 W3 W4 USNO-A2.0 B
SWIFT-UVOT U W1 M2 W2 SWIFT-XRT 1 keV
Fermi 4-yr (3FGL) sensitivity curve Fermi LAT 200 MeV 6 GeV and 60 GeV VLA 5 GHz and 7 GHz
Log-parabolic power-law model
Figure 2.The broadband SEDs of the two EVN targets J0644+6031 (left panel) and J1410+7405 (right panel). As J0644+6031 is not detected with the EVN, the 5-GHz flux upper limit (marked with×) is shown in the left panel. Threeγ-ray data points are plotted to illustrate theFermidetection. Since the association of J0644+6031 with theFermiγ-ray source is uncertain, being outside the 95 per cent confidence positional error ellipse of 3FGL J0644.6+6035 (Massaro et al. 2017), theγ-ray data points are marked with open circles.
TheFermi4-yr sensitivity curves, based on 3FGL, correspond to a Test Statistic (TS) of 2.
REFERENCES
Abdo A. A., et al., 2010, ApJ, 708, 1310 Acero F. et al., 2015, ApJS, 218, 23 Ackermann M. et al., 2013, ApJS, 209, 34
Beasley A. J., Conway J. E., 1995, in Zensus J. A., Diamond P. J., Napier P. J., eds, ASP Conf. Ser. Vol. 82., Very Long Baseline Interferometry and the VLBA. Astron. Soc. Pac., San Francisco, p. 327
Bruni G. et al., 2018, ApJ, 854, L23
Condon J. J., Condon M. A., Gisler G., Puschell J. J., 1982, ApJ, 252, 102
Condon J. J., Cotton W. D., Greisen E. W., Yin Q. F., Perley R. A., Taylor G. B., Broderick J. J., 1998, AJ, 115, 1693 Coppejans R. et al, 2016, MNRAS, 463, 3260
D’Abrusco R., Massaro F., Ajello M., Grindlay J. E., Smith H. A., Tosti G., 2012, ApJ, 748, 68
Gaia Collaboration, 2016a, A&A, 595, A1 Gaia Collaboration, 2016b, A&A, 595, A2
Gaia Collaboration, 2018, A&A, in press (arXiv:1804.09365) Ghisellini G., Tavecchio F., 2009, MNRAS, 397, 985
Gregg M. D., Becker R. H., White R. L., Helfand D. J., McMahon R. G., Hook I. M., 1996, AJ, 112, 407
Greisen E. W., 2003, in Heck A., ed, Astrophysics and Space Science Library Vol. 285, Information Handling in Astronomy – Historical Vistas. Kluwer, Dordrecht, p. 109
Kellermann K. I., Sramek R., Schmidt M., Shaffer D. B., Green R., 1989, AJ, 98, 1195
Kovalev Y. Y. et al., 2005, AJ, 130, 2473
Landi R., Bassani L., Stephen J. B., Masetti N., Malizia A., and Ubertini P., 2015, A&A, 581, A57
Lee S.-S. et al., 2016, ApJS, 227, 8
Lico R., Giroletti M., Orienti M., D’Ammando F., 2016, A&A, 594, A60
Liuzzo E., et al., 2013, A&A, 560, A23
Lister M. L., Aller M. F., Aller H. D., Hovatta T., Max-Moerbeck W., Readhead A. C. S., Richards J. L., Ros E., 2015, ApJ,
810, L9
Marchesini E. J. et al., 2016, A&A, 596, A10
Massaro F., D’Abrusco R., Ajello M., Grindlay J. E., Smith H. A., 2011, ApJ, 740, L48
Massaro F., D’Abrusco R., Tosti G., Ajello M., Gasparrini D., Grindlay J. E., Smith H. A., 2012, ApJ, 750, 138
Massaro F., D’Abrusco R., Paggi A., Masetti N., Giroletti M., Tosti G., Smith H. A., Funk S., 2013, ApJS, 206, 13 Massaro E., Maselli A., Leto C., Marchegiani P., Perri M.,
Giommi P., Piranomonte S., 2015, Ap&SS, 357, 75
Massaro F., Marchesini E. J., D’Abrusco R., Masetti N., Andru- chow I., Smith H. A., 2017, ApJ, 834, 113
Monet D. G., et al. 1998, USNO-A2.0 catalog, US Naval Obs., Flagstaff
Monet D. G., et al., 2003, AJ, 125, 984
Natarajan I., Paragi Z., Zwart J., Perkins S., Smirnov O., van der Heyden K., 2017, MNRAS, 464, 4306
Nolan P. L. et al., 2012, ApJS, 199, 31 Paggi A. et al., 2014, AJ, 147, 112
Pradel N., Charlot P., Lestrade J. F., 2006, A&A, 452, 1099 Plotkin R. M. et al., 2010, AJ, 139, 390
Readhead A. C. S., 1994, ApJ, 426, 51
Schinzel F. K., Petrov L., Taylor G. B., Edwards P. G., 2017, ApJ, 838, 139
Schlafly E. F., Finkbeiner D. P., 2011, ApJ, 737, 103
Shepherd M. C., 1997, in Hunt G., Payne H. E., eds, ASP Conf.
Ser. Vol. 125, Astronomical Data Analysis Software and Sys- tems VI. Astron. Soc. Pac., San Francisco, p. 77
Spergel D. N. et al., 2007, ApJS, 170, 377
Stickel M., Padovani P., Urry C. M., Fried J. W., K¨uhr H., 1991, ApJ, 374, 431
Urry C. M., Padovani P., 1995, PASP, 107, 803
Wu J.-F., Brandt W. N., Miller B. P., Garmire G. P., Schneider D. P., Vignali C., 2013, ApJ, 763, 109
White R. L., Becker R. H., Helfand D. J., Gregg M. D., 1997, ApJ, 475, 479