Astronomy &
Astrophysics Special issue
https://doi.org/10.1051/0004-6361/201833051
© ESO 2018
Gaia Data Release 2
Gaia Data Release 2
Summary of the contents and survey properties
Gaia Collaboration, A. G. A. Brown
1,?, A. Vallenari
2, T. Prusti
3, J. H. J. de Bruijne
3, C. Babusiaux
4,5, C. A. L. Bailer-Jones
6, M. Biermann
7, D. W. Evans
8, L. Eyer
9, F. Jansen
10, C. Jordi
11, S. A. Klioner
12, U. Lammers
13, L. Lindegren
14, X. Luri
11, F. Mignard
15, C. Panem
16, D. Pourbaix
17,18, S. Randich
19, P. Sartoretti
4,
H. I. Siddiqui
20, C. Soubiran
21, F. van Leeuwen
8, N. A. Walton
8, F. Arenou
4, U. Bastian
7, M. Cropper
22, R. Drimmel
23, D. Katz
4, M. G. Lattanzi
23, J. Bakker
13, C. Cacciari
24, J. Castañeda
11, L. Chaoul
16, N. Cheek
25,
F. De Angeli
8, C. Fabricius
11, R. Guerra
13, B. Holl
9, E. Masana
11, R. Messineo
26, N. Mowlavi
9, K. Nienartowicz
27, P. Panuzzo
4, J. Portell
11, M. Riello
8, G. M. Seabroke
22, P. Tanga
15, F. Thévenin
15, G. Gracia-Abril
28,7, G. Comoretto
20, M. Garcia-Reinaldos
13, D. Teyssier
20, M. Altmann
7,29, R. Andrae
6, M. Audard
9, I. Bellas-Velidis
30, K. Benson
22, J. Berthier
31, R. Blomme
32, P. Burgess
8, G. Busso
8, B. Carry
15,31,
A. Cellino
23, G. Clementini
24, M. Clotet
11, O. Creevey
15,33, M. Davidson
34, J. De Ridder
35, L. Delchambre
36, A. Dell’Oro
19, C. Ducourant
21, J. Fernández-Hernández
37, M. Fouesneau
6, Y. Frémat
32, L. Galluccio
15,
M. García-Torres
38, J. González-Núñez
25,39, J. J. González-Vidal
11, E. Gosset
36,18, L. P. Guy
27,40, J.-L. Halbwachs
41, N. C. Hambly
34, D. L. Harrison
8,42, J. Hernández
13, D. Hestroffer
31, S. T. Hodgkin
8,
A. Hutton
43, G. Jasniewicz
44, A. Jean-Antoine-Piccolo
16, S. Jordan
7, A. J. Korn
45, A. Krone-Martins
46, A. C. Lanzafame
47,48, T. Lebzelter
49, W. Löffler
7, M. Manteiga
50,51, P. M. Marrese
52,53, J. M. Martín-Fleitas
43,
A. Moitinho
46, A. Mora
43, K. Muinonen
54,55, J. Osinde
56, E. Pancino
19,53, T. Pauwels
32, J.-M. Petit
57, A. Recio-Blanco
15, P. J. Richards
58, L. Rimoldini
27, A. C. Robin
57, L. M. Sarro
59, C. Siopis
17, M. Smith
22,
A. Sozzetti
23, M. Süveges
6, J. Torra
11, W. van Reeven
43, U. Abbas
23, A. Abreu Aramburu
60, S. Accart
61, C. Aerts
35,62, G. Altavilla
52,53,24, M. A. Álvarez
50, R. Alvarez
13, J. Alves
49, R. I. Anderson
63,9, A. H. Andrei
64,65,29, E. Anglada Varela
37, E. Antiche
11, T. Antoja
3,11, B. Arcay
50, T. L. Astraatmadja
6,66, N. Bach
43, S. G. Baker
22, L. Balaguer-Núñez
11, P. Balm
20, C. Barache
29, C. Barata
46, D. Barbato
67,23, F. Barblan
9,
P. S. Barklem
45, D. Barrado
68, M. Barros
46, M. A. Barstow
69, S. Bartholomé Muñoz
11, J.-L. Bassilana
61, U. Becciani
48, M. Bellazzini
24, A. Berihuete
70, S. Bertone
23,29,71, L. Bianchi
72, O. Bienaymé
41,
S. Blanco-Cuaresma
9,21,73, T. Boch
41, C. Boeche
2, A. Bombrun
74, R. Borrachero
11, D. Bossini
2, S. Bouquillon
29, G. Bourda
21, A. Bragaglia
24, L. Bramante
26, M. A. Breddels
75, A. Bressan
76, N. Brouillet
21, T. Brüsemeister
7,
E. Brugaletta
48, B. Bucciarelli
23, A. Burlacu
16, D. Busonero
23, A. G. Butkevich
12, R. Buzzi
23, E. Caffau
4, R. Cancelliere
77, G. Cannizzaro
78,62, T. Cantat-Gaudin
2,11, R. Carballo
79, T. Carlucci
29, J. M. Carrasco
11, L. Casamiquela
11, M. Castellani
52, A. Castro-Ginard
11, P. Charlot
21, L. Chemin
80, A. Chiavassa
15, G. Cocozza
24,
G. Costigan
1, S. Cowell
8, F. Crifo
4, M. Crosta
23, C. Crowley
74, J. Cuypers
†32, C. Dafonte
50, Y. Damerdji
36,81, A. Dapergolas
30, P. David
31, M. David
82, P. de Laverny
15, F. De Luise
83, R. De March
26, D. de Martino
84, R. de Souza
85, A. de Torres
74, J. Debosscher
35, E. del Pozo
43, M. Delbo
15, A. Delgado
8, H. E. Delgado
59, P. Di Matteo
4, S. Diakite
57, C. Diener
8, E. Distefano
48, C. Dolding
22, P. Drazinos
86, J. Durán
56, B. Edvardsson
45,
H. Enke
87, K. Eriksson
45, P. Esquej
88, G. Eynard Bontemps
16, C. Fabre
89, M. Fabrizio
52,53, S. Faigler
90, A. J. Falcão
91, M. Farràs Casas
11, L. Federici
24, G. Fedorets
54, P. Fernique
41, F. Figueras
11, F. Filippi
26, K. Findeisen
4, A. Fonti
26, E. Fraile
88, M. Fraser
8,92, B. Frézouls
16, M. Gai
23, S. Galleti
24, D. Garabato
50, F. García-Sedano
59, A. Garofalo
93,24, N. Garralda
11, A. Gavel
45, P. Gavras
4,30,86, J. Gerssen
87, R. Geyer
12,
P. Giacobbe
23, G. Gilmore
8, S. Girona
94, G. Giuffrida
53,52, F. Glass
9, M. Gomes
46, M. Granvik
54,95, A. Gueguen
4,96, A. Guerrier
61, J. Guiraud
16, R. Gutiérrez-Sánchez
20, R. Haigron
4, D. Hatzidimitriou
86,30,
M. Hauser
7,6, M. Haywood
4, U. Heiter
45, A. Helmi
75, J. Heu
4, T. Hilger
12, D. Hobbs
14, W. Hofmann
7, G. Holland
8, H. E. Huckle
22, A. Hypki
1,97, V. Icardi
26, K. Janßen
87, G. Jevardat de Fombelle
27, P. G. Jonker
78,62,
Á. L. Juhász
98,99, F. Julbe
11, A. Karampelas
86,100, A. Kewley
8, J. Klar
87, A. Kochoska
101,102?Corresponding author: A. G. A. Brown, e-mail:brown@strw.leidenuniv.nl
R. Kohley
13, K. Kolenberg
103,35,73, M. Kontizas
86, E. Kontizas
30, S. E. Koposov
8,104, G. Kordopatis
15, Z. Kostrzewa-Rutkowska
78,62, P. Koubsky
105, S. Lambert
29, A. F. Lanza
48, Y. Lasne
61, J.-B. Lavigne
61, Y. Le Fustec
106, C. Le Poncin-Lafitte
29, Y. Lebreton
4,107, S. Leccia
84, N. Leclerc
4, I. Lecoeur-Taibi
27, H. Lenhardt
7,
F. Leroux
61, S. Liao
23,108,109, E. Licata
72, H. E. P. Lindstrøm
110,111, T. A. Lister
112, E. Livanou
86, A. Lobel
32, M. López
68, S. Managau
61, R. G. Mann
34, G. Mantelet
7, O. Marchal
4, J. M. Marchant
113, M. Marconi
84, S. Marinoni
52,53, G. Marschalkó
98,114, D. J. Marshall
115, M. Martino
26, G. Marton
98, N. Mary
61, D. Massari
75,
G. Matijeviˇc
87, T. Mazeh
90, P. J. McMillan
14, S. Messina
48, D. Michalik
14, N. R. Millar
8, D. Molina
11, R. Molinaro
84, L. Molnár
98, P. Montegriffo
24, R. Mor
11, R. Morbidelli
23, T. Morel
36, D. Morris
34, A. F. Mulone
26,
T. Muraveva
24, I. Musella
84, G. Nelemans
62,35, L. Nicastro
24, L. Noval
6, W. O’Mullane
13,40, C. Ordénovic
15, D. Ordóñez-Blanco
27, P. Osborne
8, C. Pagani
69, I. Pagano
48, F. Pailler
16, H. Palacin
61, L. Palaversa
8,9, A. Panahi
90, M. Pawlak
116,117, A. M. Piersimoni
83, F.-X. Pineau
41, E. Plachy
98, G. Plum
4, E. Poggio
67,23,
E. Poujoulet
118, A. Prša
102, L. Pulone
52, E. Racero
25, S. Ragaini
24, N. Rambaux
31, M. Ramos-Lerate
119, S. Regibo
35, C. Reylé
57, F. Riclet
16, V. Ripepi
84, A. Riva
23, A. Rivard
61, G. Rixon
8, T. Roegiers
120, M. Roelens
9, M. Romero-Gómez
11, N. Rowell
34, F. Royer
4, L. Ruiz-Dern
4, G. Sadowski
17, T. Sagristà Sellés
7, J. Sahlmann
13,121,
J. Salgado
122, E. Salguero
37, N. Sanna
19, T. Santana-Ros
97, M. Sarasso
23, H. Savietto
123, M. Schultheis
15, E. Sciacca
48, M. Segol
124, J. C. Segovia
25, D. Ségransan
9, I-C. Shih
4, L. Siltala
54,125, A. F. Silva
46, R. L. Smart
23,
K. W. Smith
6, E. Solano
68,126, F. Solitro
26, R. Sordo
2, S. Soria Nieto
11, J. Souchay
29, A. Spagna
23, F. Spoto
15,31, U. Stampa
7, I. A. Steele
113, H. Steidelmüller
12, C. A. Stephenson
20, H. Stoev
127, F. F. Suess
8, J. Surdej
36, L. Szabados
98, E. Szegedi-Elek
98, D. Tapiador
128,129, F. Taris
29, G. Tauran
61, M. B. Taylor
130, R. Teixeira
85, D. Terrett
58, P. Teyssandier
29, W. Thuillot
31, A. Titarenko
15, F. Torra Clotet
131, C. Turon
4, A. Ulla
132, E. Utrilla
43,
S. Uzzi
26, M. Vaillant
61, G. Valentini
83, V. Valette
16, A. van Elteren
1, E. Van Hemelryck
32, M. van Leeuwen
8, M. Vaschetto
26, A. Vecchiato
23, J. Veljanoski
75, Y. Viala
4, D. Vicente
94, S. Vogt
120, C. von Essen
133, H. Voss
11,
V. Votruba
105, S. Voutsinas
34, G. Walmsley
16, M. Weiler
11, O. Wertz
134, T. Wevers
8,62, Ł. Wyrzykowski
8,116, A. Yoldas
8, M. Žerjal
101,135, H. Ziaeepour
57, J. Zorec
136, S. Zschocke
12, S. Zucker
137, C. Zurbach
44, T. Zwitter
101(Affiliations can be found after the references)
Received 19 March 2018 / Accepted 14 April 2018 ABSTRACT
Context. We present the secondGaiadata release,GaiaDR2, consisting of astrometry, photometry, radial velocities, and information on astrophysical parameters and variability, for sources brighter than magnitude 21. In addition epoch astrometry and photometry are provided for a modest sample of minor planets in the solar system.
Aims. A summary of the contents ofGaiaDR2 is presented, accompanied by a discussion on the differences with respect toGaiaDR1 and an overview of the main limitations which are still present in the survey. Recommendations are made on the responsible use of GaiaDR2 results.
Methods. The raw data collected with theGaiainstruments during the first 22 months of the mission have been processed by theGaia Data Processing and Analysis Consortium (DPAC) and turned into this second data release, which represents a major advance with respect toGaiaDR1 in terms of completeness, performance, and richness of the data products.
Results. GaiaDR2 contains celestial positions and the apparent brightness inGfor approximately 1.7 billion sources. For 1.3 billion of those sources, parallaxes and proper motions are in addition available. The sample of sources for which variability information is provided is expanded to 0.5 million stars. This data release contains four new elements: broad-band colour information in the form of the apparent brightness in theGBP(330–680 nm) andGRP(630–1050 nm) bands is available for 1.4 billion sources; median radial velocities for some 7 million sources are presented; for between 77 and 161 million sources estimates are provided of the stellar effective temperature, extinction, reddening, and radius and luminosity; and for a pre-selected list of 14 000 minor planets in the solar system epoch astrometry and photometry are presented. Finally,GaiaDR2 also represents a new materialisation of the celestial reference frame in the optical, theGaia-CRF2, which is the first optical reference frame based solely on extragalactic sources. There are notable changes in the photometric system and the catalogue source list with respect toGaiaDR1, and we stress the need to consider the two data releases as independent.
Conclusions. GaiaDR2 represents a major achievement for theGaiamission, delivering on the long standing promise to provide parallaxes and proper motions for over 1 billion stars, and representing a first step in the availability of complementary radial velocity and source astrophysical information for a sample of stars in theGaiasurvey which covers a very substantial fraction of the volume of our galaxy.
Key words. catalogs – astrometry – techniques: radial velocities – stars: fundamental parameters – stars: variables: general – minor planets, asteroids: general
1. Introduction
We present the second intermediate Gaia data release (Gaia Data Release 2,GaiaDR2), which is based on the data collected during the first 22 months of the nominal mission lifetime (sci- entific data collection started in July 2014 and nominally lasts 60 months, seeGaia Collaboration 2016b).GaiaDR2 represents the planned major advance with respect to the first intermedi- ate Gaia data release (Gaia DR1, Gaia Collaboration 2016a), making the leap to a high-precision parallax and proper motion catalogue for over 1 billion sources, supplemented by precise and homogeneous multi-band all-sky photometry and a large radial velocity survey at the bright (G . 13) end. The avail- ability of precise fundamental astrophysical information required to map and understand the Milky Way is thus expanded to a very substantial fraction of the volume of our galaxy, well beyond the immediate solar neighbourhood. The data diver- sity of Gaia DR2 is also significantly enhanced with respect toGaiaDR1 through the availability of astrophysical parame- ters for a large sample of stars, the significant increase in the number and types of variable stars and their light curves, and the addition for the first time of solar system astrometry and photometry. This paper is structured as follows. In Sect. 2 we provide a short overview of the improvements and additions to the data processing that led to the production ofGaiaDR2. We summarise the contents of the second data release in Sect. 3 and illustrate the quality of this release through all-sky maps of source counts and colours in Sect.4. In Sect.5we discuss the major differences betweenGaiaDR2 andGaiaDR1, in partic- ular pointing out the evolution of the source list and the need to always qualifyGaia source identifiers with the data release they refer to. The two releases should be treated as entirely inde- pendent catalogues. The known limitations of the secondGaia data release are presented in Sect. 6 and additional guidance on the use of the data is provided in Sect. 7. In Sect. 8 we provide updates to the Gaia data access facilities and documentation available to the astronomical community. We conclude with a look ahead at the next release in Sect. 9.
Throughout the paper we make reference to other DPAC papers that provide more details on the data processing and validation forGaiaDR2. All these papers (together with the present article) can be found in the Astronomy & Astrophysics Special edition onGaiaDR2.
2. Data processing forGaiaDR2
To provide the context for the description of the data release contents in the next section, we provide here a summary of the input measurements used and the main additions and improve- ments implemented in the data processing for GaiaDR2. We recall that Gaiameasurements are collected with three instru- ments. The astrometric instrument collects images in Gaia’s white-lightG-band (330–1050 nm); the Blue (BP) and Red (RP) prism photometers collect low resolution spectrophotometric measurements of source spectral energy distributions over the wavelength ranges 330–680 nm and 630–1050 nm, respectively;
and the radial velocity spectrometer (RVS) collects medium resolution (R ∼ 11 700) spectra over the wavelength range 845–872 nm centred on the Calcium triplet region. For more details on theGaia instruments and measurements we refer to Gaia Collaboration (2016b). The RVS, from which results are presented inGaiaDR2 for the first time, is described in detail in Cropper et al.(2018). An important part of the pre-processing for allGaiainstruments is to remove the effect of non-uniformity of
the CCD bias levels, which is essential for achieving the ultimate image location and radial velocity determination performance.
The details of this process are described inHambly et al.(2018).
The timing of events on board Gaia, including the data collection, is given in terms of the on board mission time- line (OBMT) which is generated by theGaiaon board clock. By convention OBMT is expressed in units of 6 h (21 600 s) space- craft revolutions (Gaia Collaboration 2016b). The approximate relation between OBMT (in revolutions) and the barycentric coordinate time (TCB, in Julian years) atGaiais
TCB'J2015.0+(OBMT−1717.6256 rev)/(1461 rev yr−1). (1) The 22 month time interval covered by the observations used for GaiaDR2 starts at OBMT 1078.3795 rev = J2014.5624599 TCB (approximately 2014 July 25, 10:30:00 UTC), and ends at OBMT 3750.5602 rev = J2016.3914678 TCB (approximately 2016 May 23, 11:35:00 UTC). As discussed inGaia Collaboration(2016a) this time interval contains gaps caused by both spacecraft events and by on-ground data processing problems. This leads to gaps in the data collection or stretches of time over which the input data cannot be used. Which data are considered unusable varies across theGaiadata processing systems (astrometry, photome- try, etc) and as a consequence the effective amount of input data used differs from one system to the other. We refer to the specific data processing papers (listed below) for the details.
A broad overview of the data processing for Gaiais given in Gaia Collaboration (2016b) while the simplified processing forGaiaDR1 is summarised inGaia Collaboration(2016a), in particular in their Fig. 10. With respect toGaiaDR1 the follow- ing major improvements were implemented in the astrometric processing (for details, seeLindegren et al. 2018):
– Creation of the source list: this process (also known as cross- matching;Fabricius et al. 2016) provides the link between the individualGaiadetections and the entries (“sources”) in the Gaiaworking catalogue. For GaiaDR1 the detections were matched to the nearest source, using a match radius of 1.5 arcsec, and new sources were created when no match was found. Spurious detections and limitations of the ini- tial source list resulted in many spurious sources but also the loss inGaiaDR1 of many real sources, including high proper motion stars. ForGaiaDR2 the source list was cre- ated essentially from scratch, based directly on the detections and using a cluster analysis algorithm that takes into account a possible linear motion of the source. The source list for GaiaDR2 is therefore much cleaner and of higher angular resolution (Sect.5.3), resulting in improved astrometry.
– Attitude modelling: in the astrometric solution, the pointing of the instrument is modelled as a function of time using splines. However, these cannot represent rapid variations caused by the active attitude control, micro-clanks (micro- scopic structural changes in the spacecraft), and microm- eteoroid hits. In Gaia DR1 the accuracy of the attitude determination was limited by such effects. For GaiaDR2 the rapid variations are determined and subtracted by a ded- icated process, using rate measurements from successive CCD observations of bright sources.
– Calibration modelling: optical aberrations in the telescopes and the wavelength-dependent diffraction create colour- dependent shifts of the stellar images (chromaticity). This will eventually be handled in the pre-processing of the raw data, by fitting colour-dependent PSFs or LSFs to the CCD samples. This procedure will only be in place for the next
release, and the effect was completely ignored forGaiaDR1.
In the current astrometric solution chromaticity is handled by the introduction of colour-dependent terms in the geometric calibration model.
– Global modelling: the basic-angle variations are more accu- rately modelled thanks to an improved processing of the on- board measurements (using the Basic Angle Monitor) and the introduction of global corrections to these measurements as additional unknowns in the astrometric solution. This has been especially important for reducing large-scale systemat- ics in the parallaxes.
– Celestial reference frame: establishing a link to the extra- galactic reference frame was complicated and indirect in GaiaDR1, which relied on the HIPPARCOSandTycho-2 cat- alogues for the determination of proper motions. By contrast, Gaia DR2 contains the positions and proper motions for about half a million identified quasars, which directly define a very accurate celestial reference frame (Gaia-CRF2), as described inGaia Collaboration(2018e).
The various improvements in the astrometric models have reduced the RMS residual of typical observations of bright stars (G.13) from about 0.67 mas inGaiaDR1 to 0.2–0.3 mas in GaiaDR2.
Additional improvements in the data processing for Gaia DR2 as well as the introduction of new elements facili- tated the much expanded variety of data published in this second release. Although the photometric processing pipeline did treat the data fromGaia’s BP and RP photometers from the start of the mission operations, it was decided not to publish the results inGaiaDR1 (Evans et al. 2017) because of the still preliminary nature of the calibrations of these instruments. The process- ing for Gaia DR2 features enhancements in the photometric calibrations, including of the BP and RP prism spectra. The inte- grated light from these spectra is published in this release as the fluxes in theGBP andGRPpassbands. In addition the pho- tometric passbands for G, GBP, and GRP are published, both the versions used in the data processing and the revised ver- sions (based on a deeper analysis involving the BP/RP spectra of standard stars). The photometric data processing and results validation forGaiaDR2 are described inEvans et al.(2018) and Riello et al.(2018).
The processing of RVS data was also in place from the start of mission operations but during the operations up toGaiaDR1 the adaptations necessary to the RVS pipeline to deal with the effects of the excess stray light on boardGaiaprevented the pub- lication of results. HenceGaiaDR2 features the first RVS results in the form of median radial velocities. The details of the RVS data processing and results validation are provided inSartoretti et al.(2018),Katz et al.(2018), andSoubiran et al.(2018).
Epoch astrometry was determined for a list of 14 000 pre-selected small solar system bodies (henceforth referred to as Solar System Objects or SSOs). The data processing and validation for the Gaia DR2 SSO data are described in Gaia Collaboration(2018f).
Astrophysical parameters (Teff, AG, E(GBP−GRP), radius and luminosity) were determined for between 77 and 161 mil- lion stars from theGaiabroad-band photometry and parallaxes alone (no non-Gaiadata was used). The details of the astrophys- ical parameter estimation and the validation of the results are described inAndrae et al.(2018).
Practically all sources present inGaiaDR2 were analysed for apparent brightness variations, resulting in a catalogue of about 0.5 million stars securely identified as variables and for which light curves and statistical information on the photometric time
Table 1.Number of sources of a given type or the number for which a given data product is available inGaiaDR2.
Data product or source type Number of sources
Total 1 692 919 135
5-parameter astrometry 1 331 909 727
2-parameter astrometry 361 009 408
ICRF3 prototype sources 2820
Gaia-CRF2 sources 556 869
G-band 1 692 919 135
GBP-band 1 381 964 755
GRP-band 1 383 551 713
Radial velocity 7 224 631
Classified as variable 550 737
Variable type estimated 363 969
Detailed characterisation of light curve 390 529 Effective temperatureTeff 161 497 595
ExtinctionAG 87 733 672
Colour excessE(GBP−GRP) 87 733 672
Radius 76 956 778
Luminosity 76 956 778
SSO epoch astrometry and photometry 14 099
series are provided. The variability processing is described in Holl et al.(2018).
Finally, an overall validation of the Gaia DR2 catalogue is described in Arenou et al. (2018), which, as outlined in Gaia Collaboration(2016b), involves an extensive scientific val- idation of the combined data presented in this data release.
A number of important shortcomings remain in the data processing, leading to limitations inGaia DR2 which require taking some care when using the data. In Sect. 6 we sum- marise the known limitations of the presentGaia data release and point out, where relevant, the causes. Section 7 provides additional guidance on the use of Gaia DR2 results. The reader is strongly encouraged to read the papers listed above and the online documentation1 to understand the limitations in detail.
3. Overview of the contents ofGaiaDR2
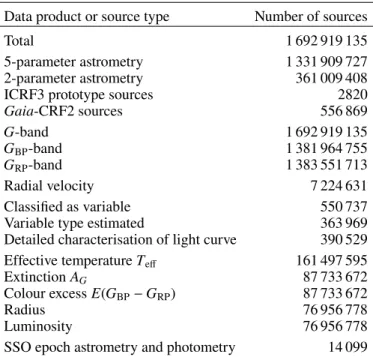
Gaia DR2 contains astrometry, broad-band photometry, radial velocities, variable star classifications as well as the charac- terisation of the corresponding light curves, and astrophysical parameter estimates for a total of 1 692 919 135 sources. In addition the epoch astrometry and photometry for 14 099 solar system objects are listed. Basic statistics on the source numbers and the overall distribution inG can be found in Table 1 and Table 2, where it should noted that 4 per cent of the sources are fainter than G = 21. The overall quality of Gaia DR2 results in terms of the typically achieved uncertainties is sum- marised in Table 3. The contents of the main components of the release, of which the magnitude distributions are shown in Figs.1and2, are summarised in the following paragraphs. We defer the discussion on the known limitations of GaiaDR2 to Sect.6.
1 http://gea.esac.esa.int/archive/documentation/GDR2/
index.html
5 10 15 20 25 Mean G [mag]
10
010
110
210
310
410
510
610
710
8Nu m be r p er 0 .1 m ag b in
Teff
vrad
Variable Gaia-CRF2
ICRF3 prototype SSOGaia DR1 Gaia DR2
Fig. 1. Distribution of the mean values of G for allGaiaDR2 sources shown as histograms with 0.1 mag wide bins. The distribution of theGaiaDR1 sources is included for compari- son and illustrates the improved photometry at the faint end and the improved completeness at the bright end. The other histograms are for the main Gaia DR2 components as indicated in the legend. See text for further explanations on the characteristics of the histograms.
Table 2.Distribution of theGaiaDR2 sources inG-band magnitude.
Magnitude distribution percentiles (G)
Percentile All 5-parameter 2-parameter
0.135% 11.6 11.4 15.3
2.275% 15.0 14.7 18.5
15.866% 17.8 17.4 19.8
50% 19.6 19.3 20.6
84.134% 20.6 20.3 21.0
97.725% 21.1 20.8 21.2
99.865% 21.3 20.9 21.4
Notes. The distribution percentiles are shown for all sources and for those with a 5-parameter and 2-parameter astrometric solution, respectively.
3.1. Astrometric data set
The astrometric data set consists of two subsets: for 1 331 909 727 sources the full five-parameter astrometric solu- tion is provided (“5-parameter” in Table 1), hence including celestial position, parallax, and proper motion. For the remaining 361 009 408 sources (“2-parameter” in Table1) only the celestial positions (α, δ) are reported. Figure 2 shows the distribution inGfor the 5-parameter and 2-parameter sources compared to the overall magnitude distribution. The 2-parameter sources are typically faint (with about half those sources atG >20.6, see Table2), have very few observations, or very poorly fit the five- parameter astrometric model. All sources fainter than G =21 have only positions in GaiaDR2. We refer toLindegren et al.
(2018) for the detailed criteria used during the data processing to decide which type of solution should be adopted.
For a 2-parameter source the position was computed using a special fall-back solution. Rather than ignoring the parallax and proper motion of the source (i.e. assuming that they are strictly zero), the fall-back solution estimates all five parameters but applies a prior that effectively constrains the parallax and proper motion to realistically small values, depending on the magnitude and Galactic coordinates of the source (Michalik et al. 2015b).
The resulting position is usually more precise, and its uncertainty more realistic (larger), than if only the position had been solved for. The parallax and proper motion of the fall-back solution may however be strongly biased, which is why they are not published.
Fig. 2.Distribution of the mean values ofGfor the sources with a full astrometric solution inGaiaDR2 (“5-parameter”) and for the sources for which only the celestial position is listed (“2-parameter”) compared to the overall magnitude distribution forGaiaDR2.
The reference epoch for all (5- and 2-parameter) sources is J2015.5 (TCB). This epoch, close to the mid-time of the observa- tions included inGaiaDR2, was chosen to minimise correlations between the position and proper motion parameters. This epoch is 0.5 yr later than the reference epoch forGaiaDR1, which must be taken into account when comparing the positions between the two releases.
As forGaiaDR1 all sources were treated as single stars when solving for the astrometric parameters. For a binary the parame- ters may thus refer to either component, or to the photocentre of the system, and the proper motion represents the mean motion of the component, or photocentre, over the 1.75 yr of data included in the solution. Depending on the orbital motion, this could be significantly different from the proper motion of the same object inGaiaDR1 (see Sect.5).
The positions and proper motions are given in the second realisation of theGaia celestial reference frame (Gaia-CRF2) which at the faint end (G ∼ 19) is aligned with the Interna- tional Celestial Reference Frame (ICRF) to about 0.02 mas RMS at epoch J2015.5 (TCB), and non-rotating with respect to the ICRF to within 0.02 mas yr−1RMS. At the bright end (G < 12) the alignment can only be confirmed to be better than 0.3 mas while the bright reference frame is non-rotating to within 0.15 mas yr−1. For details we refer to Lindegren et al.(2018).
TheGaia-CRF2 is materialised by 556 869 QSOs and aligned
to the forthcoming version 3 of the ICRF through a subset of 2820 QSOs. It represents the first ever optical reference frame constructed on the basis of extragalactic sources only. The con- struction and properties of theGaia-CRF2 as well as the compar- ison to the ICRF3 prototype are described inGaia Collaboration (2018e).
3.2. Photometric data set
The photometric data set contains the broad band photometry in theG,GBP, andGRP bands, thus providing the major new ele- ment of colour information for Gaia DR2 sources. The mean value of theG-band fluxes is reported for all sources while for about 80 per cent of the sources the mean values of theGBPand GRP fluxes are provided (for a small fraction of these sources only theGRPvalue is reported). The photometric data process- ing considered three types of sources, “Gold”, “Silver”, and
“Bronze”, which represent decreasing quality levels of the pho- tometric calibration achieved, where in the case of the Bronze sources no colour information is available. The photometric nature of each source is indicated in the released catalogue by a numeric field (phot_proc_mode) assuming values 0, 1 and 2 for gold, silver, and bronze sources respectively. At the bright end the photometric uncertainties are dominated by calibration effects which are estimated to contribute 2, 5, and 3 mmag RMS per CCD observation, respectively forG,GBP, andGRP (Evans et al. 2018). For details on the photometric processing and the validation of the results we refer toRiello et al.(2018) andEvans et al.(2018).
The broad-band colour information suffers from strong sys- tematic effects at the faint end of the survey (G&19), in crowded regions, and near bright stars. In these cases the photometric measurements from the blue and red photometers suffer from an insufficiently accurate background estimation and from the lack of specific treatment of the prism spectra in crowded regions, where the overlapping of images of nearby sources is not yet accounted for. This leads to measured fluxes that are inconsis- tent between theGand theGBPandGRPbands in the sense that the sum of the flux values in the latter two bands may be sig- nificantly larger than that inG (whereas it is expected that for normal spectral energy distributions the sum of fluxes inGBP
andGRPshould be comparable to that inG). A quantitative indi- cation of this effect is included inGaiaDR2 in the form of the
“flux excess factor” (thephot_bp_rp_excess_factorfield in the data archive).
The distribution of the astrometric and photometric data sets inG is shown in purple in Fig. 1, where for comparison the distribution forGaiaDR1 is also shown in yellow. Note the improved completeness at the bright end of the survey and the improved photometry (less extremely faint sources) and com- pleteness at the faint end. The distribution of the Gaia-CRF2 sources (pink-red line) shows a sharp drop atG=21 which is because only QSOs atG<21 were used for the construction of the reference frame.
3.3. Radial velocity data set
The radial velocity data set contains the median radial veloci- ties, averaged over the 22 month time span of the observations, for 7 224 631 sources which are nominally brighter than 12th magnitude in theGRVS photometric band. For the selection of sources to process, the provisional GRVS magnitude as listed in the Initial Gaia Source List (Smart & Nicastro 2014) was used. The actual magnitudes in theGRVSband differ from these
provisional values, meaning that the magnitude limit inGRVSis not sharply defined. In practice the sources for which a median radial velocity is listed mostly have magnitudes brighter than 13 inG (see light green line in Fig.1). The signal to noise ratio of the RVS spectra depends primarily onGRVS, which is not listed inGaiaDR2. It was decided not to publish theGRVSmag- nitude in GaiaDR2 because the processing of RVS data was focused on the production of the radial velocities, and the cal- ibrations necessary for the estimation of the flux in the RVS passband (background light corrections and the knowledge of the PSF in the direction perpendicular toGaia’s scanning direction) were only preliminary. As a result theGRVS magnitudes were of insufficient quality for publication in Gaia DR2 (Sartoretti et al. 2018). The value ofGRVSas determined during the data processing was however used to filter out stars considered too faint (GRVS>14) for inclusion in the radial velocity data set. For convenience we provide here a relation which allows to predict the value ofGRVSfrom the (G−GRP) colour.
GRVS−GRP =0.042319−0.65124(G −GRP)+1.0215(G−GRP)2
−1.3947(G−GRP)3+0.53768(G−GRP)4
to within 0.086 mag RMS for 0.1<(G−GRP)<1.4, (2) and
GRVS−GRP=132.32−377.28(G−GRP)+402.32(G−GRP)2
−190.97(G−GRP)3+34.026(G−GRP)4 to within 0.088 mag RMS for 1.4≤(G−GRP)<1.7. (3) This relation was derived from a sample of stars for which the flux in the RVS band could be determined to a precision of 0.1 mag or better.
Radial velocities are only reported for stars with effective temperatures in the range 3550–6900 K (where these temper- atures refer to the spectral template used in the processing, not to the Teff values reported as part of the astrophysical parameter data set). The uncertainties of the radial velocities are summarised in Table3. At the faint end the uncertainties show a dependency on stellar effective temperature, where the values are approximately 1.4 km s−1 and 3.6 km s−1 atGRVS=11.75 for stars withTeff ∼ 5500 K andTeff ∼ 6500 K, respectively.
The distribution over G of the sources with radial velocities shown in Fig.1in light green reflects the fact that over the range 4<G<12 the completeness of the radial velocity data set with respect to theGaiaDR2 data set varies from 60 to 80 per cent (Katz et al. 2018). At the faint end (G>13) the shape of the dis- tribution is determined by the selection of stars for which radial velocities were derived (using the provisional value ofGRVS) and the large differences betweenGandGRVSthat can occur depend- ing on the effective temperature of the stars. For the details on the radial velocity data processing and the properties and validation of the resulting radial velocity catalogue we refer to Sartoretti et al.(2018) andKatz et al.(2018). The set of standard stars that was used to define the zeropoint of the RVS radial velocities is described inSoubiran et al.(2018).
3.4. Variability data set
The variability data set consists of 550 737 sources that are securely identified as variable (based on at least two tran- sits of the sources across the fields of view of the two Gaia telescopes) and for which the photometric time series and cor- responding statistics are provided. This number still represents
Table 3.Basic performance statistics forGaiaDR2.
Data product or source type Typical uncertainty
Five-parameter astrometry (position & parallax) 0.02–0.04 mas atG<15 0.1 mas atG=17 0.7 mas atG=20 2 mas atG=21 Five-parameter astrometry (proper motion) 0.07 mas yr−1atG<15 0.2 mas yr−1atG=17 1.2 mas yr−1atG=20 3 mas yr−1atG=21
Two-parameter astrometry (position only) 1–4 mas
Systematic astrometric errors (averaged over the sky) <0.1 mas Gaia-CRF2 alignment with ICRF 0.02 mas atG=19 Gaia-CRF2 rotation with respect to ICRF <0.02 mas yr−1atG=19 Gaia-CRF2 alignment with ICRF 0.3 mas atG<12 Gaia-CRF2 rotation with respect to ICRF <0.15 mas yr−1atG<12 MeanG-band photometry 0.3 mmag atG<13 2 mmag atG=17 10 mmag atG=20 MeanGBP- andGRP-band photometry 2 mmag atG<13 10 mmag atG=17 200 mmag atG=20 Median radial velocity over 22 months 0.3 km s−1atGRVS<8 0.6 km s−1atGRVS=10 1.8 km s−1atGRVS=11.75 Systematic radial velocity errors <0.1 km s−1atGRVS<9 0.5 km s−1atGRVS=11.75
Effective temperatureTeff 324 K
ExtinctionAG 0.46 mag
Colour excessE(GBP−GRP) 0.23 mag
Radius 10%
Luminosity 15%
Solar system object epoch astrometry 1 mas (in scan direction)
Notes.The astrometric uncertainties as well as the Gaia-CRF2 alignment and rotation limits refer to epoch J2015.5 TCB. The uncertainties on the photometry refer to the mean magnitudes listed in the main Gaia DR2 catalogue.
only a small subset of the total amount of variables expected in the Gaia survey and subsequent data releases will contain increasing numbers of variable sources. Of the sources identi- fied as variable 363 969 were classified into one of nine variable types by a supervised light curve classifier. The types listed in the Gaia DR2 are: RR Lyrae (anomalous RRd, RRd, RRab, RRc); long period variables (Mira type and Semi-Regulars);
Cepheids (anomalous Cepheids, classical Cepheids, type-II Cepheids);δScuti and SX Phoenicis stars. A second subset of 390 529 variable stars (largely overlapping with the variability type subset) was analysed in detail when at least 12 points were available for the light curve. These so-called “specific object studies” (SOS) were carried out for variables of the type Cepheid and RR Lyrae, long period variables, short time scale variables (with brightness variations on time scales of one day or less), and rotational modulation variables.
Figure1 shows in dark blue the distribution overG of the sources identified as variable. The meanGvalue as determined in the photometric data processing (used in Fig. 1) may differ from the mean magnitude determined from the photometric time series where the variable nature of the source is properly
accounted for. Hence the distribution in Fig.1should be taken as illustrative only. For full details on the variable star processing and results validation we refer toHoll et al.(2018) and references therein.
3.5. Astrophysical parameter data set
The astrophysical parameter data set consists of estimated values ofTeff, extinctionAGand reddeningE(GBP−GRP) (both derived from the apparent dimming and reddening of a source), radius, and luminosity for stars brighter thanG=17. Table1contains the source counts for each of these astrophysical parameters.
The magnitude distribution shown in Fig. 1 in cyan concerns all sources for whichTeff was estimated and indicates that this parameter is available for practically all sources atG<17. Val- ues of Teff are only reported over the range 3000–10 000 K, which reflects the limits of the training data for the algorithm used to estimateTeff. Estimates of the other astrophysical param- eters are published for about 50% of the sources for whichTeffis published. This is caused by the filtering of the pipeline results to remove parameter estimates for which the input data are too
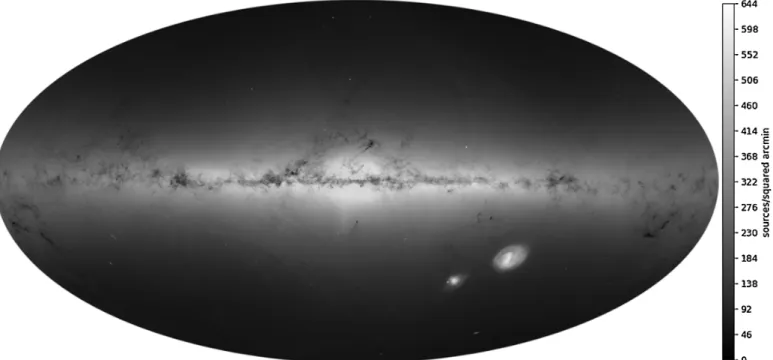
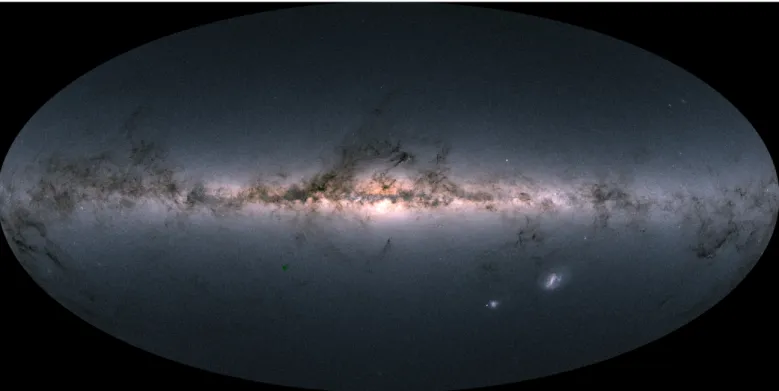
Fig. 3.Sky distribution of allGaiaDR2 sources in Galactic coordinates. This image and the one in Fig.4are Hammer projections of the full sky.
This projection was chosen in order to have the same area per pixel (not strictly true because of pixel discretisation). Each pixel is∼5.9 square arcmin. The colour scale is logarithmic and represents the number of sources per square arcmin.
poor or for which the assumptions made lead to invalid results.
The details of the astrophysical parameter processing and the validation of the results are described inAndrae et al.(2018).
3.6. Solar system objects data set
The solar system objects data set features epoch astrometry and photometry for a pre-selected list of 14 099 known minor bodies in the solar system, primarily main belt asteroids. Epoch astrom- etry refers to the fact that the measured celestial position for a given SSO is listed for each instance in time when it passed across the field of view of one ofGaia’s telescopes. The celes- tial positions at each epoch are given as seen fromGaia. These measurements can be used to determine orbits for the SSOs and the results thereof are described inGaia Collaboration(2018f).
For details on the processing of SSOs we refer to the same paper.Over the apparent magnitude rangeG∼12–17 the typical focal plane transit level of uncertainty achieved for the instan- taneous SSO celestial positions is 1 mas in the Gaiascanning direction. Figure1shows in dark green the magnitude distribu- tion for the SSOs, where it should be noted that the magnitudes as can be measured byGaiarepresent instantaneous measure- ments taken far from opposition. Hence the magnitude histogram is to be taken as illustrative only.
4. Scientific performance and potential ofGaiaDR2 Gaia DR2 is accompanied by six papers that provide basic demonstrations of the scientific quality of the results included in this release. The topics treated by the papers are:
– the reference frameGaia-CRF2 (Gaia Collaboration 2018e);
– orbital fitting of the epoch astrometry for solar system objects (Gaia Collaboration 2018f);
– variable stars as seen in the Gaia DR2 colour-magnitude diagram (Gaia Collaboration 2018b), where the motion of variables in colour-magnitude space is explored;
– the kinematics of the Milky Way disk (Gaia Collaboration 2018d), illustrating in particular the power of having radial velocities available inGaiaDR2;
– the kinematics of globular clusters, the LMC and SMC, and other dwarf galaxies around the Milky Way (Gaia Collaboration 2018c), showcasing the power of GaiaDR2 to study distant samples of stars;
– the observational Hertzsprung-Russell diagram is explored inGaia Collaboration(2018a).
We strongly encourage the reader to consult these papers for a full impression of the enormous scientific potential of the second Gaiadata release.
Here we restrict ourselves to illustrating both the improve- ment in the data quality and the expanded set of data products through the updated map of theGaiasky. Figure3shows the sky distribution of all the sources present inGaiaDR2 in the form of source densities on a logarithmic scale. When comparing to the map produced fromGaiaDR1 data (Gaia Collaboration 2016a) it is immediately apparent that there is a strong reduction in the artefacts caused by the combination of source filtering and the Gaia scanning law (see Gaia Collaboration 2016a, for a more detailed explanation of these artefacts), which is another illustration of the increased survey completeness ofGaiaDR2.
Nonetheless there are still source count variations visible, which clearly are imprints from the scanning law (as executed over the first 22 months of the mission). For example there are two arcs above and below theρOph clouds that can be traced all the way down to and below the Galactic plane (these can best be seen in the electronic version of the figure). Such arcs occur all along the ecliptic plane and are regions on the sky that were scanned more frequently byGaia and therefore contain relatively more sources that were observed often enough for inclusion in the published catalogue.
One newly visible (and real) feature in this map is the Sagit- tarius dwarf which can be noted as an excess in star counts in a strip below the bulge region, stretching to the R Corona Australis region.
Fig. 4.Map of the total flux measured in theGRP,G, andGBPbands, where the flux in these bands is encoded in the red, green, and blue channel, respectively. There is one easily visible artefact in this map, a “green” patch to the lower left of the bulge which is a region whereGBPandGRPdata are not available for a large number of sources, leading to the greenish colour which was used to encode theG-band fluxes (which are available for all sources). Such artefacts also occur (although not as visible) in the region to the upper left of the Small Magellanic Cloud and at high Galactic latitude to the right of the north Galactic pole region. The areas where green patches are likely to occur can be identified in Fig. 27 in Evans et al.(2018) which shows the celestial distribution ofGaiaDR2 sources for which no BP/RP photometry is available.
Figure4 shows a map that combines the integrated fluxes as observed in theGRP,G, andGBPbands, where the integrated flux map for each of the bands was used to colour code the image according to a red, green, and blue channel. The map illustrates the availability of homogeneous all-sky multi-band photometry inGaiaDR2 and offers a magnificent view of the Milky Way in colour. This flux map also reveals numerous open clusters which are not readily visible in the source count map (while on the other hand many faint source concentrations, such as dis- tant dwarf galaxies are no longer visible). Complete details on the construction of the images in Figs.3and4are provided in Moitinho et al.(2018).
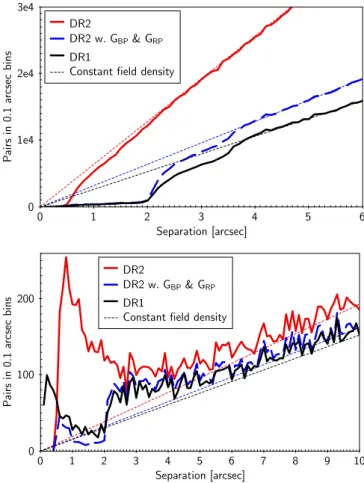
One aspect of the sky maps shown in Figs. 3 and 4 that is perhaps not as well appreciated is their effective angu- lar resolution, which given the size of Gaia’s main telescope mirrors (1.45 m along the scanning direction,Gaia Collaboration 2016b) should be comparable to that of the Hubble Space Telescope.Gaia Collaboration(2016a) andArenou et al.(2017) discuss how the effective angular resolution of Gaia DR1 is limited to about 2–4 arcsec owing to limitations in the data pro- cessing. This has much improved for Gaia DR2. The gain in angular resolution is illustrated in Fig.5. The top panel shows the distribution of source pair distances in a small, dense field. For GaiaDR2 (upper, red curve) source pairs below 0.4–0.5 arcsec are rarely resolved, but the resolution improves rapidly and above 2.2 arcsec practically all pairs are resolved. For GaiaDR1 the fraction of resolved source pairs started to fail at separations of 3.5 arcsec, reaching very low values below 2.0 arcsec. The same, modest resolution is seen forGaiaDR2 if we only con- sider sources withGBP andGRP photometry. The reason is the angular extent of the prism spectra and the fact thatGaiaDR1 only includes sources for which the integrated flux from the
BP/RP spectra could be reliably determined. The lower panel shows in the same way the source pairs in the one hundred times larger, sparse field. The more remarkable feature here is the peak of resolved binaries at small separations, which was missed in GaiaDR1. A similar population must be present in the dense field, where it cannot be discerned because the field is dominated by distant sources. The figure also demonstrates that the gain in number of sources fromGaiaDR1 toGaiaDR2 is mainly due to the close source pairs. Finally, Fig.5clearly demonstrates that the effective angular resolution ofGaiaDR2 quite significantly exceeds that of all ground-based large-area optical sky surveys.
5. TreatGaiaDR2 as independent fromGaiaDR1 Although Gaia DR1 and Gaia DR2 are based on observa- tions from the same instruments, the discussion in the following subsections shows that the two releases should be treated as inde- pendent. In particular the tracing of sources fromGaiaDR1 to GaiaDR2 (should this be needed for a particular application) must be done with care.
5.1. Gaia DR2 represents a stand-alone astrometric catalogue
Because the observational time baseline for GaiaDR2 is suf- ficiently long, parallax and proper motion can be derived from theGaiaobservations alone. That is, theTycho-GaiaAstromet- ric Solution (TGAS,Michalik et al. 2015a) as employed for the 2 million brightest stars inGaiaDR1 is no longer needed, and the astrometric results reported inGaiaDR2 are based solely on Gaiaobservations. For the TGAS subset fromGaiaDR1 there is thus a large difference in the time baseline for the proper motions
0 1 2 3 4 5 6 Separation [arcsec]
0 1e4 2e4 3e4
Pairsin0:1arcsecbins
DR2
DR2 w:GBP& GRP
DR1
Constant ¯eld density
0 1 2 3 4 5 6 7 8 9 10
Separation [arcsec]
0 100 200
Pairsin0:1arcsecbins
DR2
DR2 w:GBP& GRP
DR1
Constant ¯eld density
Fig. 5. Histograms from Arenou et al. (2018) of source pair sepa- rations in two circular test fields for GaiaDR2 sources (red lines);
Gaia DR2 sources with GBP and GRP photometry (blue lines); and GaiaDR1 sources (black lines). Top: a dense field of radius 0.5◦ at (`,b) =(−30◦,−4◦) with 456 142 sources, bottom: a sparse field of radius 5◦ at (`,b) = (−100◦,−60◦) with 250 092 sources. The thin, dotted lines show the relations for a constant density across the field.
(∼24 yr vs∼2 yr) which means there can be significant differ- ences between TGAS andGaiaDR2 proper motions for binary stars with orbital periods comparable to 2 yr. The TGAS proper motions may be more reliable in such cases. However, discrep- ancies can also point to erroneous TGAS proper motions related to a mismatching between (components of) sources observed by Gaiaand HIPPARCOS(seeMakarov et al. 2017, for a discussion of this issue). In cases where proper motion discrepancies are of interest they should be carefully investigated before deciding which values to use or concluding that the discrepancy points to the source not being a single star.
5.2. Photometric system evolution
The photometric data processing for Gaia DR2 (Riello et al.
2018; Evans et al. 2018) features many improvements with respect toGaia DR1 and represents a new photometric reduc- tion. In particular more input data was used and the stretch of data selected for the initialisation of the photometric calibration was largely free of the effects of contamination by water ice (see Gaia Collaboration 2016b, for a summary of the contamination problem in the early phases of theGaiamission). As a conse- quence the photometric system forGaiaDR2 is different from GaiaDR1. This is illustrated in Fig.6which shows the difference inG-band magnitude (∆G=GDR1−GDR2) for the same sources between the two data releases. The source pairs selected from
Fig. 6.Top diagram: difference in the value ofG(with∆G=GDR1− GDR2) as listed for the same sources inGaiaDR1 andGaiaDR2 as a function of (GBP−GRP). The source pairs selected from the two releases match in celestial position to within 0.25 arcsec and the formal error on the magnitude differences is less than 0.01. All sources were selected to have a flux excess factor inGaiaDR2 of less than 1.6. The dashed line shows a polynomial relation between the difference inGand the colour. The colour scale indicates the estimated uncertainty on ∆G.
Bottom panel: relation between ∆GandG after removing the colour dependency using the polynomial relation in the top panel.
the two releases match in celestial position to within 0.25 arc- sec and the formal error on the magnitude differences is less than 0.01. All sources were selected to have a flux excess fac- tor inGaiaDR2 of less than 1.6 (see Sect.3.2for a description of this quantity). The two panels in Fig. 6 show that there is a substantial difference in the G band values, with the mean of ∆Gbeing about−0.1 mag, and a strong colour dependence which is indicated by the dashed line showing the polynomial relation
GDR1−GDR2=−0.013612−0.079627(GBP−GRP)
−0.0040444(GBP−GRP)2
+0.0018602(GBP−GRP)3. (4) Removing the colour dependence and plotting∆Gvs.G(bottom panel of Fig.6) reveals image saturation effects at the bright end which more strongly affect theGaiaDR1 magnitudes. Sources