Indoor localization methods and services
by
Gergely Zachár
Supervisor: Gyula Simon, PhD
A thesis submitted to the University of Pannonia in fulfillment of the requirements for the degree of
Doctor of Philosophy
University of Pannonia 2018
DOI:10.18136/PE.2019.702
Indoor localization methods and services
Thesis for obtaining a PhD degree in the Doctoral School of Information Science of the University of Pannonia
in the branch of Information Sciences Written by Gergely Zachár
Supervisor: Gyula Simon
propose acceptance (yes / no) ……….
(supervisor) The PhD-candidate has achieved ... % in the comprehensive exam,
Veszprém, ……….
(Chairman of the Examination Committee) As reviewer, I propose acceptance of the thesis:
Name of Reviewer: …... …... yes / no
……….
(reviewer) Name of Reviewer: …... …... yes / no
……….
(reviewer) The PhD-candidate has achieved …...% at the public discussion.
Veszprém, ……….
(Chairman of the Committee) The grade of the PhD Diploma …... (…….. %)
Veszprém,
……….
(Chairman of UDHC)
Abstract
Object localization and tracking is a crucial element of various autonomous systems.
While in outdoor localization mainly GPS-based services are used, indoor localization systems use other competitive solutions, based on e.g. ultrasound, Wi-Fi signals, graphic markers, RFID tags, and visible light. The goal of this thesis is to provide contributions to radio-interferometric and image-processing-based indoor localization systems.
In this thesis two novel radio-interferometric tracking algorithms are presented. In radio-interferometric localization systems infrastructure transceivers generate interferometric signals, the phase of which are measured by receiver nodes deployed in the infrastructure and on the followed object. The position or the track of the object is calculated from the phase measurements and the known positions of the infrastructure transceivers. The first proposed solution is a geometric based approach, utilizing robust phase unwrapping, with which a moving target can be tracked from a known initial position. The second solution is based on a novel confidence map, generated from the measurements and the theoretical phase distribution, and it can either track an object from a known initial position or determine the full track and the initial position of the object retroactively. The proposed methods provide centimeter-range accuracy when the speed of the object is low (<1 m/s in the current implementation). The theoretical results are analyzed and supported by simulations and real measurements.
To aid the measurement process in radio interferometric applications, a novel distributed and efficient method was proposed to measure the phase differences. The new solution provides more accurate phase difference measurements than the current solutions, even in case of various waveforms, amplitudes, and noisy conditions. The proposed solution is distributed such that both the computational demand on the low-end measurement devices and the communication bandwidth required to transmit measurement results are low.
In a different application domain (image-processing-based indoor localization systems), a novel method was proposed to create long-distance beaconing, using Visible Light Communication (VLC). Beacons transmit their own IDs using VLC with high enough frequency (>100 Hz) to avoid flickering effect. The novel solution uses undersampling, which allows the utilization of simple sensors (e.g. inexpensive digital cameras with frame rates as low as 30 fps). Since the decoding requires only a few pixels on the image, the beacons can be reliably detected even from long distances (up to 50 m).
Kivonat
Objektumok lokalizációja és nyomon követése számos autonóm rendszer kulcsfontosságú eleme. Amíg a kültéri lokalizációban elsősorban a GPS-alapú szolgáltatásokat használják, a beltéri lokalizációs rendszerek számos egyéb megoldást alkalmaznak, pl. ultrahang, Wi-Fi jelek, grafikus markerek, RFID címkék és látható fény alapú rendszerek. Az értekezés célja, hogy új megoldásokat adjon rádió-interferometrikus és képfeldolgozásra épülő beltéri lokalizációs rendszerek megvalósításához.
A dolgozat két új rádió-interferometrikus nyomkövetési algoritmust mutat be. A rádió- interferometrikus lokalizációs rendszereknél az infrastruktúra adók interferometrikus jeleket generálnak, amelyek fázisát az infrastruktúrában elhelyezett és a követett objektumra telepített vevőegységekkel mérjük. Az objektum pozícióját vagy útvonalát a fázismérésekből és az infrastruktúra-eszközök ismert pozícióiból számítjuk. Az első javasolt megoldás egy geometriai alapú megközelítés, amely egy új robusztus fáziskorrekciós eljárást alkalmaz, amellyel egy mozgó célpont egy ismert kezdeti pozícióból követhető. A második megoldás egy új konfidencia térképen alapul, amelyet a fázismérésekből és az elméleti fáziseloszlásból származtatok, és amelynek segítségével egy objektumot nyomon követhető egy ismert kezdeti pozícióból, vagy visszamenőlegesen meghatározható annak teljes útvonala és kiindulási pozíciója. A javasolt módszerek centiméteres pontosságot nyújtanak alacsony objektum-sebesség esetén (<1 m/s). Az elméleti eredményeket szimulációkkal és valós mérésekkel támasztottam alá.
A rádió-interferometrikus mérési eljárás támogatásához új, elosztott és hatékony módszert javasoltam fáziskülönbségek mérésére. Az új megoldás nagyobb pontosságot biztosít a jelenlegi megoldásoknál különféle előforduló hullámformák, amplitúdók és zajos körülmények esetén is. A javasolt megoldás elosztott számításokat alkalmaz, így az kis számítási teljesítményű mérőeszközökkel is megvalósítható, ráadásul igen alacsony kommunikációs sávszélességet igényel.
Egy másik alkalmazási területen (képfeldolgozás alapú beltéri lokalizációs rendszerek) új módszert javasolok nagy hatótávolságú jeladók megvalósítására. A jeladók látható fény alapú kommunikáció (VLC) segítségével magas villogási frekvenciával (>100Hz) továbbítják saját azonosítóikat, így elkerülve az emberi szem számára zavaró villódzást. Az új megoldás alulmintavételezést alkalmaz, amely lehetővé teszi költséghatékony (akár 30 képkocka / másodperc sebességű) kamerák használatát is. Mivel a dekódolás csak néhány képpontot igényel, a jeladók nagy távolságról is megbízhatóan észlelhetők (akár 50 m-ig).
Abstrakt
Objekt lokalisering og sporing er et viktig element i ulike autonome systemer. Mens i utendørs lokalisering hovedsakelig brukes GPS-baserte tjenester, innendørs lokaliseringssystemer fortrekker andre konkurransedyktige løsninger, basert på f.eks. ultralyd, Wi-Fi-signaler, grafiske markører, RFID-koder og synlig lys. Målet med denne avhandlingen er å levere bidrag til radio-interferometriske og bildebehandlingsbaserte innendørs lokaliseringssystemer.
I denne avhandlingen presenteres det to nye radio-interferometriske sporingsalgoritmer.
I radio-interferometriske lokaliseringssystemer genererer infrastruktur-transceivere interferometriske signaler, fasen måles av mottakernoder i infrastrukturen og på det etterfølgende objektet. Objektets posisjon eller spor beregnes ut fra fasemålingene og de kjente posisjonene til infrastruktur enheter Den første foreslåtte løsningen er tilnærming basert på geometri, ved bruk av robust faseutpakking hvor et bevegelig mål kan spores fra en kjent startposisjon. Den andre løsningen er basert på et nytt selvtillitskart, generert fra målingene og den teoretiske fasedistribusjonen, og den kan enten spore et objekt fra en kjent startposisjon eller bestemme hele sporet og den opprinnelige posisjonen til objektet med tilbakevirkende kraft. De foreslåtte metodene gir nøyaktighet i centimeterområdet når objektets hastighet er lav (<1 m / s i dagens implementering). De teoretiske resultatene blir analysert og støttet av simuleringer og virkelige målinger.
For å støtte måleprosessen i radiointerferometriske applikasjoner, ble det foreslått en ny distribuert og effektiv metode for å måle faseforskjellene. Den nye løsningen gir mer nøyaktige faseforskjellmålinger enn de nåværende løsningene, selv om det er forskjellige bølgeformer, amplituder og støyende forhold. Den foreslåtte løsningen distribueres slik at både beregningsbehovet på måleinstrumentene og kommunikasjonsbåndbredden som kreves for å overføre målesultater, er lave.
I et annet applikasjonsdomene (bildebehandlingsbaserte innendørs lokaliseringssystemer) ble det foreslått en ny metode for å lage langdistanse beacons ved bruk av Visible Light Communication (VLC). Beacons sender sine egne ID-er ved hjelp av VLC med høy nok frekvens (> 100 Hz) for å unngå den flimrende effekten. Den nye løsningen ansetter underprøvetaking, som tillater bruk av enkle sensorer (for eks. billige digitale kameraer med opptaksfrekvens så lave som 30 fps). Siden dekodningen krever bare noen få piksler på bildet, kan beacons påvises pålitelig selv fra lange avstander (opptil 50 m).
INDEX
1. Introduction ... 1
2. Background and previous work ... 3
2.1. Object positioning and tracking principles ... 3
2.2. Object positioning applications ... 5
2.3. Interferometry in measurement systems ... 7
2.4. Radio-interferometric localization ... 7
2.5. Phase difference measurement ... 9
2.6. Phase unwrapping techniques ... 12
3. Radio-interferometric tracking based on phase-unwraping ... 16
3.1. Basic hyperboloid-based tracking ... 16
3.1.1. Tracking in one dimension ... 16
3.1.2. Tracking in higher dimensions ... 18
3.1.3. Tracking infrastructure ... 18
3.1.4. Utilizing redundant phase measurements ... 19
3.2. Simultaneous Phase Unwrapping ... 21
3.3. Fault-tolerant hyperboloid-based tracking ... 22
3.4. Evaluation ... 25
3.4.1. Error analysis ... 25
3.4.2. Simulation results ... 27
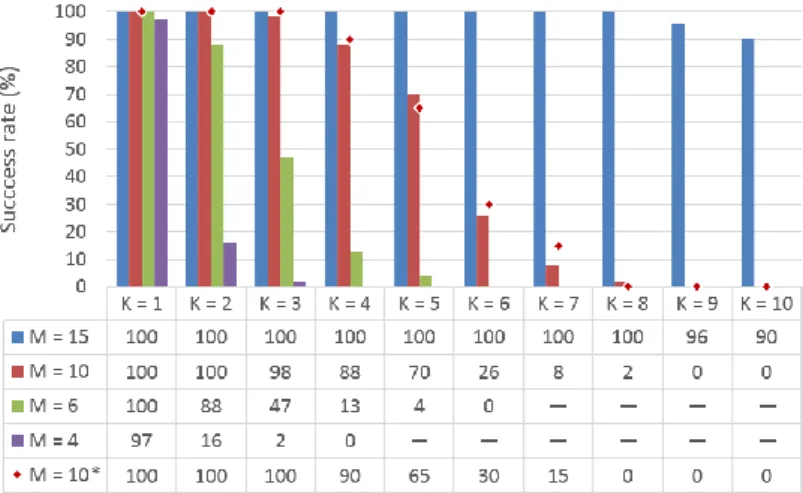
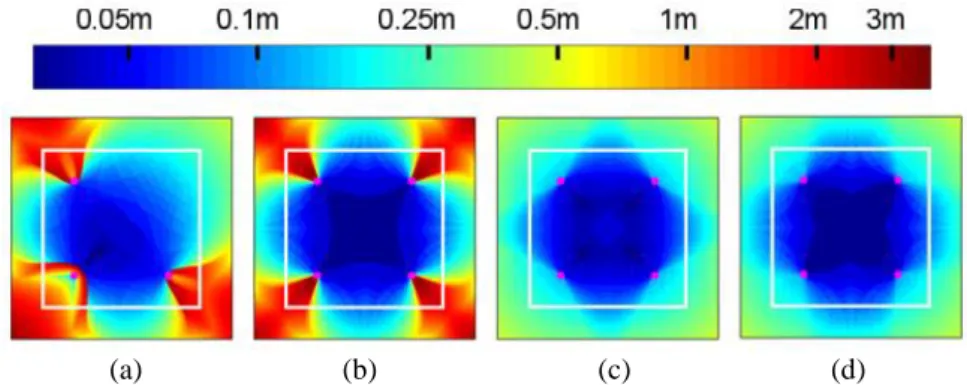
3.4.3. Node placement analysis ... 32
3.4.4. Measurements ... 37
3.5. Conclusion ... 43
4. Radio-interferometric tracking based on confidence maps ... 44
4.1. Position confidence map ... 45
4.2. Basic confidence-map based tracking ... 47
4.3. Peak detection anomalies ... 48
4.4. Adaptive peak extraction ... 49
4.5. Confidence map-based peak prediction ... 51
4.6. Prediction-aided, confidence-map based tracking algorithm ... 52
4.7. Evaluation ... 53
4.7.1. Simulations ... 53
4.7.2. Measurements ... 55
4.8. Conclusion ... 57
5. Distributed Phase Difference Measurement ... 58
5.1. System overview ... 59
5.1.1. Measurement setup ... 59
5.1.2. Hardware ... 60
5.1.3. Measurement software ... 60
5.2. Phase difference estimation ... 61
5.2.1. Phase estimation algorithm ... 61
5.2.2. Distributed calculation ... 63
5.2.3. Measurement synchronization ... 63
5.3. Evaluation ... 65
5.3.1. Simulation ... 66
5.3.2. Measurement results ... 67
5.4. Conclusion ... 68
6. Long distance VLC-based beaconing for indoor localization ... 70
6.1. System overview ... 71
6.1.1. Beaconing ... 72
6.1.2. Bit detection ... 73
6.1.3. ID detection ... 73
6.1.4. Beacon detection ... 74
6.2. Parameter design ... 74
6.2.1. Code parameter design ... 74
6.2.2. Error rate vs. blinking frequency ... 76
6.3. Implementation ... 77
6.4. Evaluation ... 77
6.4.1. Detection accuracy ... 77
6.4.2. Cluster size vs. distance ... 78
6.4.3. Application ... 79
6.5. Conclusion ... 80
7. Summary ... 82
7.1. New results ... 82
7.2. Future research ... 83
7.3. Application and comparative evaluation ... 83
8. Summary of Theses ... 88
9. References ... 92
1
1. Introduction
Object localization and tracking is a crucial element of autonomous systems. While in outdoor localization mainly GPS-based services are used, indoor localization systems use other competitive solutions, based on e.g. ultrasound, Wi-Fi signals, graphic markers, RFID tags, and visible light. Localization systems contain several building blocks; at the lowest level physical measurement devices are present, producing physical parameters (e.g. signal strength, phase, time-of-flight, image frames, etc.). The next processing level provides higher- level and more abstract properties (e.g. distance, angle, relative position, etc.). At the highest level of the processing chain fusion and localization algorithms accumulates and fuse the data, and as a result, present the location of the tracked object.
This thesis provides contributions at all levels of the signal processing chain: at the lower levels (1) a new robust, accurate, and low complexity method will be presented to measure the phase-difference of the radio-interferometric signals, and (2) a new beaconing method will be proposed for optical-based localization systems. At the fusion level two new algorithms will be introduced to provide accurate and robust tracking utilizing radio- interferometric measurement architectures.
In Section 2 related work and current solutions are overviewed.
In Section 3 a novel radio-interferometric tracking application is proposed. Fixed radio transceiver nodes are used to generate interferometric signals, allowing the tracking of a moving object, equipped with a radio receiver. Low-frequency phase measurements of the interferometric signals are processed by the proposed Simultaneous Phase Unwrapping algorithm, and then the real-time position estimates are calculated. Simultaneous Phase Unwrapping is proposed as a solution of a newly identified phase unwrapping problem set;
where the separate wrapped 1D phase signals are unwrapped utilizing a higher level relationship between them. The actual object location is calculated with a self-correcting algorithm based on an error surface, which provides a fault-tolerant and robust tracking method. The performance of the tracking system is analyzed by simulations and real measurements, indicating that the proposed method tolerates well substantial measurement phase noise and even sporadic large measurement errors.
In Section 4 another novel robust radio-interferometric object tracking method is proposed. The system utilizes the same radio-interferometric phase measurement process as the tracking solution presented in Section 3. However, from the measured phase values now a
2 confidence map is computed, which is used to generate the track of the moving receivers. The proposed method can be operated in two modes: (1) the object path is determined based on the initial position and the successive measurements, (2) the object path is determined retroactively based on the progression of the confidence map. The proposed method also enhances the track estimation by an adaptive evaluation method of the confidence map, and provides more robust estimation by allowing temporary bad or missing measurements, which are tolerated by a prediction mechanism, extracted from the evolution of the confidence map in time. The performance of the proposed system is illustrated by simulations and real measurements
Phase difference measurement of interfering radio signals is an essential part of radio- interferometric positioning applications. In Section 5 a novel phase measurement system is proposed, which is able to accurately measure the phase difference of the received radio signals. The proposed solution contains a novel algorithm, which can measure the phase of the signals even when the waveforms are distorted, the amplitudes vary or the measurement noise is significant. The signal processing and the calculations of the phase difference are distributed; preprocessing of the signal is performed on the measurement devices with integer arithmetic and only a small amount of data is sent to the base station. The final steps of the calculation take place on the base station (usually a PC) utilizing floating point arithmetic.
Thus the suggested measurement system can be operated on inexpensive devices with very limited computing capabilities (e.g. on 8-bit microcontrollers) and the precision of the phase estimation still can be high. The performance of the proposed system is illustrated with real measurements results.
In Section 6 the design of an LED-based beaconing infrastructure is introduced, which can be utilized in indoor localization systems. The beacons can be identified with regular cameras as detectors. The proposed solution detects and extracts the IDs of the beacons from a series of frames. The detected IDs and their positions can be used for localization purposes.
The LED beacons are blinking with high frequency, invisible for human eyes, thus they can be part of the existing lighting infrastructure. The proposed coding system utilizes the undersampling of the signal: the sampling frequency of the cameras is much lower than the blinking frequency, thus the proposed system can be operated using inexpensive devices. The performance of the proposed system is analyzed and a possible application is introduced.
Section 7 summarizes the new results and provides an outlook for possible further research and applications.
3
2. Background and previous work
This section provides a brief overview of the current localization and tracking solutions and also introduces the field of phase unwrapping, phase measurement, the fundamental radio-interferometric principles and measurement processes, which are necessary foundations of the proposed tracking algorithms and applications.
2.1. Object positioning and tracking principles
Positioning and tracking applications are utilizing several basic principles. These are mostly based on geometry, where the measured properties are angles and distances. Other solutions compare measured quintities to a priori information, mainly maps from previously collected measurements, or measure the relative movements of the object. In this chapter these principles will be briefly summarized. Note that these methods are presented in two dimensions, but their extension to 3D is trivial.
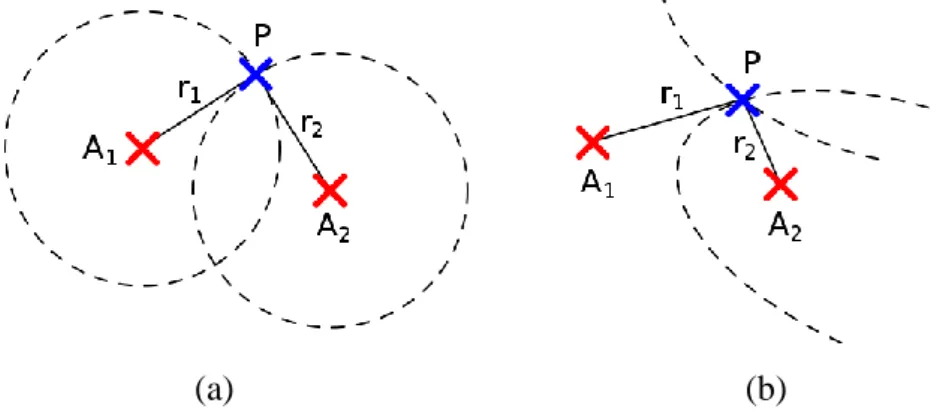
In several applications measured angles (Angle of Arrival, AoA) are available for localization (see Figure 1). The object position P can be estimated based on the measured angles (which are measured to a global reference direction) and on the known positions of the anchor points, as can be seen in Figure 1(a). The required calculations are trivial; the location estimate is at the intersection of the measured direction vectors. Object positioning is also possible if only the differences of the angles are known (see Figure 1(b)). In this scenario the difference between the measured angles are inscribed angles in circles. With multiple circles the position can be estimated as the intersection of the circles.
(a) (b)
Figure 1. Location estimation utilizing the measured angle (Angle of Arrival, AoA): (a) object position P (blue mark) is estimated based on the known positions of the anchor points A1, A2 (red marks) and the measured angles , (b) object position is estimated based on the known positions of the anchor points
and the measured angle differences as the inscribed angles of circles C1, C2.
In several localization applications the range between the anchor points and the tracked object can be used. The absolute distance can be measured with a Time of Flight (ToF, or
4 Time of Arrival, ToA) approach, which utilizes the fact that the distance and the required time for a signal to travel this distance thought a medium are proportional. If the distances between the object and the anchor points with known locations are known then the localization is trivial, as can be seen in Figure 2. The object position can be estimated as the intersection of the circles with radii equal to the measured distances. If only the Time Difference of Arrival (TDoA) can be measured, the position of the object will be on a hyperbola, as can be seen in Figure 2(b). With multiple measurements the exact location can be calculated as the intersection of the hyperbolas.
(a) (b)
Figure 2. Location estimation utilizing the measured range: (a) Time of Flight (ToF) location estimation of an object P (blue mark) based on the measured absolute ranges and the known positions of anchor
points A1, A2 (red marks), (b) Time Difference of Arrival object location estimation based on the measured range differences and the known positions of the anchor points.
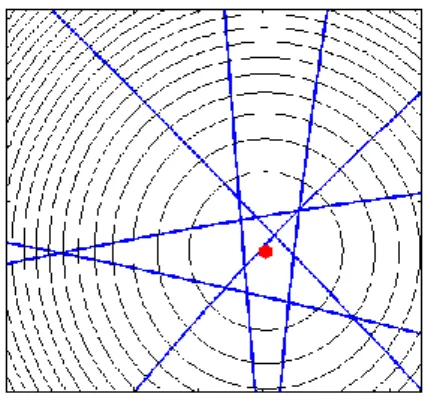
The fingerprinting localization method, which is presented in Figure 3, requires a priori information for the object location estimation. Before the positioning, a reference map is created with several measurements in known positions. When the object is localized, the measurement results are compared to the reference map; the object position is estimated as the location where the correlation between the measurements and the reference map are the highest. Note that this localization solution can be used with several different types of measured parameters, e.g. magnetic field strength, received radio signal strength, etc.
Figure 3. Location estimation utilizing a reference map (fingerprinting): object position P is estimated based on the measured values and the reference map. The estimated position is the point where the
correlation between the map and the measurements are the highest.
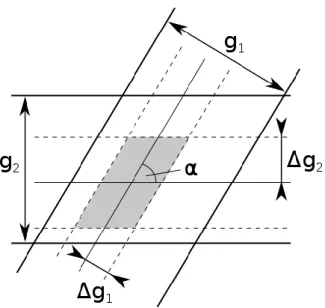
5 Localization can be done utilizing only the measured movement parameters of the object (see Figure 4). In this scenario the parameters of consecutive movements are measured (e.g. using rotary encoders) or are estimated (e.g. using accelerometers, gyroscopes). For an exact location the origin of the object path should be known. Note that the localization error based on each movement is accumulating, thus for accurate positioning the exact object location should periodically be corrected with other methods.
Figure 4. Location estimation utilizing the measured consecutive displacements: for the exact location of the object the origin of the path should be known
2.2. Object positioning applications
While in outdoor positioning the most dominant method is GPS, for indoor positioning several alternative methods have been proposed. In this section the most prevalent methods will be reviewed, through a representative application.
Acoustic (most commonly ultrasound) solutions calculate the pairwise distances based on the measured time-difference-of-flight of the emitted pulses, and the known position of the beacons. The system proposed in [1] utilizes several devices on known positions with microphones to locate the object equipped with a loudspeaker. The proposed solution records the time instances on each device when the signal is arrived, which will be proportional to the distances. Since the clocks of the receivers are synchronized, the position of the source can be calculated based on the known positions of the receivers using the TDoA method.
Radio waves are commonly used for indoor localization. The most common methods are using a signal-strength based approach, and can be categorized into two classes. The methods corresponding to the first class utilize the mathematical model of the propagation of the radio waves. The sources of the signal are at known positions and the receiver measure the received strength (in some cases also the phase) of the signal. Based on the model the range between the source and the receiver can be approximated. The localization principle is mathematically equivalent to the ToF principle. Note that the drawback of this approach is that the environment has heavy influence on the signal strength, resulting in limited ranging accuracy, and thus modest localization accuracy. [2]
6 The methods of the second class of the signal strength based solutions utilize a priori information. Before the actual localization a statistical reference map is created with several measurements in known locations. The localization itself is based on the fingerprinting principle. The drawback of this approach is that any environmental change (e.g. moving the furniture) may corrupt the reference map. [3]
Great advantage of radio RSSI methods is that existing infrastructure can be used as beacons e.g. WiFi routers [4].
Localization is also possible with measuring the time-of-flight of the radio-waves.
Solutions presented in [5], [6] measure the required time to travel a signal between two radios.
The accuracy can be increase with the combined measurements of the time and phase. The main drawback of the radio-wave ToF method was the special, expensive, high speed measurement hardware. In the past few years, however, inexpensive commercial measurement devices have become available [7].
Economic beacon-free solutions can be provided e.g. for smart phones using image processing techniques: room-level localization was proposed using simple graphical markers [8]. The environment itself was used as a generalized marker in [9]: a picture taken by the camera was compared to pictures stored in a data-base, containing a large set of reference images, to detect the current camera location.
Localization can be performed with measuring or calculating the direction and length of the movements. The system presented in [10] is a pedestrian dead reckoning solution, where inertial sensors utilized for short range positioning. Note that, due to the accumulation of the localization error, these systems utilize other localization methods to periodically correct these deviations. In [10] a combined approach was used, where WiFi signal strength measurements were utilized to decrease the accumulating error of the dead reckoning.
Light based approaches utilize LEDs as anchors, which can be installed as a part of the lighting infrastructure. The ranging is performed either by light intensity measurements [11]
or using image processing techniques [12] to estimate the position of a camera. In these systems visible light communication (VLC) is utilized to transmit the identifier of beacons.
A completely new approach utilizes radio interferometry, which provides measurement results that can be considered as generalized distances [13], [14]. Although the radio interferometric approach provides potentially high accuracy localization, due to its novelty its
7 properties and potential application fields have not yet been investigated thoroughly. The main part of this dissertation contributes to this research area.
2.3. Interferometry in measurement systems
Measurement systems using optical interferometry are utilized in a wide range of applications, from precision manufacturing to medical applications, to measure small displacements with high accuracy. Such measurement systems produce interferometric signals, where the phase change corresponds to the displacement to be measured. Recently in [15] a homodyne measurement system to characterize piezoelectric actuators has been proposed, while in [16] a heterodyne interferometric measurement system has been introduced for semiconductor manufacturing. For surface contouring laser diode speckle interferometer was proposed in [17]. In medicine, chest wall displacement was measured using laser interferometry [18]. For speed measurements from larger distances (up to 10m) a self-mixing interferometer with frequency domain signal processing was proposed in [19].
Interferometry is widely used in radio astronomy, where radio emissions from distant celestial objects are observed. The angular resolution of conventional radio antennas is greatly increased by synthesis telescopes, where signals from arrays of telescopes are combined [20].
Radio-interferometry is also utilized in low-distance telemetry: high precision distance measurements up to 50m using frequency-scanning interferometry was proposed in [21], while dispersive interferometry was successfully used for measurements of sub-millimeter distances [22].
In [23] a measurement method was proposed, which can determine the speed profile of a radio transmitter, moving along a known linear trajectory. The measurement system utilizes one moving (tracked) transmitter, emitting a carrier wave, and two fixed receivers, which produce the interference signal used to determine the actual speed of the transmitter. More general architectures were proposed for radio-interferometric positioning and tracking, where multiple transmitters and receivers were utilized to determine the location of an object (a receiver, in these cases) in two or three dimensions. The foundation of these methods was laid in [13], which will be detailed in Sections 2.3 and 2.4.
2.4. Radio-interferometric localization
Instead of using high frequency signal processing, Radio-Interferometric Positioning [13] processes low frequency interference signals, generated by radio-interferometry. In the measurement setup, shown in Figure 5, four nodes, referred to as quad, are used. Two nodes
8 (A and B) are used as transmitters to create an interference, while two receivers (C and D) measure the interference signal, as shown in Figure 5. The transmitter frequencies are approximately the same thus the interference signal has a low frequency envelope, with beat frequency | |.
Figure 5. Radio-interferometric phase measurement
The envelope of the interference signal is sensed as the RSSI at the receivers C and D, which measure the phase difference of the detected RSSI signals, which depends on the relative locations (called quad-range) of the quad elements, as follows [13]:
, (1)
where is the wavelength of the signal, is the speed of light, and quad-range is defined as follows:
, (2) where is the Euclidean distance between nodes X and Y, as shown in Figure 5.
The modulo operation in (1) is the main challenge in radio-interferometric localization:
the exact quad-ranges cannot be computed from one measurement . In [13] the ambiguity problem was solved by using multiple carrier frequencies and thus multiple values, but this solution requires large amount of computations and is sensitive to phase errors.
In the radio-interferometric measurement process there are several error sources which can affect the accuracy of the localization. These sources are identified and discussed in details in [13]. The error sources are the following:
Carrier frequency inaccuracy: the two transmitters emit slightly different ( ) carrier frequencies, which affect the phase estimation and the distance calculation. However this frequency deviation is several order smaller than the carrier frequency, thus represents a negligible error source in real application scenarios.
9 Carrier frequency drift and phase noise: the interferometric measurement process relies on the fact that the carrier frequencies, and thus the interference, is stable. This stability can be achieved with short measurement times and by minimizing the chance of abrupt thermal changes and mechanical shocks.
Multipath effects: these effects can cause disruption in the interference signal, which results in erroneous or missing phase measurements. Such measurement errors result in significant localization error. In the literature so far there has been no solution proposed to mitigate this effect. The contributions presented in Sections 3 and 4 provide novel robust and fault tolerant estimation methods.
Antenna orientation: theoretically orientation and antenna shape can be a source of a negligible error, but empirically this was not verified. However the antenna radiation pattern and the orientation can drastically modify the interference signal amplitude, thus lowering the signal-to-noise ratio.
RSSI measurement delay jitter: this jitter introduces a relative phase offset error, however in real measurements the effect is not noticeable.
RSSI signal-to-noise Ratio: the signal-to-noise ratio of the recorded RSSI values depend on the distances of the devices and also on other physical properties, e.g. antenna orientation, receiver hardware.
Signal processing error: this type of error highly depends on the utilized phase estimation algorithm. In Section 5 a distributed phase estimation method is proposed, which can achieve good accuracy, despite the low computation cost and low resource requirements.
Time synchronization error: time synchronization is a crucial point for the phase difference measurement. It can be achieved with appropriate time stamping of the control messages sent to the measurement devices. A potentially more accurate method is presented in Section 5.2.3 which utilizes the interferometric signal itself for synchronization.
In Sections 3 and 4, novel radio-interferometric tracking solutions will be proposed. The new methods provide tracking, instead of solving the localization problem, with increased speed and robustness.
2.5. Phase difference measurement
Phase difference measurements are essential in radio-interferometric localization and tracking. In such applications two radio transmitters generate the interference signal (see
10 Figure 5). The interference signal has a low-frequency envelope (the frequency of the beat equals to the frequency difference of the two transmitters). The signal envelope is in fact the RSSI signal, which can be measured in most radios. Radio-interferometric localization algorithms measure the RSSI phase difference between pairs of receivers, and from these measurements the location of a tracked receiver can be computed. The fundamental measurement is illustrated in Figure 5, where two receivers A and B simultaneously measure the interference signal and from the time delay between the signal envelopes the phase difference is computed. Notice that in this application not the phase of the high frequency carrier wave is measured, but rather the phase of the low frequency envelopes, which allows the utilization of low-cost devices.
The challenges of phase measurement in the target application field are the following:
a) the measured signal is highly variable (e.g. due to fading, or movements around the devices),
b) measurement devices are wireless, with no wired link anywhere in the system,
c) the measurement devices must be small and inexpensive, only one central node has high computing capability,
d) the measurement must be as fast as possible, to allow frequent measurements and thus good quality tracking,
e) the transmitted measurements must be of small size, due to the rather limited communication bandwidth,
f) the measurements must be continuously repeated as fast as possible with different pairs of receivers.
Due to the above limitations raw measurements cannot be transmitted, thus the signal processing must be performed in place, on the measurement devices. A low complexity processing algorithm is required, which can efficiently be executed on the low-end devices.
Since in real applications the measurements involve several quads, the measurements must be scheduled in time, and the schedule must be as tight as possible, in order to provide high responsiveness of the system.
11
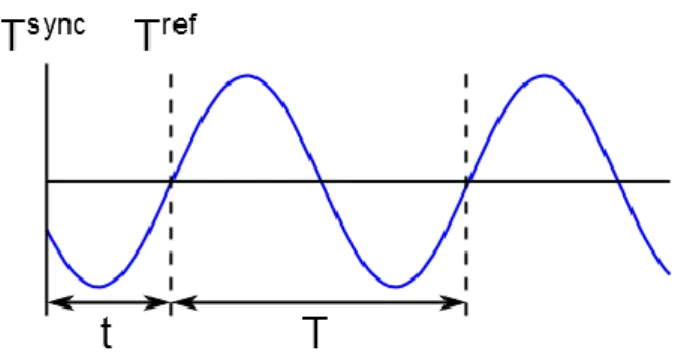
Figure 6. Definition of phase and a possible measurement method of the phase of a signal.
Frequency and phase measurement of periodic signals is a widely studied field. The classical definition of phase can be seen in Figure 6, which also illustrates a possible measurement method. If and are measured, where is the period length and is the time between a time synchronization point and a signal reference point (in the example of Figure 6 the signal reference point is defined as the time instant when the rising edge of the signal crosses zero), then the phase is defined as
(3)
Such simple measurements are often used when the signal-to-noise ratio is high and the accuracy requirements are modest, e.g. in [13]. For higher accuracy, other time domain methods also exist in large number. The method proposed in [24] uses digital sampling of high resolution voltmeters to provide accurate harmonic and phase estimation of two low- noise, low-frequency signals, with primary application of power line measurement. In [25]
least-square fitting is analyzed for the amplitude and phase estimation of periodic components of a signal. In [26] digital filters are used to suppress higher harmonics to provide accuracy below 1mrad.
A large range of phase measurement techniques use frequency domain. For spectral estimation the Fast Fourier Transform (FFT) is widely used (e.g. [27]). Several enhancements were proposed to decrease the effect of leakage and thus increase accuracy, e.g. windowing [27], synchronous or quasi-synchronous sampling [28], iterative methods [29], just to name a few. An alternative method, which reduces phase error, and the computational complexity is similar to that of the FFT, was proposed in [30]. Resonator-based digital filter banks [31] and PLL-like adaptive filter banks [32] were also proposed for real-time and high accuracy measurements of periodic signals.
The above mentioned solutions focus on the accuracy of the phase and frequency measurement in contrast to the computation cost on the device. The target application requires
12 low complexity algorithms and fast measurement on the devices, meanwhile enables post- processing on the host computer (distributed computation). Phase measurement methods in the frequency domain require transformation from the time domain, which is a computationally intensive task, while filter banks require several periods to settle to the correct phase and frequency, causing longer signal sampling periods. Time domain, statistical solutions (e.g. correlation, least-square fitting) also require excessive computation. Note, that most of the simple solutions (e.g. the zero-crossing detection demonstrated on Figure 6) are also not capable of producing appropriate phase estimation, which can be used for phase difference measurement: on different devices the measured signals can be distorted in different ways, which causes different, non-comparable reference points (see e.g. Figure 58 for a real measurement).
In Section 5 a novel measurement setup will be proposed, which can accurately estimate the phase difference between signal envelops, measured on two devices, even in the presence of noise. The proposed distributed computation method can be executed on simple devices with low computational complexity and without floating point operations, and requires very low communication bandwidth. The system also includes support for fast measurement scheduling.
2.6. Phase unwrapping techniques
Typical application area of one dimensional phase unwrapping is when the full phase of a signal spectrum is required. Such requirement arises in a wide range of signal processing problems, from speech processing and synthesis to EEG processing.
Let be a continuously real-differentiable complex valued function, the phase of which is denoted by . The phase can be calculated as
( ) , (4) where is the extended arctan function, is an arbitrary integer, and and are the real and imaginary parts of , respectively. Due to the phase ambiguity in (4), the phase value is often represented by its wrapped or principal value , which is restricted to a predefined 2 -long range, e.g. , thus , or . The calculation of the true phase value from the principal value is called unwrapping, defined by the unwrapping integral. For this purpose let us define unwrappable intervals. The interval is called unwrappable if . Then the unwrapping integral is defined as
13 ∑ ∫ , (5) where is the gradient of and by definition. Notice that the unwrapping process is performed piecewise through the unwrappable intervals to produce the full integration interval ∑ .
In practical cases is known at discrete grid ; and the true phase values are searched for in the same grid. Let us denote the discrete phase samples by ( ) and ( ) Assuming that Shannon’s sampling theorem is fulfilled for the sampling grid, i.e. | | , discontinuities in the principal phase record mean transitions between unwrappable intervals. Thus a straightforward unwrapping method can be performed by Detecting and Correcting Discontinuities (DCD) in the principal phase record, as follows [33]:
First the gradient of is calculated:
, (6) then the correction terms are determined:
(7) where is an integer value. The unwrapped phase is then calculated for , as follows:
∑ . (8)
The applicability of DCD method is universal where sampled principal phase values are available. However, the DCD method assumes that the samples are “dense” enough, .i.e. the sampling theorem is fulfilled. This is not always the case, which is addressed by the Adaptive Numerical Integration (ANI) method [34].
The ANI method calculates the unwrapped phase values similarly to DCD, but ensures that the principal value samples are dense enough, using a discrete approximation (trapezoidal integration formula) of the unwrapping integral of (5) for checking. If the calculated integral is inconsistent with the measured phase values (i.e. the phase gradient changes too much between two points of the grid), the adaptive mechanism doubles the density of the grid, and thus halves the integration step-size. The adaptation mechanism of ANI increases the sampling frequency until the principal phase values are provided with sufficient density. In
14 the typical application (cepstrum calculation) of ANI the change of sampling frequency is possible, since the data points are generated by FFT, the width of which can be adaptively changed. However, in several applications (including radio-interferometric tracking) the principal phase values are generated by a measurement process with predefined sampling frequency, where there is no way to generate more measurement points on demand.
Other approaches were proposed in both the time and frequency domain. For applications where the data can be efficiently modelled as an output of an autoregressive moving average (ARMA) process, the Polynomial Factoring method can be applied. This method first identifies the process, i.e. calculates the roots of the model polynomials. Once the model is known, the exact spectrum (including the phase) can be computed on the unit circle [35]. The correcting factor can directly be determined from the time domain data as well.
Using Sturm’s Theorem, the integer value in (7) can be calculated. The method, proposed in [36], uses Sturm polynomials to calculate at any frequency.
Imaging applications, such as Synthetic Aperture Radar [20], Magnetic Resonance Imaging [37], or profilometry [38], utilize two or three-dimensional (from now on n-D) phase maps, where the unwrapping problem is analogous to the 1-dimensional case: the input phase map contains the principal phase values on an n-D grid and the goal is to provide the unwrapped phase values. The function can now be defined as . Instead of unwrappable intervals, now represent unwrappable paths in the domain of . Formally, the unwrapping process is performed again by the unwrapping integral (5): from a reference point , using (5), the full phase of any other point can be calculated. A major difference between the 1-D and n-D case is that now there are multiple choices to reach from (since several possible paths exist between points and ). If there are no phase singularities [37] present (caused either by noise or natural discontinuities in the data, e.g. an outline of a hill in front of the background in an SAR image), the evaluation of (5) along any of the possible paths provides the same result for . However, in the presence of phase singularities, different paths may provide different results. The core problem of n-D phase unwrapping is the correct choice of the integration path so that the result be meaningful.
In n-D domain several approaches are used to identify and avoid phase singularities during phase integration, including least-squares methods [39], brunch-cut algorithms [40], pattern analysis [41], or optimization methods based on flow cost minimization [42].
15 In radio-interferometric tracking, phase measurements are given above a two- dimensional plane, but these measurement values are known only along the object trajectory (as opposed to full 2-D representations, as in SAR), thus the problem is inherently one dimensional. Since multiple measurements are performed at the same time (each measurement corresponding to a quad), 1-D unwrapping must be performed for each measurement sequence. Notice, that phase measurements of the different quads are not independent, since they belong to the same object trajectory, thus this piece of information may be utilized to increase the accuracy. The simultaneous phase unwrapping problem (which will be addressed in Section 3.2) is a new class of the unwrapping problems, which, to the best of my knowledge, has not been discussed in the literature yet.
16
3. Radio-interferometric tracking based on phase-unwraping
General localization techniques are able to provide position information of the localized object in every time instant. When a priori information is available on earlier positions of the object, tracking solutions can be used. This chapter will discuss solutions related to tracking, e.g. the initial position of the object is assumed to be known and the movement of the object is tracked in time by successive measurements.
The system uses fixed reference nodes (transmitters and receivers) and arbitrary number of tracked receiver nodes. For sake of simplicity I will discuss only the case of one tracked node, but the proposed solution can trivially be extended to any number of tracked devices.
3.1. Basic hyperboloid-based tracking
In this section I will discuss the Basic Hyperboloid-based Tracking (BHT) algorithm in one dimension, then I will extend the method to higher dimensions to provide a location estimation, and finally I will introduce a location estimator using redundant measurements, which provides better accuracy and robustness against phase measurement errors and distortions.
3.1.1. Tracking in one dimension
For tracking in one dimension, two fixed transmitter nodes (A and B) and one fixed receiver node C is used, while the tracked receiver is denoted by D (see Figure 5). The transmitters utilize a single carrier frequency (as opposed to multiple frequencies in [13]) and the receivers continuously monitor the phase difference The quad-range is calculated. According to (2), the solutions for the position of moving node D are located on a set of hyperboloids (hyperbolas in 2D, as illustrated in Figure 7). When a value is measured, the associated quad-range determines the possible positions of D. In Figure 7(a) for illustration purposes hyperbolas corresponding to phase values are shown. Note that from one measurement there is no way to determine on which of the possible hyperboloids D is located (i.e. is unknown), and even if the particular hyperboloid was knew, it is impossible to tell where on the hyperboloid D is exactly located.
17
Figure 7. Basic radio-interferometric tracking with fixed transmitters A, B, A’, B’, fixed receiver C=C’, positioned at the center (not shown for clarity), and moving node D. (a) The generated phase pattern by transmitters A and B: hiperbolas corresponding to phase values are shown. The trajectory of
the moving object is shown by thick line, the origin is assumed to be known, (b) the measured phase difference values between nodes C and D, (c) phase correction values, (d) unwrapped phase values, (e)-
(h) independent measurement with transmitters A’ and B’, (i) tracking using the phase esimates of the two measurements. The trajectory estimate is shown by the dotted line.
Assuming that the original location of D is known and the motion of the object is relatively slow, i.e. the successive phase measurements have a difference smaller than then the actual hyperboloid can be selected, based on the expected continuity assumption, using the estimated hyperboloid at the previous time instant, as follows. If the known phase in time instant is and the measurement in time instant results the ambiguous phase values
, then the closest possible value to is selected:
18 | | (9) Note that the underlying problem here is in fact the well-known phase-unwrapping problem (see Section 2.6). In Figure 7(b) the phase measurements are shown in the range of , while Figure 7(c) shows the phase correction values, according to (9), resulting the unwrapped phase measurement in Figure 7(d).
Knowing the exact phase value, the actual hyperboloid surface can be identified, using (1) and (2). Thus with a series of measurements the hyperboloid surfaces, on which the moving node D is located, can be tracked. However, the exact location of D on the hyperboloid is not known yet: for this purpose multiple independent quad-ranges will be used.
3.1.2. Tracking in higher dimensions
If in addition to node triplet A,B,C another node triplet A’,B’,C’ is used then two quad- ranges and can be measured, as shown in Figure 7(a) and Figure 7(e). Note that node triples A, B, C and A’, B’, C’ may be composed of physically different nodes or alternatively may contain the same nodes but in different roles: e.g. a possible solution is A’=A, B’=C, C’=B.
Using two quad-ranges, two independent one-dimensional tracking can be simultaneously performed, as described in the previous section. In each time instant each tracking identifies a hyperboloid surface on which node D is located. In Figure 7 the left and right columns represent the two independent trackings. Naturally node D is located in the intersection of the two hyperboloids, thus if the node is moving on a plane (in 2D), the node’s location can be calculated as the intersection of the two hyperbola, as illustrated in Figure 7(i).
For 3D localization three independent quad-ranges are necessary, for which at least four fixed devices must be used, out of which three independent triplets can be chosen.
The tracking infrastructure required for the tracking will be discussed in Section 3.1.3, while the utilized phase difference measurement solution will be discussed in details in Section 5.
3.1.3. Tracking infrastructure
For measuring several independent quad-ranges an appropriate tracking infrastructure is required. The infrastructure contains transceivers at known positions, which can either play the role of transmitters to generate interference signals at the receivers, or receivers to allow phase difference measurements, as described in Section 2.4. The tracked node is always a
19 receiver. Infrastructure nodes alter their roles, thus different interference signals can be generated. The measurements are scheduled using TDMA: different time slices are allocated for each quad-range.
A simple measurement uses three infrastructure nodes (two transmitters and one receiver) and the tracked receiver node, in a measurement configuration. The four nodes in the configuration can measure a phase difference value , which depends on the positions of both the infrastructure nodes and the tracked node. Such simple measurements are carried out with different configurations, to provide a measurement round, containing simple measurements. The measurement results of a complete round will be used as inputs in each step of the tracking algorithm.
Figure 8 illustrates a scenario with four fixed nodes A, B, C, D, and one tracked node X.
In this case possible configurations exist, as shown in the table of Figure 8.
Figure 8. An example tracking infrastructure with for fixed nodes (A, B, C, D) and one tracked node (X).
The possible configurations are listed in the table.
3.1.4. Utilizing redundant phase measurements
The object tracking method, introduced in Section 3.1.2, calculates the object location as the intersection of two hyperbolas. This solution, however, is very sensitive to phase unwrapping errors, as illustrated in Figure 9. The robustness of the method can be increased by utilizing redundancy, namely with more quad-range measurements: the over-determined system is more resistant to bad or missing measurement values.
20
Figure 9. Estimating an object position (p) with two hyperbolas h1 and h2, generated by the transmitter pairs of B, C and A, B, respectively. Hyperbola h1’ is the result of an incorrect phase estimation
resulting incorrect position estimate p’.
In my proposed solution multiple hyperbolas are used. For the position estimation with multiple hyperbolas the following error function is specified for a given point :
∑ (10)
where is the distance between point and hyperbola .
The distance is the minimum Euclidean distance between the given point
and the hyperbola , formally defined as
(√ ( ) ), where are the points of the corresponding hyperbola.
The optimal estimated position ̂ ̂ is located where the error function has its minimum (Figure 10):
̂ ̂ (11) Note that in the proposed BHT method neither the redundant phase measurements nor the utilized error function can detect or correct the unwraping phase errors introduced by erroneous or missing measurements. Thus this solution may produce large bias in the presence of bad quality measurements. In the next section a novel phase unwrapping technique will be proposed, which is robust against unwrapping errors.
21
Figure 10. Using multiple hyperbolas the localization is performed by a minimum search on an error surface.
3.2. Simultaneous Phase Unwrapping
The goal of the proposed Simultaneous Phase Unwrapping (SPU) is to enhance the robustness and accuracy of the unwrapping process, applied to the measured (wrapped) phase signals. Other methods, which have extra information on the phase signal, successfully apply signal models and thus make the estimator more robust, e.g. in [35], [43]. In our application such knowledge on the individual phase measurements is not available, but another type of constraints can be applied here as well: the phase signals measured in parallel reflect the same (but unknown) location of the tracked object.
The Simultaneous Phase Unwrapping problem in 1-D can be formalized as follows.
Discrete time series of wrapped phase values are determined from separate measurement channels, where denotes the principal phase measurement from measurement channel , at time instant . The set of past measurements , for , are given, and a cost function is applied, which measures the consistency of the full phase values. The full phase values are determined by minimizing , such that , where correction parameters are integer multiples of . The cost function is application specific and may also be influenced by the utilized optimization method. For radio-interferometric tracking a special cost function will be defined in Section 3.3.
The block diagram of the system is shown in Figure 11. The individual one-dimensional wrapped phase sequences are fed to DCD unwrapping blocks, where the unwrapping procedure in each channel is performed according to (6)-(8). Note that the value of depends on measurements and state variables . After the initial unwrapping by the DCD blocks, at each time instant , based on the actual cost function, the optimizer block readjusts the last correction parameters as , where
22 is an integer. The optimizer tunes parameters , , until it finds the smallest cost function:
( ( ) ( ) ( )). (12) For radio-interferometric tracking a fast and approximate solution of (12) will be proposed in the next section.
Figure 11. Block diagram of the phase unwrapping system
3.3. Fault-tolerant hyperboloid-based tracking
The BHT algorithm in Section 3.1 utilizes full phase values, thus the quality of the position estimator greatly affected by potential unwrapping errors. According to the sampling theorem, if the phase difference between consecutive phase samples and is smaller than then the unwrapping can be performed unambiguously (see Section 3.1.1).
However, in practical applications several error sources may be present, which can cause the violation of the sampling theorem:
Phase measurement errors: The distribution of the measured phase difference error was measured, with normal human movement in an indoor measurement area (for detailed description of the measurement see Section 5.3.2). The distribution of the phase error can be approximated with a zero mean Gaussian distribution with standard deviation of . Since this value represent nominal circumstances only, it is not very unlikely that additional disturbances may cause larger errors and thus violate the sampling theorem. Interference resulting from devices emitting radio waves around the measurement frequency may also cause phase measurement errors.
Fast object movement: Moving targets cause phase changes during their movements. If the speed of the tracked object is and the phase sampling frequency is then the object covers distance between two samples, which cannot be more than , corresponding to phase shift of in worst case. This implies the constraint on the speed of the object:
(13)
23 If constraint (13) is violated, the sampling theorem may also be violated. Notice that this source of error affects all of the measurement channels and thus cannot be eliminated by the proposed method.
Missing samples: The communication mechanism of the proposed measurement system allows packet losses. If measurement results are missing, the sampling theorem may be violated on some channels. In practical situations this is the main error source.
The above effects, or their combination, can cause phase unwrapping errors, which may result in permanent error of ( is integer) in the corresponding full phase value, causing a permanent localization bias. To handle the occasional phase unwrapping errors, a novel Fault- tolerant Hyperboloid-based tracking algorithm (FHT) is proposed, utilizing SPU. The proposed algorithm detects and corrects phase unwrapping errors, assuming that the number of error free phase measurements is significantly larger than the ones containing unwrapping errors.
Notice that when an erroneous phase estimate is present then the distance of the corresponding hyperbola from the estimated location becomes large. Analogously, large value indicates that the corresponding has potentially large (possibly unwrapping) error. The proposed algorithm uses this idea to detect and correct phase unwrapping errors.
The SPU scheme, proposed in Section 3.2, is utilized in the improved radio- interferometric tracking (FHT). The application-specific cost function , which quantifies the relationships between different channels of phase measurements, in the radio- interferometric tracking application is defined as
̂ ̂ , (14) where the error map is the following:
∑ , (15)
where is the Huber loss function with parameter as follows:
| |
| | (16)
Notice that in the Huber function is used, which is less sensitive to outliers than the square error (which is used e.g. used in (10)), due to its linear nature for higher input values.
Parameter should be chosen to reflect the expected range of for correct measurements.
24 In the proposed system was used. The flowchart of the tracking algorithm can be seen in Figure 12. At time instant , using quads, a set of new phase difference measurements are collected in the range of . Then the phase values are unwrapped, using DCD equations (6)-(8), resulting full phase values in the range of . In the next step the error surface is generated using (15), and the initial position estimate ̂ ̂ is calculated using (14). If there are potentially incorrectly unwrapped phase values then in the following steps the algorithm tries to detect the misplaced hyperbolas and correct the corresponding phase values. At first (Step Select Worst Hyperbola) the hyperbola is selected, such that
̂ ̂ (17)
where is the distance between hyperbola and the estimated position ̂ ̂ Then in Step Correction two new trial correction terms and are generated. With these correction terms the full phase values and the associated error surfaces are recalculated using (15). The next step (Select Best and Update) evaluates the initial and the corrected error surfaces and selects the one with the lowest minimum value. The correction term and the corresponding unwrapped phase value is permanently updated with the one producing the best result. The position estimate ̂ ̂ is calculated using (15) and (14). The correction phase is repeated times, i.e. at most erroneous phase measurements are corrected at a time instant. In rare cases, when the number of simultaneous erroneous phase values is higher than , the corrections are made in subsequent time instances.
Figure 12. Flowchart of the Fault-tolerant Hyperboloid-based Tracking (FHT) algorithm
25 The pseudo code representation of the tracking algorithm can be seen in Figure 13 for a single time instant . The unwrapped phase values are denoted by p1..pm. The calculate_error function implements the application specific cost function defined in (14) and returns the minimum cost value and position. The calculate_distances function computes the
distance between hyperbolas and the estimated position (x, y).
Figure 13. Pseudo code of the Fault-tolerant Hyperboloid-based Tracking (FHT) algorithm
3.4. Evaluation
In this section the proposed concept of the basic and fault-tolerant hyperboloid-based tracking (BHT and FHT) will be evaluated using simulations and real measurements. First a theoretical error analysis method will be shown then the simulation results will be introduced and finally real measurements will be presented. The effects of the various node placement will be also examined.
3.4.1. Error analysis
The location estimate is given as the intersection of two hyperbolas. When measurement noise and inaccuracies are present, the hyperbolas become inaccurate (i.e. the hyperbolas are moved from the ideal position, see e.g. Figure 9). The intersection of two inaccurate hyperbolas results an inaccurate location estimate. In order to characterize the localization error, let us use the following linearized model (see Figure 14):
1. P0 = {p1 .. pm} // set of 𝜙𝑚 𝑘
2. Hchecked = {} // set of already checked hyperbolas 3. [cost, x, y] = calculate_error(P0) // see (14) and (15) 4. [d1..dm] = calculate_distances(P0, x, y) // see (17) 5. WHILE |Hchecked| < MMAX DO
6. j = argmaxi( d1..dm ), where j Hchecked // Select Worst 7. P+ = (P0 \ pj) pj + 2π
8. P- = (P0 \ pj) pj - 2π
9. CHOSE Pnew {P0, P+, P-} FOR WICH cost IS MINIMAL, WHERE 10. [ncost, nx, ny] = calculate_error(Pnew) // see (14) and (15) 11. [nd1..ndm] = calculate_distances(Pnew, x, y) // see (17) 12. cost = ncost
13. x = nx 14. y = ny
13. d1 = nd1, d2 = nd2, … , dm = ndm 14. P0 = Pnew
15. Hchecked = Hchecked j 16. END
16. END