R E S E A R C H Open Access
Homogenization with coherent light illuminated beam shaping diffusers for vision applications: spatial resolution limited by speckle pattern
Bence Kondász1* , Béla Hopp1and Tomi Smausz1,2
Abstract
Background:Homogenizing properties of beam shaping diffusers illuminated with coherent laser light was studied with special regard on their use in vision applications.
Experimental:Two diffusers projecting circular pattern at different scattering angles (Thorlabs Engineered Diffuser™) were illuminated with different spatial intensity distribution (elliptical Gaussian, nearly flat-top and granular multimode fiber output, respectively) collimated beams.
Results:The intensity distribution measured at high angular resolution with a CMOS sensor revealed the granular (speckle) pattern of the projected light having contrast of nearly 1. The smallest speckle size (highest speckle density) could be obtained at the largest aperture size using nearly flat-top and multimode fiber illumination.
Conclusion:As an important measure of the homogeneity for vision applications the apparent local contrast was calculated as the function of the spatial averaging. Although, the homogeneity requirements depend on the actual application, the usability of such diffusers in combination with coherent light sources is in general strongly limited in megapixel resolution imaging applications, unless time-varying speckle averaging methods can be applied.
Keywords:Beam homogenization, Beam shaping diffuser, Speckle pattern
Introduction
The laser beam shaping and homogenization is of high importance in various industrial, medical and scientific areas, including material processing, interferometric and vision applications, etc. Uniform intensity distribution (flat-top) can be created by various methods, e.g. or- dered or random microlens arrays, diffractive optical ele- ments, optical integrator setup [1,2]. While many of the homogenizing methods perform well with incoherent light sources or low coherence lasers (e.g. excimer la- sers), when the incident beam was coherent these methods results in interference or speckle (granular) pattern formation. In laser imaging systems (holography, projector, display, etc.) the speckle effect appears as
noise, therefore the speckle reduction is applied to achieve uniform illumination. The speckle suppressing techniques are mainly based on the following two ap- proaches: i) the speckle pattern to be averaged in time and/or space or ii) the illumination to be made spatially and/or temporally partially coherent or non-coherent [3]. The spatial averaging is based on image recording with pixel size (or binning windows) larger than the speckle size or Fourier filtering [4] of the speckle images, while the temporal averaging is based on recording of time-varying speckle patterns [3]. These latter methods are closely related to some of the coherence reduction techniques. The coherence can be reduced by using moving, rotating or vibrating optical elements (e.g. dif- fusers [5–7], diffractive optical elements [8], micromir- rors [9], multimode fibers or fiber bundles [10]), screen vibration [11], use of broadband lasers [12], multiwave- length illumination (e.g. mode hop of laser diode) [13],
* Correspondence:kondasz_bence@yahoo.com
1Department of Optics and Quantum Electronics, University of Szeged, Dóm tér 9, Szeged H-6720, Hungary
Full list of author information is available at the end of the article
© The Author(s). 2018Open AccessThis article is distributed under the terms of the Creative Commons Attribution 4.0 International License (http://creativecommons.org/licenses/by/4.0/), which permits unrestricted use, distribution, and reproduction in any medium, provided you give appropriate credit to the original author(s) and the source, provide a link to the Creative Commons license, and indicate if changes were made.
etc. There are applications (e.g. laser speckle flowmetry) where the coherence on the illuminated area should be maintained within the frame exposure time, therefore spatial averaging is the only applicable method if the speckle pattern formation cannot be is avoided.
Specially designed optical diffusers having micromachined surfaces covered with pseudorandom structures are available for creation of uniformly illuminated spots of various shapes (linear, circular, rectangular, elliptical, etc.) and scattering an- gles. Although, the best homogenizing efficiency can be achieved with low coherence light sources, they are often used in combination with coherent light sources [14–16].
The influence of the coherent nature of laser light on the homogenizing efficiency is often not emphasized by vendors, as compared to its significance, not to mention the lack of data. In this paper we investigate the hom- ogenizing properties of two beam shapers (Thorlabs Engineered diffuser™) projecting circular spot when illu- minated with collimated coherent light beams having different spatial distributions. We focused on the high resolution intensity distribution and the usability of co- herent light illuminated diffusers for vision applications.
Experimental The optical setup
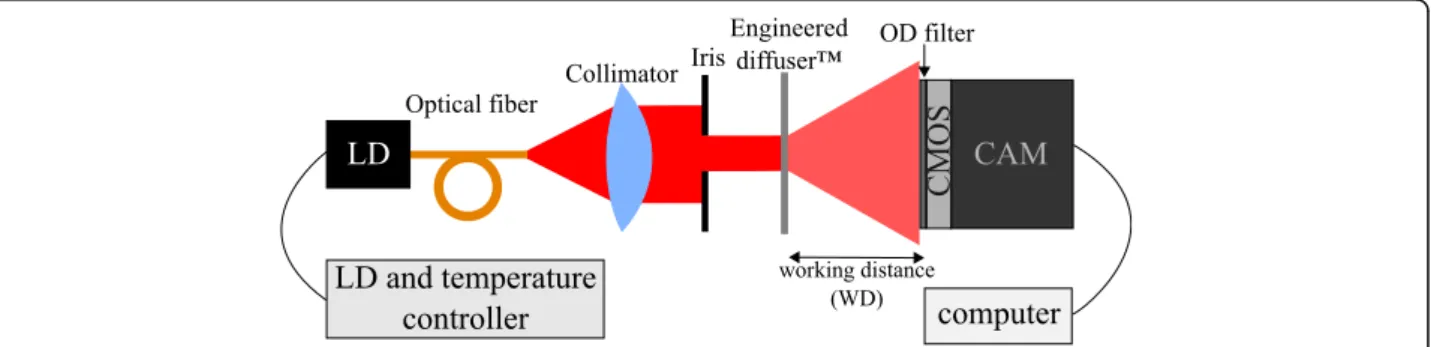
The optical setup used for studying the beam shaping and homogenization property of the diffuser is illustrated in Fig.1. The collimated laser beam of different spatial distri- butions fall perpendicularly onto the diffuser (Engineered Diffuser™, Thorlabs ED1-C20 and ED1-C50, circular pat- tern, 20° and 50° scattering angle, respectively) surface. The diameter (D) of illuminated spot (further referred as beam diameter) on the diffuser could be varied in 3–18 mm range with an iris placed in front of the diffuser. The pattern pro- duced by the diffuser was recorded at different working dis- tances (WD, 25 and 35 cm, respectively) by the sensor of an 8-bit industrial monochrome camera (Pixelink PL-B741F, Cypress IBIS 5B Global Shutter CMOS sensor, resolution 1280 × 1024, 6.7μm × 6.7μm pixel size) allowing high reso- lution imaging of the spatial intensity distribution. The gamma correction was set to 1 to assure the linearity
between the light intensity and grayscale level and the cam- era flat field correction function was set to eliminate the ef- fect of the variation of the pixel-to-pixel sensitivity of the CMOS sensor. Thus, at nearly homogeneous illumination at 50% grayscale level the relative standard deviation of the grayscale values was 1.2%, and induced error in the aver- aged contrast measurements was about 2%. The readout noise was not higher than ±2 LSB (Least Significant Bit) level at the highest applied exposure time (100 ms), its ef- fect was minimized by averaging consecutively captured images. A neutral density filter was placed in front of the camera to adjust the detected light intensity, while the background (ambient light) was recorded and subtracted from the images.
The light source was a laser diode (λ= 660 nm, 130 mW peak power, Mitsubishi ML101J27) operated in constant current mode (Thorlabs LDC220C), while the temperature was stabilized (Thorlabs TED200C) to avoid the wavelength drift and mode hops. Three types of col- limated beams having different spatial distributions were produced: i) elliptical Gaussian profile obtained by colli- mating the diverging output of the laser as to nearly fill the 18 mm diameter aperture; ii) a nearly flat-top trans- versal distribution over the area of interest was obtained by expanding the center zone of Gaussian beam profile;
and iii) coupling the laser light into a multimode (MM) optical fiber (Thorlabs FT400EMT, NA = 0,39, Ø440 μm core diameter, length 1 m) and collimating the highly di- verging output as to produce a multimodal transverse profile on the diffuser.
The recorded images were processed by our software developed in National Instruments LabView environment.
Speckle size/density measurement
The speckle size can be measured by two methods: blob detection and autocovariance calculation. The blob detec- tion is based on the thresholding of grayscale images for transformation into black and white images, where the speckles appear as black (or white, depending on the set- tings) spots which can be counted and their size mea- sured. The disadvantage of the method is strong influence
Fig. 1The optical setup used in measurements with optical fiber. A version with direct collimation of the laser output was also used
of the threshold setting onto the measured size, however the method offers a very quick and exact method for the calculation of speckle number or speckle density.
The second method, the autocovariance calculation is based on the speckle statistic. The normalized autoco- variance is [17].
cðΔx;ΔyÞ ¼RðΔx;ΔyÞ−hI x;ð yÞi2 I x;ð yÞ2
−hI x;ð yÞi2 ð1Þ
where R(Δx,Δy) is the autocorrelation, I(x,y) is the in- tensity map and 〈 〉 corresponds to the spatial average.
The autocorrelation function is defined as [17].
RðΔx;ΔyÞ ¼hIðx;yÞIðxþΔx;yþΔyÞi ð2Þ
The vertical ( R(Δx, 0) ) and horizontal (R(0,Δy)) auto- correlation functions have a peak centered at R(0, 0) =
〈I(x,y)2〉which can be fitted with Gaussian function and their FWHM corresponds to the average speckle size. For a circularly symmetric arrangement the speckle size for the vertical and horizontal direction has to be similar. The method gives accurate results for speckle size determination. The disadvantage of the method is the longer calculation time and the dif- ficulty of peak fitting with small error if the speckle size is close to the pixel size.
Inhomogeneity
The uniformity of an intensity distribution in most of the practical applications (e.g. machine vision) is well characterized by contrast or Michelson visibility:
C¼ Imax−Imin
ImaxþImin ð3Þ
where Imax and Imin are the maximum the minimum local intensities, respectively, within an area of interest, in our case areas much larger than the speckle size. The larger is the contrast, the higher is the visibility of the speckle pattern and the less homogeneous is the inten- sity distribution. The sensor area was divided in 100 pixel width domains, which are much larger than the speckle size and the local contrasts values measured on the domains were averaged.
Result and discussion
The intensity distributions of the collimated beam on the diffuser surface
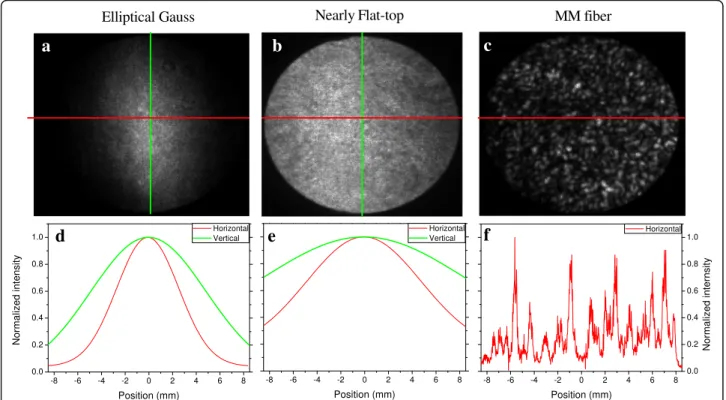
The plane of the diffuser was imaged with the camera by adjusting the imaging optics as to eliminate the effect of the subjective speckle. The intensity distributions along the ver- tical and horizontal axes on the iris plane are shown in Fig. 2. When expanding the center zone of the Gaussian beam (Fig.2b,e) in vertical direction the profile was nearly flat-top, however there is a larger variation of the intensity
a b c
d e f
Fig. 2The laser light intensity distribution in the plane of the diffuser obtained by imaging method (a, b, c)and the corresponding vertical (green) and horizontal (red) profile of the distributions (d, e, f)
along the horizontal direction. In case of the MM fiber illu- mination multimodal profile with uniformly distributed granular pattern can be seen (Fig.2.c,e).
Intensity distribution of the light projected by the diffuser
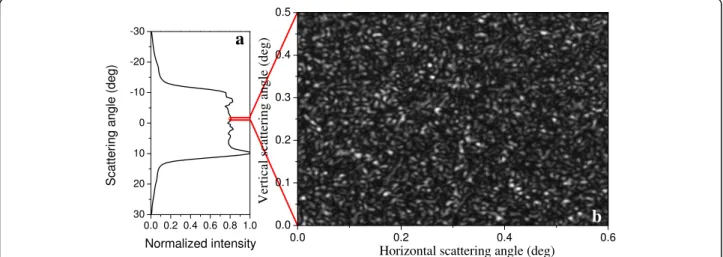
The diffuser projected a circular illuminated spot with an apparently near-homogeneous distribution of about +/−10% fluctuation in accordance with the distributor’s specifications (Fig. 3.). However, when placing the camera in the monitored projection plane, the higher angular resolution (the angle of view of the pixels from the diffuser was 0.092 and 0.069 arcminutes for the working distances of 25 cm and 35 cm, respectively) revealed the grainy (speckle) pattern of the intensity distribution (Fig. 3.) of all spatial intensity distribution.
Speckle density and size
The speckle densities measured by blob detection at 25 cm working distance are shown in Fig. 4. for the two diffusers illuminated with the different intensity profiles. It can be seen, that while the density increases with increas- ing the beam diameter, there is practically no dependence on the designed scattering angle of the diffuser. Meantime, the illumination of the diffuser with Gaussian intensity profile results in relatively low speckle density especially at larger beam diameters. At 35 cmWD the tendencies are similar with a multiplying factor of about (35/25)2in the speckle density values.
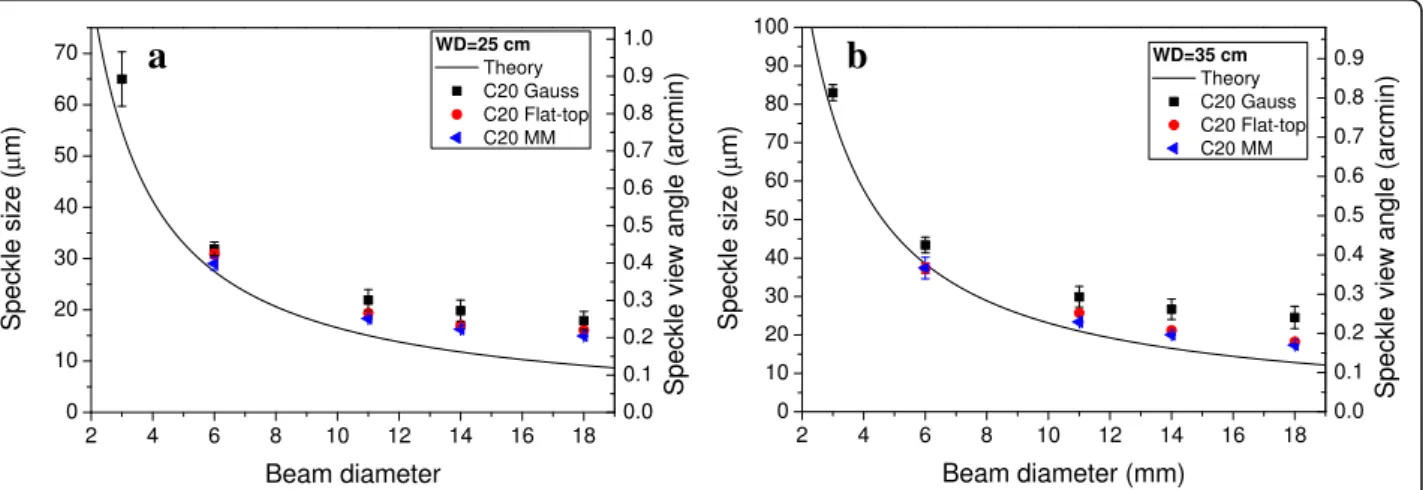
Figure 5. shows the speckle size obtained by autoco- variance measurements and the corresponding view angle from the plane of the C20 diffuser. Some of the measurement points at smaller D valued are missing since the decrease of the scattered light intensity became insufficient in case of MM and flat-top distributions.
The C50 diffuser showed similar behavior on the meas- urement point. The continuous plot is the curve corre- sponding to the theory derived by Goodman for the far field objective speckle size (d) in case of uniformly illuminated scattering surfaces [18]:
d≅λW D
D : ð4Þ
While in average there is a nearly inversely propor- tional decrease when increasing the diameter of the illuminating spot on the diffuser surface, the corre- sponding speckle sizes were practically similar for the flat-top and MM illuminations and slightly higher for Gaussian beam distribution. This indicates that the quickly decreasing Gaussian intensity distribution results in a smaller effective beam diameter, as compared to the other two illumination profiles. The measured speckle size is always higher than the model prediction, and the discrepancy between the theoretical curve and measured data becomes relatively larger as D increases. It has to be noted that in general the model gives us a reference value, the actual average speckle size is influenced by the statistical amplitude and phase distribution of the scattered light.
Contrast
The average contrast values measured on the sensor area are shown in Fig. 6. for C20 at 25 cm working distance.
The maximum contrast is nearly 1, which indicates a total extinction in the dark zones due to the coherence length much higher than the path length difference of the inter- fering waves. As the illuminated spot size increases the contrast becomes somewhat lower, which can be explained by the spatial averaging (undersampling) of the
b a
Fig. 3Typical angular distribution of the intensity (data provided by the distributor) when using C20 diffusers at 638 nm laser wavelength (a) [20]
and the local intensity distribution at high angular resolution recorded by the camera at WD = 25 cm and D = 6 mm (b)
speckle pattern as the size of the grains decreases [19]. In case of MM illumination there is a more significant jump in the contrast. A plausible explanation is the depolarization of the initially polarized light in the MM optical fiber (up to 10% in our case). The cross polarized light creates its own speckle pattern, and the result is the superposition of two patterns resulting in a decreased average contrast. This was validated by recording the speckle pattern with linear polarizer placed in front of the sensor in two orthogonal di- rections (↕and↔) and verifying the following equality [18].
σ h iI ¼
ffiffiffiffiffiffiffiffiffiffiffiffiffiffiffiffiffi σ2↕þσ2↔ q
I↕ þh iI↔ ; ð5Þ
where σ is the standard deviation and 〈I〉 is the mean value of the intensity within an area of interest.
The results show that the illumination of such dif- fusers with coherent light produces high contrast
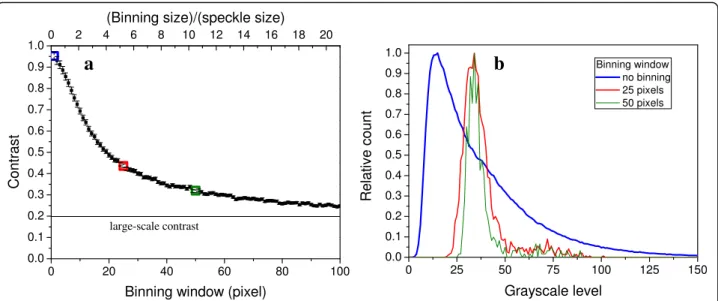
speckle pattern. For imaging applications one can obtain a relatively homogeneous (low contrast) inten- sity distribution only with proper spatial averaging of the pattern. As a simulation we applied pixel binning on the recorded images and calculated the average contrast, and intensity histogram as shown in Fig. 7.
While the measurements show a large-scale homo- geneity corresponding to a contrast of ~ 0.2, a pixel size (binnig size in our case) of about 10× the speckle size will result in a contrast value of ~ 0.3. In such conditions, in case of a flat-top illumination at largest clear aperture on the diffusers (~ 24 mm) the pro- jected spot could be imaged with a lateral resolution along the whole diameter of approximately 750 and 1900 effective pixels for C20 and C50 diffuser, respectively, suggesting the need of the largest scatter- ing angle diffuser for megapixel imaging applications.
We have to note that if the vision application uses gamma correction (e.g. visual perception), the visible
Fig. 4The speckle densities measured at 25 cm working distance for C20 and C50 as the function of the beam diameter illuminating the diffuser
a b
Fig. 5The speckle size and corresponding view angle graphs for 25 cm (a) and 35 cm (b) working distances in case of C20 diffuser
Fig. 6The contrast measured for C20 at 25 cm working distance as the function of beam diameter
contrast at higher grayscale levels will be smaller than the one calculated above.
Conclusion
The illumination of specially designed homogenizing diffusers with coherent light results in relatively good large-scale homogeneity, however the high resolution imaging reveals the grainy short-scale structure of the intensity distribution. The formed speckle pattern shows high contrast with total ex- tinction in the dark zones, in our measurements the size of the speckles nearly followed the λ·WD/D function, however, the exact values could be up to about 50% higher for high D values. The large speckle size is a significant drawback in vision appli- cations, where proper homogeneity can be obtained only with proper spatial averaging of the speckle pat- tern, i.e. the lateral resolution of the imaging system should be less, than the speckle size. Although, the actual homogeneity requirements may vary from application to application, a maximum spatial reso- lution of imaging system corresponding to about 10×
the speckle size can be a good approximation. The further increase of the resolution results in drastic- ally deteriorating local (short-scale) homogeneity.
This is a considerable limitation of their use in megapixel applications. As the speckle properties are independent of the designed scattering angle of the homogenizing diffuser, it is recommended to use the highest possible scattering angle diffuser, which results in a desired projected spot size in a shorter working distance. The surface of the diffuser should be illuminated at the full clear aperture. Due to the easy and high efficiency light coupling the large core
diameter MM optical fibers are often preferred for light guiding. As our results show, without disre- garding the above mentioned limitations, such diffusers are also suitable for homogenizing the multimodal output of these optical fibers without the application of temporal averaging homogenizing methods, such as the high frequency vibration of the fibers.
Abbreviations
CMOS:Complementary Metal-Oxide Semiconductor; D: Laser beam diameter;
d: Speckle size; I: Intensity; MM: Multimode optical fiber; WD: Working distance;λ: Wavelength
Acknowledgments
This research was supported by the EU-funded Hungarian grant EFOP-3.6.1- 16-2016-00008 and the János Bolyai Research Scholarship of the Hungarian Academy of Sciences.
Funding
See in the acknowledgment.
Availability of data and materials The dataset are available in the present paper.
Authors’contributions
All the authors made contribution to this work. BK built the optical system and performed the measurement. BK, BH and TS evaluated and interpreted the data and wrote the manuscript. All authors read and approved the final manuscript.
Competing interests
The authors declare that they have no competing interests.
Publisher’s Note
Springer Nature remains neutral with regard to jurisdictional claims in published maps and institutional affiliations.
Author details
1Department of Optics and Quantum Electronics, University of Szeged, Dóm tér 9, Szeged H-6720, Hungary.2MTA-SZTE Research Group on Photoacoustic Spectroscopy, University of Szeged, Dóm tér 9, Szeged H-6720, Hungary.
a b
Fig. 7Simulation of the effect of spatial averaging on the intensity contrast by pixel binning (a) and some representative intensity histograms (b) for C20 diffuser (Gaussian profile,D= 6 mm,WD= 25 cm)
Received: 23 August 2018 Accepted: 16 November 2018
References
1. Dickey, F.M. (ed.): Laser Beam Shaping: Theory and Techniques. CRC press, New York (2014)
2. Voelkel, R., Weible, K.J.: Laser beam homogenizing: limitations and constraints. In: Duparré, a., Geyl, R. (eds.) Optical Fabrication, Testing, and Metrology III. P 71020J (2008)
3. McKechnie, T.S.: Speckle reduction. In: Dainty, J.C. (ed.) Laser Speckle and Related Phenomena, pp. 123–170. Springer, Berlin, Heidelberg (1975) 4. Maycock, J., Hennelly, B.M., McDonald, J.B., et al.: Reduction of speckle in
digital holography by discrete Fourier filtering. J. Opt. Soc. Am. A.24, 1617 (2007).https://doi.org/10.1364/JOSAA.24.001617
5. Kasazumi, K., Kitaoka, Y., Mizuuchi, K., Yamamoto, K.: A practical laser projector with new illumination optics for reduction of speckle noise. Jpn. J.
Appl. Phys.43, 5904–5906 (2004).https://doi.org/10.1143/JJAP.43.5904 6. Kubota, S., Goodman, J.W.: Very efficient speckle contrast reduction realized
by moving diffuser device. Appl. Opt.49, 4385 (2010).https://doi.org/10.
1364/AO.49.004385
7. Pan, J.-W., Shih, C.-H.: Speckle noise reduction in the laser mini- projector by vibrating diffuser. J. Opt.19, 045606 (2017).https://doi.org/
10.1088/2040-8986/aa608d
8. Wang, L., Tschudi, T., Halldórsson, T., Pétursson, P.R.: Speckle reduction in laser projection systems by diffractive optical elements. Appl. Opt.37, 1770 (1998).https://doi.org/10.1364/AO.37.001770
9. Akram, M.N., Tong, Z., Ouyang, G., et al.: Laser speckle reduction due to spatial and angular diversity introduced by fast scanning micromirror. Appl.
Opt.49, 3297 (2010).https://doi.org/10.1364/AO.49.003297 10. Mehta, D.S., Naik, D.N., Singh, R.K., Takeda, M.: Laser speckle reduction by
multimode optical fiber bundle with combined temporal, spatial, and angular diversity. Appl. Opt.51, 1894 (2012).https://doi.org/10.1364/AO.51.001894 11. Shin, S.C., Yoo, S.S., Lee, S.Y., et al.: Removal of hot spot speckle on laser
projection screen using both the running screen and the rotating diffuser.
Displays.27, 91–96 (2006).https://doi.org/10.1016/j.displa.2005.12.002 12. Furukawa, A., Ohse, N., Sato, Y., et al.: Effective speckle reduction in laser
projection displays. In: Chien, L.-C. (ed.) Emerging Liquid Crystal Technologies III. P 69110T (2008)
13. Iwai, T., Asakura, T.: Speckle reduction in coherent information processing.
Proc. IEEE.84, 765–781 (1996).https://doi.org/10.1109/5.488745 14. Sales, T.R.M.: Structured microlens arrays for beam shaping. Opt. Eng.42,
3084 (2003).https://doi.org/10.1117/1.1618817
15. Zimmermann, M., Lindlein, N., Voelkel, R., Weible, K.J.: Microlens laser beam homogenizer: from theory to application. In: Dickey, F.M., Shealy, D.L. (eds.) Laser Beam Shaping VIII. P 666302 (2007)
16. Guo, T., Yu, C., Li, H., et al.: Microlens Array diffuser with randomly distributed structure parameters. J. Phys. Conf. Ser.680, 012005 (2016).
https://doi.org/10.1088/1742-6596/680/1/012005
17. Piederrière, Y., Cariou, J., Guern, Y., et al.: Scattering through fluids: speckle size measurement and Monte Carlo simulations close to and into the multiple scattering. Opt. Express.12, 176 (2004).https://doi.org/10.1364/
OPEX.12.000176
18. Goodman, J.W.: Statistical properties of laser speckle patterns. In: Dainty, J.C.
(ed.) Laser Speckle and Related Phenomena, pp. 9–75. Springer, Berlin, Heidelberg (1975)
19. Kirkpatrick, S.J., Duncan, D.D., Wells-Gray, E.M.: Detrimental effects of speckle- pixel size matching in laser speckle contrast imaging. Opt. Lett.33, 2886 (2008).https://doi.org/10.1364/OL.33.002886
20. Thorlabs Engineered™Diffuser.https://www.thorlabs.com. (2018). Accessed 21 Aug 2018