ON THE X(17) LIGHT-PARTICLE CANDIDATE OBSERVED IN NUCLEAR TRANSITIONS ∗
A.J. Krasznahorkay, M. Csatlós, L. Csige, D. Firak, J. Gulyás Á. Nagy, N. Sas, J. Timár, T.G. Tornyi
Institute for Nuclear Research, Hungarian Academy of Sciences (MTA Atomki) P.O. Box 51, 4001 Debrecen, Hungary
A. Krasznahorkay
CERN, Geneva, Switzerland (Received November 21, 2018)
Recently, we observed an anomalous internal pair creation for the M1 transition depopulating the 18.15 MeV isoscalar 1+ state in 8Be. The deviation from the theoretical prediction can be described by assuming the creation and subsequent decay of a new, light boson with a mass of 16.7 MeV/c2. In order to clarify the interpretation, we re-investigated the
8Be anomaly with an improved and independent setup. We have confirmed the signal of the assumedX(17) particle and constrained its mass (m0c2= 17.01(16)MeV) and branching ratio compared to theγ-decay (Bx= 6(1)× 10−6). We investigated also the high-energy (21 MeV) Jπ = 0− → 0+ transition in4He and got a consistent result for theX(17) particle.
DOI:10.5506/APhysPolB.50.675
1. Introduction
Recently, we measured electron–positron angular correlations for the 17.6 MeV, and 18.15 MeV, Jπ = 1+ → Jπ = 0+ M1 transitions in 8Be and anomalous angular correlation, a significant peak-like enhancement rel- ative to the internal pair creation was observed at large angles in the an- gular correlation of the 18.15 MeV transition [1]. This was interpreted as the creation and decay of an intermediate particle X(17) with a mass of m0c2 = 16.70±0.35(stat.)±0.5(syst.) MeV.
∗ Presented at the Zakopane Conference on Nuclear Physics “Extremes of the Nuclear Landscape”, Zakopane, Poland, August 26–September 2, 2018.
(675)
The possible relation of theX(17) boson to the dark matter problem and the fact that it might explain the (g−2)µ puzzle, triggered high theoretical and experimental interest in the particle and hadron physics community [2].
Zhang and Miller discussed in detail if nuclear physics could explain the anomaly observed in the internal pair production in the8Be nucleus, however they could not describe it within nuclear physics [3].
Our observation was explained by Feng et al. [4, 5] by introducing a 16.7 MeV, Jπ = 1+ vector gauge boson X(17), which may mediate a fifth force with some coupling to SM particles. Thus, the X(17) boson could be produced in the decay of an excited state to the ground state, 8Be∗ →
8Be +X(17), followed by a decay throughX(17)→e+e−. At the same time Ellwanger and Moretti made another possible interpretation [6] of our exper- imental results assuming a light, pseudoscalar particle. Given the quantum- numbers of the 8Be∗ and 8Be states, the X(17) boson can indeed be a Jπ = 0− pseudoscalar particle, if it is emitted with an L = 1 orbital mo- mentum.
In the present work, we re-investigated the 8Be anomaly with an im- proved and independent setup, and studied also e+e− pair correlations in a high-energy0− →0+ transition of 4He.
2. Experiments
To populate the 17.6 and 18.15 MeV 1+excited states in8Be selectively, we used the7Li(p, γ)8Be reaction at the Ep = 441keV and theEp = 1030keV resonances [7]. The experiment was performed at the new 2-MV Tandetron accelerator at the MTA Atomki. A proton beam with a typical current of 1.0 µA impinged on 15 µg/cm2 LiF (used at the Ep = 441 keV resonance) and 300µg/cm2 thick Li target evaporated on 20µg/cm2 thick carbon foils (used at the Ep = 1030 keV resonance). The average energy loss of the protons in the targets was 9 keV and 70 keV, so the actual proton energy was 450 and 1100 keV. In contrast to our previous experiment [1,8], we used a much thinner12C backing and we increased the number of telescopes (from 5 to 6), which resulted in a different pair detection efficiency as a function of the correlation angle. As a considerable improvement, we replaced the gas- filled MWPC detectors with a double-sided silicon strip detector (DSSSD) array.
Thee+e− pairs were detected by six plastic scintillator + DSSSD detec- tor telescopes placed in a plain perpendicular to the beam direction. Their relative angles were 0◦, 60◦, 120◦, 180◦ 240◦ and 300◦. The size of the scin- tillators was82×86×80mm3. The positions of the hits were registered by the DSSSD detectors having strip widths of 3 mm. The telescope detectors were placed around the vacuum chamber made of a carbon fibre tube with a wall thickness of 1 mm.
γ rays were also detected for monitoring purposes. A rel = 100% HPGe detector was used at 25 cm from the target to detect the 18.15 MeV γ rays produced in the7Li(p, γ)8Be reaction.
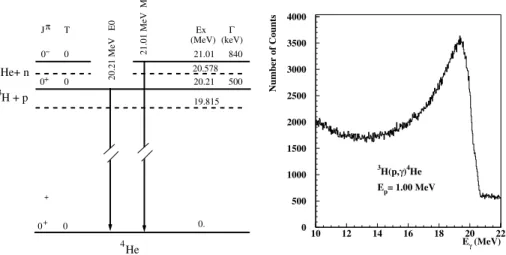
In order to populate the wide (Γ = 0.84 MeV) 0− second excited state (Ex = 21.1 MeV) in 4He [9], we used the 3H(p, γ)4He reaction at Ep = 1.000 MeV bombarding energy, which is just below the threshold of the (p, n) reaction (Ethr = 1.018 MeV). The energy accuracy of the Tandetron accelerator was better than 1 keV. This state overlaps with the first excited state in 4He (Jπ = 0+, Ex = 20.21 MeV, Γ = 0.50 MeV), which was also excited at the same time and deexcited by an E0 transition.
The target used for the measurements was a tritiated titanium disk with a thickness of 3.0 mg/cm2 evaporated previously on a 0.4 mm thick Mo disk.
The concentration of the tritium atoms was 2.66×10²⁰ atoms/cm2. The disk was cooled down to liquid N2 temperature to prevent the evaporation of3H.
3. Efficiency calibration of the e+e− spectrometer
The well-known, strong 6.05-MeV IPC transition (0+ → 0+, E0) fol- lowing the 19F(p, α e+e−)16O reaction was applied to perform the energy calibration of the spectrometer.
The pair correlation efficiency of the telescopes was calibrated by using the same dataset but with uncorrelated e+e− pairs of consecutive events.
Accordingly, an energy-independent approximation of the efficiency curve could be extracted.
Such an approximation is accurate when only the central volume of the telescopes is in use. This condition was automatically fulfilled in our previous experiments, when MWPC detectors were used with an effective area of 30×30 mm2.
However, the size of the DSSSD detectors used in the present experiment is50×50 mm2 resulting in a high probability of event loss when one of the particles escapes from the scintillator. It results in an efficiency reduction near the surface of the scintillator causing minor deviations in the efficiency curve. Thus, the energy dependence of the efficiency calibration was simu- lated by theGeant3code (for the samee+e− sum-energy gate as we used in the experimental data reduction) and taken into account as a correction for the experimentally determined efficiency curve.
The efficiency curve differs considerably for the present and previous setups, therefore, the present results could be considered as an independent measurement in the sense that any geometry-related systematic effect is eliminated from the measured data.
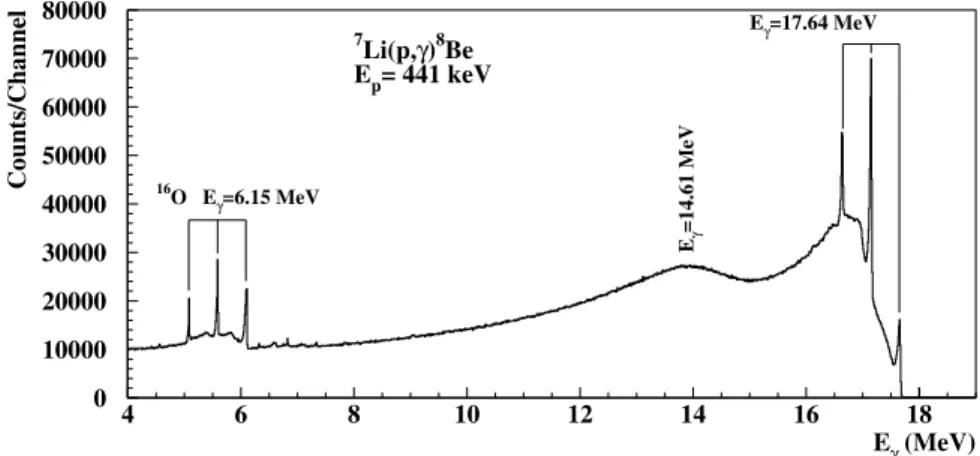
4. Subtraction of the background caused by cosmic rays Figure1 shows a γ-ray spectrum measured in the 7Li(p, γ)8Be reaction at theEp = 441keV resonance. We can nicely see the 17.64 MeV transition going to the ground state of 8Be and a 14.61 MeV transition to the broad first excited state, but no background transitions from 8 to 18 MeV. This was expected, as the reaction has an exceptionally largeQ-value of 17.25 MeV [7].
0 10000 20000 30000 40000 50000 60000 70000 80000
4 6 8 10 12 14 16 18
Eγ (MeV)
Counts/Channel Eγ=14.61 MeV
Eγ=17.64 MeV
16O Eγ=6.15 MeV
7Li(p,γ)8Be Ep= 441 keV
Fig. 1. A typicalγ-ray spectrum measured at theEp= 441keV resonance.
However, in thee+e−spectrometer, the cosmic ray background had to be taken into account. The background was measured for two weeks, before and after the experiment, and was subtracted with an experimentally determined factor from the results by using the same gates and conditions as for the in- beam data. The subtraction factor was derived by setting a high-energy gate (E(sum) = 25–50 MeV) on the cosmic rays for both cases (in-beam and off-beam). The cosmic ray background subtraction was then performed until eliminating all events within the high-energy gate.
The shape of the cosmic-ray background angular correlations determined for the 18 MeV gate is found to be completely different for the 5 detector and 6 detector configurations.
In order to get a reduction of the cosmic-ray background, an active shield was installed above the e+e− spectrometer, which was constructed from 13 units of 1.0 cm thick, 4.5 cm wide and 100 cm long plastic scintillators. Half of the yield of the cosmic rays could be suppressed this way.
5. Results for the 8Be transitions
Figure2shows our experimental results for the sum energy spectrum of coincidence events (a), and the angular correlation (b) of e+e− pairs mea-
sured at the proton absorption resonance atEp= 441keV. In order to check the efficiency of the experimental setup, we used the angular correlation de- termined for the 6.05 MeV E0 transition following the19F(p, α)16O reaction.
It is shown in the upper curve of Fig.2(b) together with the simulated re- sults for an E0 transition.
5000 10000 15000 20000 25000
0 2.5 5 7.5 10 12.5 15 17.5 20 22.5 Energy (MeV)
Counts/Channel
16O, 6.05 MeV, E0
17.64 MeV
14.61 MeV
7Li(p,e+e-)8Be Ep= 441 keV
Θ (deg.)
IPCC(exp), IPCC(simu)
7Li(p,e+e-)8Be Ep=441 keV
8Be
16O
10-2 EPC 10-1
40 60 80 100 120 140 160
b) a)
Fig. 2. (Color online) Measured sum energy spectrum (a) and angular correlation (b) of thee+e−pairs originated from the decay of the 17.6 MeV resonance compared with the simulated angular correlations [8] assuming M1+1.0%E1 mixed transitions (solid blue curve). The contribution of external pair creation in the simulations caused by the 17.6 MeVγrays is shown at the bottom of the figure marked by EPC.
A typicalγ-spectrum measured atEp= 1100keV is shown in Fig.3(a).
The 18.15 MeV (1+→0+ g.s.) photopeak and its single and double escape peaks are clearly visible. The broad peak at 15.15 MeV corresponds to the 15.15 MeV (1+→2+ 3.03 MeV) transition.
The energy resolution of the peaks reflects both the width of the reso- nance (Γ = 168keV) and the energy loss in the target. The branching ratio of theγ transition from the 18.15 MeV1+ state to the ground state and to the2+ state is 30% and 70%, respectively [7]. The transition to the ground state from this state is much less favored then from the 17.6 MeV state.
The contaminant line marked by 27Al is coming from the 27Al(p, γ)28Si reaction induced on the backing of the target.
As the branching ratio for the decay of the 18.15 MeV state was very much unfavored, to derive the angular correlations, we set a wide gate from 13 MeV to 20 MeV, covering both the ground state transition and the tran- sition to the first excited state. The result is shown in Fig.3.
10-1 1 10
40 60 80 100 120 140 160
Θ (degree)
IPCC (relative u.)
16O 6.05 MeV E0
8Be 15.1+18.15 MeV M1
8Be 18.15 MeV M1 EPC
Eγ (MeV)
Number of Counts Eγ=15.15 MeV second escape first escape Eγ=18.15 MeV
27Al(p,γ)
7Li(p,γ)8Be Ep= 1.10 MeV
103 104
13 14 15 16 17 18
Fig. 3. (Color online) A typicalγ-ray spectrum (left panel) and angular correlation of the e+e− pairs (right panel) originated from the decay of the 18.15 MeV reso- nance compared with the simulated angular correlations [8] assuming M1+1.4%E1 mixed transitions (solid blue curve), measured at Ep = 1100 keV. The contribu- tion of external pair creation in the simulations, caused by the 18.15 MeVγrays is shown at the bottom of the figure marked by EPC.
10-2 10-1
40 60 80 100 120 140 160
Θ (deg.)
IPCC(Θ) (relative unit)
7Li(p,γ)8Be Ep=1100 keV
Fig. 4. (Color online) Measured angular correlations published previously [1] (blue circles) and the present results (full red dots) of thee+e− pairs originated from the decay of the 18.15 MeV ground state transition in8Be. The black line represents the background, while the gray/green one is the sum of the signal and background.
In order to check the efficiency of the experimental setup, we calculated the angular correlation also for the 6.05 MeV E0 transition coming from the19F(p, α e+e−)16O reaction. It is shown in the upper curve of Fig. 2(b) together with the simulated results for an E0 transition.
Figure 4 shows our experimental results (full red dots with error bars) for the recent angular correlation ofe+e− pairs together with our previous results (open blue dots with error bars) [1] measured at the proton absorption resonance at Ep= 1030keV. There is very good agreement between the two independent sets of experimental data.
6. Fitting the measured angular correlations
The e+e− angular correlation distribution is described by an exponen- tially falling distribution modeled after the IPC simulation, and the signal distribution modeled from the simulation of a boson decaying toe+e−pairs.
The fit was performed with RooFit [10] by describing the e+e− angu- lar correlation distribution with the following probability density function (PDF):
PDF(e+e−) =Nbkgd∗PDF(IPC) +Nsig∗PDF(signal), (1) whereNbkgdandNsigare the fitted number of background and signal events, respectively.
The signal PDF was constructed as a 2-dimensional model as a function of the e+e− opening angle and the mass of the simulated particle. To con- struct the mass dependence, the PDF linearly interpolates thee+e−opening angle distributions simulated for discrete particle masses.
Using the composite PDF described in Eq. (1), we first performed a list of fits, by fixing the simulated particle mass in the signal PDF to a certain value, and letting RooFit estimate the best values forNsig and Nbkgd. The best fitted values of the likelihood used to minimise the fit.
Letting the particle mass lose in the fit, the best fitted mass and the branching ratio of thee+e−decay of such a boson to theγ decay is calculated for the best fit. The results of the two fits are summarized in Table I.
The first column shows our published results in Ref. [1], while the second one was obtained also for the data of Ref. [1], but fitted with the method described above.
The discrepancy in the particle masses of the two data sets could be a result of the unstable beam position in our previous experiment. According to MC simulations, such a mm order of beam position variation can cause a systematic uncertainty that cannot be neglected.
TABLE I Results of the new fit for Exp1, which was published earlier [1] and for Exp2, which is the present experiment.
Previous res. [1] Exp1 Exp2 Average
m0c2[MeV] 16.70(51) 16.86(6) 17.17(7) 17.01(16) Bx 5.8×10−6 6.8(10)×10−6 4.7(21)×10−6 6(1)×10−6
Significance 6.8σ 7.37σ 4.90σ
The particle masses deduced from the two data sets differ more than the statistical errors. It may be caused by the uncertainty of the beam position on the target, or some misalignment of the detectors which effects the angle determination.
7. Results for the 4He transitions
We used resonant proton capture reaction on 3H at Ep = 1.00 MeV to excite the first two excited states (Jπ = 0+, and 0−) in 4He as shown in Fig.5(a).
J
(MeV) Ex
(keV) Γ
0 0
21.01 840
4He 0
0 0−
+
+
+ 0
20.21 500
0.
π T
19.815 20.578 He+ n
21.01 MeV M0
H + p 3 3
20.21 MeV E0
0 500 1000 1500 2000 2500 3000 3500 4000
10 12 14 16 18 20 22
Eγ (MeV)
Number of Counts
3H(p,γ)4He Ep= 1.00 MeV
Fig. 5. The lowest energy levels of4He excited in the3H(p, γ)4He reaction at a pro- ton bombarding energy of 1.00 MeV (left panel). Measuredγ-ray energy spectrum obtained from the 3H(p, γ)4He direct proton capture reaction (right panel).
γ transitions between these states and the ground state, which has a Jπ = 0+are strictly forbidden. However, from direct proton capture, we were expectingγ rays as well, to the ground state of4He, as shown in Fig. 5(b).
Such energeticγ rays createe+e− pairs in the Mo backing of the target, as well as in other materials surrounding the target by external pair creation.
The two excited states in 4He are strongly overlapping. With an Ep = 1.000MeV bombarding energy, the excitation energy is 20.6 MeV, which is in between the two excited states, so both states are excited. We are expecting e+e− pairs from the E0 transition of 0+→0+, but no pairs from 0−→0+. transition. However, if anX(17) particle is created, then from its decay one can expecte+e− pairs with well-defined correlation angles.
The experimentale+e− angular correlation is shown in Fig.6(a) by full red dots with error bars. The solid curves with different colors are the result of our Monte-Carlo (GEANT4) simulations. The angular correlation is dominated by the e+e− pairs expected from the 0+ → 0+ E0 transition (gray/purple). It has another important contribution from the external pair creation (EPC) of theγ rays (black). We can observe also a small anomaly at about Θ = 115◦, which corresponds to the e+e− decay of the X(17) particle (light gray/green).
10-1 1 10
40 60 80 100 120 140
Θ (degree)
IPCC (relative u.)
3H(p,e+e-)4He Ep= 1.000 MeV
EPC E0
17.0 MeV/c2 boson
10-1 1
40 50 60 70 80 90 100 110 120 130 140 Θ (degree)
IPCC (relative u.)
7Li(p,e+e-)8Be Ep= 441 keV EPC
M1
a) b)
Fig. 6. (Color online) Measured angular correlations of thee+e− pairs originated from the decay of the 20.6 MeV transition excited in the3H(p, γ)4He reaction (a) and from the 17.6 MeV ground state transition in8Be (b)
In order to calibrate the spectrometer and check the effect of the Mo backing, we performed experiments using the well-known7Li(p, γ)8Be reac- tion having no Mo backing and having 0.4 mm thick Mo backing. Without a Mo backing, the angular correlation could nicely be reproduced with the simulated curve obtained for M1 internal pair creation. The angular corre- lation measured with Mo backing is shown in Fig.6(b). It is dominated by external pair creation (EPC). The internal pair creation of the 17.6 MeV M1 transition has only a small contribution to this angular correlation.
8. Conclusions
We have remeasured thee+e− angular correlation for the M1 transition depopulating the 18.15 MeV state in 8Be. We could reproduce the peak- like deviation from the predicted IPC, confirming the signal of the new X(17) particle as well as constraining its mass (m0c2= 17.01(16) MeV) and branching ratio compared to the γ decay (Bx = 6(1)×10−6). We have measured the e+e− angular correlation for the mixture of the high-energy (20.6 MeV) Jπ = 0− → 0+ and Jπ = 0+ → 0+ transitions in 4He as well.
Although the second transition (E0) gave a large background, the effect of the X(17) e+e− decay was also visible at 115 degree. We are planning to repeat the experiment with better statistics. Using better energy resolution and a sharper cut on the symmetry energy will also help to improve the signal/background ratio.
This work was supported by the National Research, Development and Innovation Fund of Hungary, financed under the K17 funding scheme with project No. K124810, by the GINOP-2.3.3-15-2016-00034 and by the János Bolyai Research Fellowship of the Hungarian Academy of Sciences (L. Csige).
REFERENCES
[1] A.J. Krasznahorkayet al.,Phys. Rev. Lett. 116, 042501 (2016).
[2] https://inspirehep.net/search?ln=en&p=refersto%3Arecid%
3A1358248&jrec=26&sf=earliestdate
[3] X. Zhang, G.A. Miller,Phys. Lett. B 773, 159 (2017).
[4] J. Fenget al., Phys. Rev. Lett. 117, 071803 (2016).
[5] J. Fenget al., Phys. Rev. D 95, 035017 (2017).
[6] U. Ellwanger, S. Moretti,J. High Energy Phys. 1611, 039 (2016).
[7] D.R. Tilleyet al., Nucl. Phys. A745, 155 (2004).
[8] J. Gulyáset al.,Nucl. Instrum. Methods Phys. Res. A 808, 21 (2016).
[9] R. Tilley, H.R. Weller, G.M. Hale,Nucl. Phys. A 541, 1 (1992).
[10] W. Verkerke, D.P. Kirkby,The RooFit Toolkit for Data Modeling,eConf C 0303241(2003) MOLT007 [arXiv:physics/0306116 [physics.data-an]].
![Fig. 2. (Color online) Measured sum energy spectrum (a) and angular correlation (b) of the e + e − pairs originated from the decay of the 17.6 MeV resonance compared with the simulated angular correlations [8] assuming M1+1.0%E1 mixed transitions (solid bl](https://thumb-eu.123doks.com/thumbv2/9dokorg/1071359.71432/5.680.80.606.207.472/measured-spectrum-correlation-originated-resonance-simulated-correlations-transitions.webp)
![Fig. 3. (Color online) A typical γ-ray spectrum (left panel) and angular correlation of the e + e − pairs (right panel) originated from the decay of the 18.15 MeV reso-nance compared with the simulated angular correlations [8] assuming M1+1.4%E1 mixed tra](https://thumb-eu.123doks.com/thumbv2/9dokorg/1071359.71432/6.680.80.609.93.352/typical-spectrum-correlation-originated-compared-simulated-correlations-assuming.webp)