and structural properties of
140La
A. M. Hurst,1,∗ A. Sweet,1B. L. Goldblum,1 R. B. Firestone,1 M. S. Basunia,2 L. A. Bernstein,1, 2 Zs. R´evay,3, 4 L. Szentmikl´osi,3 T. Belgya,3 J. E. Escher,5 I. Hars´anyi,3 M. Krtiˇcka,6 B. W. Sleaford,5 and J. Vujic1
1Department of Nuclear Engineering, University of California, Berkeley, California 94720, USA
2Lawrence Berkeley National Laboratory, Berkeley, California 94720, USA
3Centre for Energy Research, Hungarian Academy of Sciences, H-1525 Budapest, Hungary
4Technische Universit¨at M¨unchen, Forschungsneutronenquelle Heinz Maier-Leibnitz (FRM II), Garching, Germany
5Lawrence Livermore National Laboratory, Livermore, California 94550, USA
6Charles University in Prague, Faculty of Mathematics and Physics, CZ-180 00 Prague, Czech Republic (Dated: December 13, 2018)
A set of prompt partialγ-ray production cross sections from thermal neutron-capture were mea- sured for the139La(n, γ) reaction using a guided beam of subthermal (thermal and cold) neutrons incident upon a natLa2O3 target at the Prompt Gamma Activation Analysis facility of the Bu- dapest Research Reactor. Absolute140La cross sections were determined relative to the well-known comparator35Cl(n, γ) cross sections from the irradiation of a stoichiometricnatLaCl3 sample. The total cross section for radiative thermal neutron-capture on139La from the sum of experimentally measured cross sections observed to directly feed the 140La ground state was determined to be σ0expt = 8.58(50) b. To assess completeness of the decay scheme and as a consistency check, the measured cross sections for transitions feeding the ground state from levels below a critical energy of Ec= 285 keV were combined with a modeled contribution accounting for ground-state feeding from the quasicontinuum to arrive at a total cross section of σ0 = 9.36(74) b. In addition, a neutron- separation energy ofSn= 5161.005(21) keV was determined from a least-squares fit of the measured primaryγ-ray energies to the low-lying levels of the140La decay scheme. Furthermore, several nu- clear structure improvements are proposed for the decay scheme. The measured cross-section and separation-energy results are comparable to earlier measurements of these quantities.
PACS numbers: 28.20.Np, 27.60.+j, 24.60.Dr, 21.10.Pc
I. INTRODUCTION
The nucleus139La is an abundant fission product in the A≈143 region. It plays a prominent role in the uranium fuel cycle with a cumulative fission-product yield of>6%
in the case of thermal- and fast-neutron induced fission of 233,235U, and>5% in fast-neutron induced fission of
239Pu [1]. Together with its direct fission yield, it also oc- curs in theβ−-decay chain139Xe→139Cs→139Ba→139La.
Consequently, neutron-capture cross sections for 139La provide an important ingredient for nuclear reactor fuel- related applications including fission-product decay-heat calculations and transmutation studies, as well as the development of improved physics models for calculation- based nuclear forensics tools [2]. Also, the induced γ- decay activity from 140La, produced following neutron capture, and its relatively short half life (T1/2 ≈ 1.7 d [3]) make it suitable for isotopic monitoring at reactor facilities, following shutdown, for example [4].
This study of the 139La(n, γ) reaction also provides an opportunity to assess the decay-scheme nuclear struc- ture information for the compound nucleus140La as well as the role of the photon strength function (PSF) in de- scribing statistical properties of nuclei near theN = 82
∗Electronic address: amhurst@berkeley.edu
shell closure. The PSF has profound implications for determination of reaction rates in astrophysicalr- andp- process nucleosynthesis, and for radiation transport cal- culations to simulate the distribution of emittedγ rays where no experimental data are available. Recently, a strong low-energy enhancement of the PSF, observed for the first time in56,57Fe [5], was reported in151,153Sm [6].
Notably, however, this low-energy upbendis absent ap- proaching N = 82 in the lighter-mass nuclei 148,149Sm [7] and144Nd [8]. In the case of the samarium nuclei, a pronounced change in the measured PSF is interpreted as a possible shape-transitional effect from a modestly- deformed to near-spherical configuration as a single neu- tron is removed from the system [7]. Charged-particle reactions have also been carried out recently to probe the PSF in the lanthanum isotopes [9, 10] where a nonzero limit in strength was observed asEγ →0, similar to that reported for148Sm (N = 86) and 144Nd (N = 84). This work aims to extend our knowledge of the PSF system- atics nearing the shell closure with the N = 83 nucleus
140La by comparison of our radiative-capture results with those obtained through charged-particle reactions.
II. EXPERIMENTAL METHOD AND DATA ANALYSIS
Samples composed of natural lanthanum (139La:
99.911% and138La: 0.089% [11]) compounds, natLaCl3· 7H2O (hereafter, LaCl3) and natLa2O3 (hereafter, La2O3), were irradiated with thermal and cold neutron beams at the 10-MW Budapest Research Reactor [12–14]
to measure the radiative neutron-captureγ-ray produc- tion of140La. Four samples were irradiated over various periods at the target station of the Prompt Gamma Acti- vation Analysis (PGAA) facility [15–17]: “thick” LaCl3
(4497.1 mg, 1.7 h); “thick” La2O3 (1037.1 mg, 2.7 h);
“thin” LaCl3(450 mg, 3.8 h); and “thin” La2O3(104 mg, 11.0 h). The thin-sample measurements allow us to assess the effect of self absorption. The PGAA setup is located
∼33.5 m downstream of the reactor wall at the terminus of a slightly curved, guided neutron beamline. The guide is comprised of 2θc-supermirror units 0.75 m in length.
Epithermal and higher-energy neutrons have the incor- rect wavelength for transmission resulting in a pure beam of thermal neutrons. A modular aluminium flight tube at the end of the beamline containing a6Li-doped polymer to reduce neutron scattering ensures a well-collimated beam at the target position of the PGAA sample cham- ber [18]. In this experiment fluxes of 2.3×10⁶ n/cm2/s (thermal) and 7.75×10⁷ n/cm2/s (cold) on target for the thick and thin-sample irradiations, respectively, were achieved.
An n-type closed-end coaxial high-purity germanium (HPGe) detector is used to monitorγdecay at the target- sample position of the PGAA facility. This detector has an active volume of 144 cm3 with a relative effi- ciency of 27% at 1332 keV and is surrounded by an annular Compton-suppression shield consisting of eight coaxial bismuth germanate (BGO) segments. This de- tection system is mounted within 10-cm-thick lead hous- ing that is itself encased by a 6Li-doped plastic layer for enhanced γ-ray and neutron absorption to maintain low-background conditions [16]. The face of the HPGe detector is located 23.5 cm from the target position to minimize peak-summing effects [15] and is oriented at 90◦ to the beam direction, while the target sample is held in a thin Teflon bag oriented at 30◦ to the beam line. The BGO segments are operated in anticoinci- dence mode with respect to the HPGe detector to veto Compton-scattering events and thereby reduce their im- pact on the observedγ-ray continuum. Energy and effi- ciency calibrations of the HPGe spectrometer were per- formed using a variety of standard radioactive (133Ba,
152Eu, 207Bi, 226Ra, and 241Am) and reaction sources (deuterated urea: 14N(n, γ)15N and polyvinyl chloride:
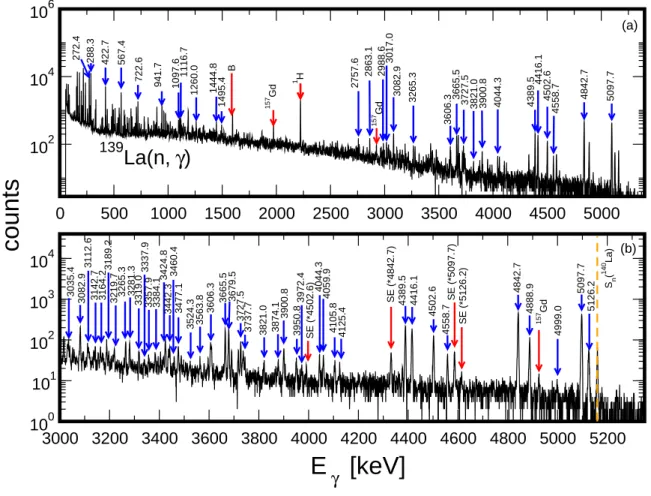
35Cl(n, γ)36Cl) for energies below and above 1.5 MeV, respectively. The nonlinearity and efficiency curves were generated using theγ-ray spectroscopy software package HYPERMET-PC[16, 19–21]; this program was also used in the offline analysis of the promptγ-ray spectra. Repre- sentative prompt spectra from the thick La2O3measure-
ment are shown in Fig. 1; several primary and secondary γ-ray transitions corresponding to the 139La(n, γ) reac- tion are clearly visible.
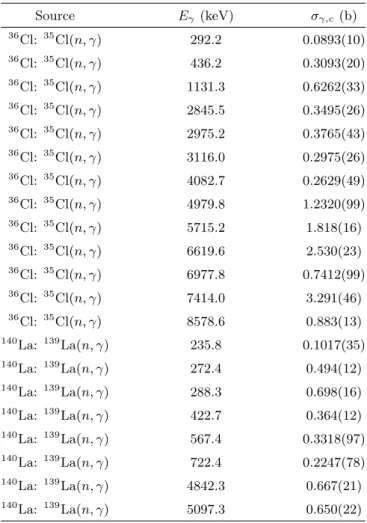
A. Cross-section standardization procedure Two of the lanthanum samples irradiated were primar- ily used to obtain the set of partial γ-ray production cross sections (Eγ ≥ 200 keV) for the 140La compound presented in this work: the thick LaCl3 and the thick La2O3 samples. The former was used to extract cross sections for several prompt139La(n, γ) capture lines rel- ative to those from transitions in the well-known com- parator36Cl: 35Cl(n, γ) [23]. These cross sections, corre- sponding to strong, well-resolved transitions covering the observed excitation-energy range in36Cl are listed in Ta- ble I. Adopting the internal-standardization procedure described in Ref. [24], and assuming γ-ray self absorp- tion is negligible above 200 keV (see Sect. II B), it can be shown (see, e.g., Ref. [25]):
σγ,x
σγ,c =nx
nc ·Aγ,x/(Eγ,x)
Aγ,c/(Eγ,c), (1) whereσγ,x andσγ,c denote the partial γ-ray production cross sections for the unknown (x) and comparator (c) γ-ray lines, respectively. Similarly,Aγ,xandAγ,care the measured peak areas of the unknown and comparatorγ rays, respectively,(Eγ) is the detector efficiency atγ-ray energiesEγ,xandEγ,c, and (nx/nc) accounts for the stoi- chiometry of the irradiated sample. This expression holds for so-called regular “1/vnuclides” whereσγ(En)∝1/v;
∀En ≤25.3 meV. Both35Cl and139La fall into this cat- egory as they have Westcottg factors that deviate from unity by less than 1% atT = 293 K and no correction is needed for the neutron-beam temperature in these cases [26].
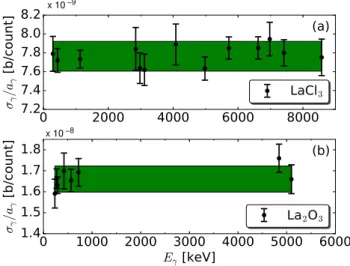
Equation (1) shows that the cross section for any given transition should be directly proportional to its efficiency-corrected peak area, i.e.,σγ ∝aγ where aγ = Aγ/(Eγ) and, thus, the ratioσγ/aγ should be constant.
These ratios have been measured in the thick LaCl3spec- trum for all 36Cl comparator lines in Table I and the resulting plot of Fig. 2(a) reveals statistical consistency for all values, implying self absorption is not an issue at theseγ-ray energies. We have averaged these results, indicated by the shaded region on the plot, to represent the expectation value of this constant ratiohNi. Accord- ingly, standardized cross sections fornatLa(n, γ) can then be determined using this normalization factor as
σγ,x= nx nc
aγ,xhNi. (2)
The known 1(La) : 3(Cl) stoichiometry of the irradiated LaCl3 sample implies (nx/nc) = 1/3. The natLa(n, γ) cross sections obtained using Eq. (2) yield insignificant changes upon correction for isotopic abundance to ar- rive at isotopic 139La(n, γ) cross sections. There was
0 500 1000 1500 2000 2500 3000 3500 4000 4500 5000 102
104 106
139
La(n, γ )
5097.7
4842.7
722.6
567.4
422.7
288.3
272.4 1 H
941.7 1097.6 1116.7 1260.0 1444.8 1495.4 2757.6 2863.1 2988.6 3017.0 3082.9 3265.3 3606.3 3665.5
3727.5 3821.0 3900.8 4044.3 4389.5 4416.1 4502.6 4558.7
B 157 Gd 157 Gd 157 Gd
(a)
(b)
3000 3200 3400 3600 3800 4000 4200 4400 4600 4800 5000 5200 100
101 102 103 104
5097.7
4888.94842.7
4558.74502.6
4416.14389.5
4125.4
3606.3 3900.83727.53679.53665.5
3082.9 Sn(140 La)
3265.3 3281.3 3821.0 4044.3 4059.9 5126.2SE (*4842.7) SE (*5097.7) 4999.0SE (*4502.6)3972.43950.83874.13737.7 4105.83563.83524.33477.13460.43442.33424.83384.13357.93337.93319.0
3219.73189.23164.23142.73112.6
3035.4 SE (*5126.2)
counts
E γ [keV]
FIG. 1: (Color online) Promptγ-ray energy spectra observed following the139La(n,γ) reaction with the La2O3 sample. The upper panel (a) reveals the complete energy range of interest in the capture-γ product 140La. A strong background line at around 2223 keV from 1H(n, γ) [22] is clearly visible, as are a few contaminant lines from 157Gd(n, γ). In the lower panel (b), the same spectrum is expanded aroundEγ = 3000−5350 keV to highlight many of the intense primaryγ rays observed in this measurement. Prominent background lines (B) and single-escape peaks (SE) are labeled as is the position of the neutron-separation energy (Sn) for140La.
no obvious contamination from capture on 138La(σ0 = 51(5) mb [27] assuming the reported 0.089% abundance [11]). However, the complexity of the LaCl3 spectrum renders it difficult to unambiguously resolve all lan- thanum capture-γlines due to interference from chlorine lines. The subset of strong prompt 140La γ-ray transi- tions listed in Table I were selected to cover the observed energy range and used as standards for normalizing the intensities of all prompt γ rays>200 keV measured in the much cleaner La2O3 spectrum. This spectrum is shown in Fig. 1. Normalization methods for lower-energy γ rays are discussed in the following Sect. II B.
Because we are only interested in γ rays belonging to lanthanum from the La2O3 measurement, and lan-
thanumγ rays are also being used for comparative pur- poses here, stoichiometry considerations are redundant, i.e., nx/nc = 1. Furthermore, any oxygen capture is insignificant owing to its much smaller total radiative neutron-capture cross section; the oxygen isotopes have values five orders of magnitude lower [28] than the cur- rently adopted value for139La(n, γ) [27]. In addition, the oxygen capture-γspectrum is known to be rather sparse and weak [22, 28], posing an unlikely source of signif- icant contamination and no oxygen-capture lines were observed. Thus, using Eqs. (1) and (2) together with the set of140La comparator γ-ray lines listed in Table I, a suitable cross-section normalization (Fig. 2(b)) was de- termined for all prompt139La(n, γ) lines measured in this
0 1000 2000 3000 4000 5000 6000 Eγ [keV]
1.4 1.5 1.6 1.7 1.8
σγ/aγ [b/count] 1e−8 (b)
La2O3
0 2000 4000 6000 8000
7.2 7.4 7.6 7.8 8.0 8.2
σγ/aγ [b/count] 1e−9 (a)
LaCl3 x 10−9
x 10−8
FIG. 2: (Color online) Normalizationγrays used to standard- ize the (a) LaCl3 and (b) La2O3 spectra. The expectation value of the ratioσγ/aγis indicated by the shaded 1-σrange on each plot. The standardized cross sections used in these plots are listed in Table I and were deduced from the LaCl3
sample.
work.
Lanthanide targets that have not been isotopically en- riched typically suffer from low levels of contamination from other rare-earth isotopes. Indeed, a few strong lines from 155,157Gd and 149Sm were observed in the prompt (n, γ) spectra. By comparing the standardized partial γ-ray cross sections, deduced using Eq. (2), for tran- sitions in these isotopes to their known cross sections [22, 29], we have established isotopic compositions of 1.10(5)×10−3%, 1.03(7)×10−3%, and 3.4(2)×10−4% for
155Gd, 157Gd, and 149Sm, respectively, in the natLa2O3
sample. Figure 3 shows the transitions used to deter- mine these abundances. The isotopes 155Gd and 157Gd occur naturally together in roughly equal proportions:
14.8% and 15.7% [11], respectively. There is no reason to expect this ratio to change in a natural sample and all measured lines are in accordance with it. Only tran- sitions from157Gd(n, γ) overlapped with lines of interest in 139La(n, γ). These transitions were clearly identified and accounted for in determining the partialγ-ray cross sections presented in Sect. IV.
B. Low-energy γ rays and photon attenuation Low-energy transitions (Eγ .200 keV) can be signif- icantly attenuated in high-density materials, e.g., tung- sten [30] and rhenium [31], requiring significant correc- tions for photon attenuation [32]. Because the thick sam- ples used in this measurement are rather bulky, however, to ensure low-energyγrays are treated appropriately for photon attenuation, two additional measurements using thin samples of the exact same lanthanum compounds
0 1000 2000 3000 4000 5000 6000 7000 E
γ[keV]
0.0003 0.0004 0.0005 0.0006 0.0007 0.0008 0.0009 0.0010 0.0011 0.0012
Abundance [%]
1- σ range:
149Sm 1- σ range:
157Gd
149
Sm
155
Gd
157
Gd
FIG. 3: (Color online) Measured isotopic abundances of
149Sm and155,157Gd contaminants in the La2O3sample. The dark-blue (dark gray) and hatched light-green (light-gray) shaded boundaries correspond to the 1-σ uncertainty range on the measured abundances for 149Sm and 157Gd, respec- tively.
were subsequently performed. The thin-sample measure- ments were again standardized using the procedure out- lined in Sect. II A to obtain a set of partialγ-ray produc- tion cross sections for the139La(n, γ) reaction; all refer- ence cross sections listed in Table I are consistent with the thin-sample measurements. Unfortunately, many transi- tions in the low-energy region of the spectrum are still difficult to obtain precision measurements for due to over- lapping peaks andγ-ray self absorption. To address this issue, we have exploited the γ-ray data of Meyer et al.
[33] which reports absolute intensities corrected for self absorption for the low-energy spectrumEγ <70 keV in
140La. Here, we compare our normalized cross sections for the 45.9-, 49.8-, and 56.3-keVγ rays deexciting the 318.2-, 322.0-, and 658.3-keV levels, respectively, to the absolute intensities per 100 neutron captures (Iγ/100n) in Ref. [33]. Although these are very low-energy tran- sitions, our cross sections are reliable because we were able to normalize to intense well-resolved higher-energy transitions (where self absorption in the target is negligi- ble) deexciting the same levels according to their known branching ratios [3] (see Table V). Based on consis- tency between theIγ/100ndata [33] relative to our cross sections for these transitions, we could, thus, convert Iγ/100n γ-ray measurements to absolute standardized cross sections for all other low-energy transitions from Ref. [33] where Eγ < 70 keV. All other cross sections were obtained from the standardization procedure. We also performed a consistency check in the γ-ray energy region around Eγ = 100−200 keV, whereupon our de- duced thin-sample standardized cross sections compare well with the absorption-corrected absolute intensities per 100nreported in the earlier139La(n, γ) work by Ju- rney et al. [34] that covers a broader interval of γ-ray
TABLE I: Comparator γ-ray lines in 36Cl and 140La com- pounds together with their corresponding standardized par- tialγ-ray production cross sections obtained from the LaCl3
sample. The139La(n, γ) values were then adopted as normal- ization cross sections for the La2O3 measurement.
Source Eγ (keV) σγ,c(b)
36Cl: 35Cl(n, γ) 292.2 0.0893(10)
36Cl: 35Cl(n, γ) 436.2 0.3093(20)
36Cl: 35Cl(n, γ) 1131.3 0.6262(33)
36Cl: 35Cl(n, γ) 2845.5 0.3495(26)
36Cl: 35Cl(n, γ) 2975.2 0.3765(43)
36Cl: 35Cl(n, γ) 3116.0 0.2975(26)
36Cl: 35Cl(n, γ) 4082.7 0.2629(49)
36Cl: 35Cl(n, γ) 4979.8 1.2320(99)
36Cl: 35Cl(n, γ) 5715.2 1.818(16)
36Cl: 35Cl(n, γ) 6619.6 2.530(23)
36Cl: 35Cl(n, γ) 6977.8 0.7412(99)
36Cl: 35Cl(n, γ) 7414.0 3.291(46)
36Cl: 35Cl(n, γ) 8578.6 0.883(13)
140La: 139La(n, γ) 235.8 0.1017(35)
140La: 139La(n, γ) 272.4 0.494(12)
140La: 139La(n, γ) 288.3 0.698(16)
140La: 139La(n, γ) 422.7 0.364(12)
140La: 139La(n, γ) 567.4 0.3318(97)
140La: 139La(n, γ) 722.4 0.2247(78)
140La: 139La(n, γ) 4842.3 0.667(21)
140La: 139La(n, γ) 5097.3 0.650(22)
energies up to 1500 keV. The observed consistency im- plies self absorption is not a prevalent issue in this energy region in the thin-sample measurements.
The standardized cross sections obtained from the thin-sample measurements and renormalized absolute in- tensity data may then be compared to those from the thick-sample measurements to assess the effect of γ-ray self absorption. The experimental photon attenuation at a given γ-ray energy (in a thick sample) with measured intensityIγ(Eγ), may be determined by comparing par- tialγ-ray production cross sections from an optically-thin reference sample (σSγ) to those from the thick-target sam- ple (σγT):
I(Eγ) I0
expt
=σTγ
σSγ, (3)
where I0 is the unattenuated intensity produced in the sample. In the absence of any attenuation, this ratio should be around unity. In the event of significant γ- ray absorption σγT < σSγ. Figure 4 shows the ratios of
0 100 200 300 400 500 600 0.5
0.6 0.7 0.8 0.9 1.0
σ
γT(LaCl
3) / σ
γS(LaCl
3) E
γ[keV]
I I
( E )
γ0FIG. 4: (Color online) Ratios of standardized partialγ-ray production cross sections for clean prompt139La(n, γ) transi- tions measured in the thick LaCl3 sample (T) relative to the same transitions in the thin reference LaCl3 sample (S). The ratios were measured at the following γ-ray energies: 54.9, 63.2, 155.6, 162.6, 209.2, 272.4, 422.7, and 567.4 keV.
standardized cross sections for several clean transitions below 600 keV from the thick hydrated LaCl3 ·7H2O (ρ= 2.23 g/cm3 [35]) sample (σTγ) relative to the corre- sponding standardized cross sections from the thin sam- ple (σγS) of the same compound. The effect of self ab- sorption is clear forγ-ray transitions withEγ<200 keV, while ratios deduced with Eq. (3) for all transitions above this energy are consistent with unity. Similar results were obtained with the La2O3 (ρ= 6.51 g/cm3) sample.
In order to validate our results, we calculated the ef- fective sample thickness t consistent with the observed photon attenuation for each of the thick lanthanum sam- ples according to the prescription of Ref. [32]. Using this methodology, the attenuation is determined by integrat- ing the exponential-attenuation lawIγ/I0= exp(−µγx) over the sample depthx:
Iγ
I0 x=t
Z
x=0
dx=
x=t
Z
x=0
exp
−ρµ
γ
ρ
Eγx cosθ
dx, (4) to arrive at theEγ- and t-dependent expression for the photon attenuation given by
Iγ(Eγ, t) I0
= cosθ ρµ
γ
ρ
Eγ
t
1−exp
−ρµ
γ
ρ
Eγ
t cosθ
. (5) Here, (µγ/ρ)Eγrepresents theγ-ray mass-attenuation co- efficient at a givenγ-ray energy Eγ and is sourced from theXMUDATdatabase [37],ρis the density of the target sample, andθ= 30◦ is the angle of the sample face rel- ative to the detector face in this experiment [38]. From
0.5 0.6 0.7 0.8 0.9 1.0 1.1 1.2 sample thickness [mm]
0 1 2 3 4 5 6 7 8
χ2
(a):(i)
LaCl3· 7H2O
0 100 200 300 400 500 600
Eγ [keV]
0.0 0.2 0.4 0.6 0.8 1.0
I(Eγ)/I0
(a):(ii)
t γ (LaCl3· 7H2O) = 0.842 mm Uncertainty ( ± 1σ)
140La: (I(Eγ)/I0)expt; γ standards
140La: (I(Eγ)/I0)expt
0 100 200 300 400 500 600
Eγ [keV]
0.0 0.2 0.4 0.6 0.8 1.0
I(Eγ)/I0
(b):(ii)
t γ (La2O3) = 0.078 mm Uncertainty ( ± 1σ)
140La: (I(Eγ)/I0)expt; γ standards
140La: (I(Eγ)/I0)expt
0.02 0.04 0.06 0.08 0.10 0.12 0.14 sample thickness [mm]
0 1 2 3 4 5 6 7 8
χ2
(b):(i)
La2O3
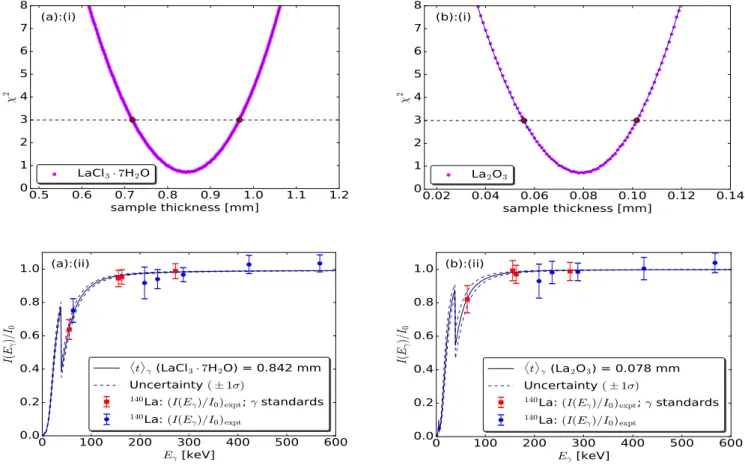
FIG. 5: (Color online) Upper panels: plot of the globalχ2 values as a function of the target thickness for (a):(i) LaCl3·7H2O and (b):(i) La2O3. The dashed line drawn at χ2min+ 2.3 defines the 1σ range of acceptable t values for two adjustable parameters [36]. Lower panels: plot of the calculated attenuation factor at the deduced effective sample thicknesses of (a):(ii) hti= 0.842(+125−124) mm for LaCl3·7H2O, and (b):(ii)hti= 0.078(+24−22) mm for La2O3. The experimentally measured attenuation factors (Eq. (3)) for a subset of strong well-resolvedγrays are indicated on each plot. The red-square data points indicate the γ-ray standards used to constrain the fits: 54.9-keV (LaCl3·7H2O only); 63.2-keV (La2O3 only); 155.6-keV; 162.6-keV; and 272.4-keV transitions. Also shown for comparison are the 209.2-, 235.8-, 288.3-, 422.7-, and 567.4-keV transitions (blue-circle data points) that were not used to constrain the fitting procedure.
Eqs. (1) and (2), it is clear that the measured peak ar- eas, after correcting for photon attenuation and detector efficiency, should be directly proportional to their cor- responding reference cross sections and, therefore, the following relation should hold for all values ofEγ:
σS aγ
·Iγ(Eγ, t) I0
=C. (6)
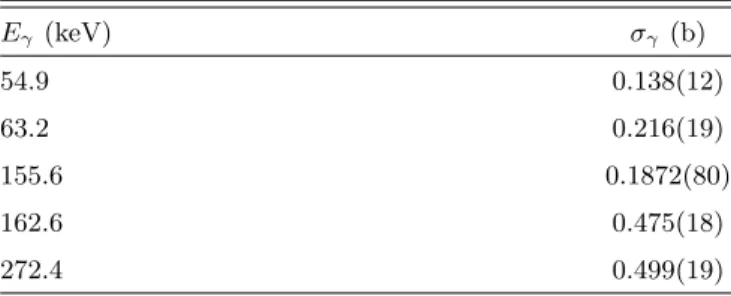
The effective thicknesstfor the thick-sample lanthanum compounds was then varied until the constant C in Eq. (6) converged to a unique value for an adopted set of γ rays. For each sample, we performed a χ2 mini- mization [32] using four γ-ray data points and treated both t and the correlation coefficient as adjustable pa- rameters to minimize theχ2function leaving two degrees of freedom (ndf = 2). The γ-ray energies and corre- sponding standardized partial γ-ray cross sections used in the minimization procedure are listed in Table II. For a 2-parameter adjustment, the 1σ-uncertainty band is defined by χ2min+ 2.3 [36]. The resulting χ2 plots are
shown in Figs. 5(a):(i) and 5(b):(i), revealing expecta- tion values of hti = 0.842(+125−124) mm for LaCl3·7H2O andhti= 0.078(+24−22) mm for La2O3, respectively, accord- ing to the observed minima and extracted uncertainty range in each case. The associated attenuation curves at the respective deduced thicknesses are also shown in Figs. 5(a):(ii) and 5(b):(ii); the experimentally-deduced photon-attenuation ratios given by Eq. (3) for a subset of well-definedγ-ray transitions (covering the energy re- gion of interest) are plotted for comparison, and the γ- ray standards used to constrain each fit (selected from Table II) are indicated. These plots reveal statistical consistency between the calculated photon attenuation at the deduced sample thicknesses and the experimental ratios given by Eq. (3).
Based on our analysis of the thick- and thin-sampleγ- ray data, three distinct energy regions were categorized in order to discriminate and obtain the complete set of partialγ-ray production cross sections for140La: (i) Low- energy transitions corresponding to Eγ . 70 keV were
obtained from the renormalizedIγ/100ndata of Ref. [33]
(in particular those deexciting levels below 103.8 keV) unless stated otherwise. (ii) Moderately low-energy tran- sitionsEγ <200 keV were obtained from the standard- ization of the thin-sample measurements. (iii) All other higher-energy cross sections, whereγ-ray self absorption is shown to be statistically insignificant, were obtained from the standardization of the thick-sample La2O3mea- surement.
III. STATISTICAL-MODEL CALCULATIONS The Monte Carlo statistical-decay codeDICEBOX[39]
was used to simulate the thermal neutron-capture γ- ray cascades for the compound nucleus 140La. Below a certain cutoff energy, the critical energy Ec, the code takes level energies, spins, parities, and γ-ray branch- ing information from available experimental data. Inter- nal conversion is accounted for using coefficients gener- ated from the Band-Raman Internal Conversion Calcu- lator (BRICC) [40]. In addition, experimental data are also used for intensities of primaryγrays deexciting the neutron-capturing state to levels belowEc.
Above Ec, DICEBOX generates a random discrete set of levels using a nuclear level density (LD) model ρ(E, J, π). DICEBOXthen uses photon strength function (PSF) modelsf(XL)(Eγ) forE1,M1, andE2 transitions to generate a set of transition widths Γif from each state to all other states below, where i and f denote the ini- tial and final levels, respectively, involved in a transition.
The calculated widths fluctuate according to a Porter- Thomas [41] distribution:
P(x) = 1
√2πxe−x/2, (7) wherex= ΓXLif /hΓifi, and the expectation value is given by
hΓifi= f(XL)(Eγ)·Eγ(2L+1)
ρ(Ei, Ji, πi) . (8) Individual levels and partial radiation widths are gener- ated randomly; a complete set of these quantities for a
TABLE II: Low-energy standardizedγ-ray cross sections used to deduce the effective thicknesses for the thick LaCl3·7H2O and La2O3 samples. See text for details.
Eγ (keV) σγ (b)
54.9 0.138(12)
63.2 0.216(19)
155.6 0.1872(80)
162.6 0.475(18)
272.4 0.499(19)
TABLE III: Parametrizations for the CTF (T and E0) and BSFG (a and E1) LD models used in the statistical-model calculations to simulate capture-γcascades in the140La com- pound. Adopted parameters corresponded to the listed mean values.
Source T (MeV) E0 (MeV) a(MeV−1) E1 (MeV) Ref. [42] 0.71(5) −1.91(38) 13.52(40) −1.20(19) Ref. [43] 0.69(5) −1.79(37) 12.32(38) −1.17(16)
given decay-scheme simulation is referred to as a nuclear realization.
Because of the different decay paths involved, the cal- culated quantities fluctuate among different nuclear real- izations even for a given PSF and LD combination. The statistical variation of the decay-related observables due to the fluctuation properties of the simulated quantities can be represented as the associated uncertainty.
The code predictions used in this work were the pop- ulation of levels belowEc, and the total radiative width of the capturing state. To obtain adequate statistical variation in the simulated quantities, we performed 50 separate nuclear realizations, each with 100,000 capture- state γ-ray cascades, for each combination of PSF and LD.
A. Determination of the total radiative thermal-neutron capture cross section
The total radiative thermal neutron-capture cross sec- tionσ0is determined as the sum of contributions from:
(i) the sum of observedexperimental partialγ-ray pro- duction cross sections feeding the ground state from all levels belowEc and directly from the capturing state (Pn
i=0σexptγi0 );
(ii) the simulated fraction of transitions feeding the ground state from the quasicontinuum (P0), i.e., within the excitation-energy rangeEc < E < Sn. Combining these two quantities allows for the total cross section to be rewritten as
σ0=
n
P
i=0
σγi0expt(1 +αi0) 1−P0
, (9)
whereαi0is the internal conversion coefficient for a tran- sition from levelito the ground state. In reality, the sum of observed ground-state transitions should be smaller than the determined cross section because of the un- known fraction of missing intensity aboveEc.
B. Level densities
TABLE IV: Resonance parameters determined for the GDER and GQER used in the statistical-model calculations.
Adopted parameters for the GDER corresponded to the listed mean values. The GDER parameters were obtained from a fit to the139La(γ, xn) data in Ref. [49] and GQER parameters are from a theoretical global parametrization used to describe isovector-isoscalar vibrations.
Resonance EG(MeV) ΓG(MeV) σG(mb)
GDER 15.31(2) 4.70(6) 335.3(16)
GQER 12.13 4.43 3.12
The nuclear LD dependence on excitation energy E, spin J, and parity π in the adopted models is assumed to have a separable form:
ρ(E, J, π) =ρ(E)f(J)π(E). (10) Here,ρ(E) denotes the total density of nuclear levels as a function of energy. The adopted spin-distribution factor f(E) is typically expressed using the formula [44]
f(J) = 2J+ 1 2σ2c exp
−J(J+ 1/2) 2σ2c
, (11) where σc is a spin-cutoff parameter andπ(E) describes the parity dependence as a function of excitation en- ergy. In this study, we considered two different LD models of the form ρ(E, J) = ρ(E)f(J): the constant- temperature formula (CTF) [45, 46] and the back-shifted Fermi gas (BSFG) [46, 47] models. The adopted LD models and their parametrizations, determined from fit- ting low-excitation-energy levels ands-wave neutron res- onances above the neutron-separation energySn[42, 43], are briefly described below.
The CTF model assumes a constant nuclear tempera- tureTthroughout the entire excitation-energy range and is given as
ρ(E, J) =f(J) T exp
E−E0
T
, (12)
whereE0is the energy-backshift parameter to correct for nucleon pairing, whileT may be interpreted as a critical temperature for breaking nucleon pairs. The adopted parametrizations according to the CTF LD model for
140La are listed in Table III. A parameter-free con- stant value is assumed for the spin-cutoff used in f(J) (Eq. (11)): σc= 0.98A0.29 from Refs. [42, 48].
The BSFG model is based on the assumption the nucleus behaves like a two-component noninteracting fermionic fluid and is given by
ρ(E, J) =f(J) exp[2p
a(E−E1)]
12√
2σca1/4(E−E1)5/4, (13) whereE1 is an excitation-energy backshift to correct for the fermion pairing andais the shell-model LD parame- ter. These parametrizations, as applicable to the BSFG
LD model for 140La, are also listed in Table III. The spin-cutoff parameter adopted for the BSFG model was proposed in Ref. [50] and has an energy dependence given by
σc2= 0.0146A5/3·1 +p
1 + 4a(E−E1)
2a . (14)
The parity-distribution function in Eq. (10) π(E) de- notes the fraction of positive- or negative-parity states as a function of energy. For the fraction of negative-parity states this implies
π(E, ρ−) = ρ−(E)
ρ−(E) +ρ+(E), (15) and because parity is conserved, the fraction of positive- parity states is simplyπ(E, ρ+) = 1−π(E, ρ−). An em- pirical model embodying a Fermi-Dirac functional form proposed by Al-Quraishiet al. [51] was used to describe the parity dependence in this work:
π(E) = 1 2
1± 1
1 + exp[c(E−δp)]
, (16) where the sign of the ± coefficient is determined ac- cording to the parity of the ground state, c is a parity- ratio parameter, andδp is an energy-shift correction re- lated to pairing. For 140La, the low-lying levels are predominantly characterized by negative parity includ- ing its ground state and, therefore, a negative sign is used in Eq. (16) to describe the parity distribution. The parametrizations from Ref. [51] for the odd-odd nucleus
140La were assumed for the statistical-model calculations:
c = 3.0 MeV−1 and δp = 0.0253 MeV. We also tested parity-independent LD models which were found to be consistent with our adopted parity-dependent approach.
C. Photon strength functions
Initial transitions in captureγ-ray cascades originating at the neutron-capture state are believed to dominantly have electric dipole (E1) character. Theseγrays are usu- ally modeled using the low-energy tail of the giant dipole electric resonance (GDER). In the region well above the neutron-separation energy, the shape of the GDER can be probed through photonuclear (γ, n) measurements.
At these higher energies, the shape of the resonance can usually be well described with a standard Lorentzian, of- ten referred to as the Brink-Axel (BA) model [52, 53].
ForEγ .Snthe shape of theE1 PSF is not well known, and different extrapolations of the BA model are typi- cally used.
To parametrize theE1 PSF we fit a single-component standard Lorentzian to the nearest-neighboring photonu- clear 139La(γ, xn) data of Beil et al. [49], shown in Fig. 6 in the interval 12 ≤ Eγ ≤ 17 MeV (illustrated with the solid-orange curve). The fitted-resonant en- ergy (EG), width (ΓG), and cross section (σG) results
are listed in Table IV. Our results compare reasonably well with those in the Reference Input Parameter Library (RIPL) [54]. Using these parameters in Table IV, we tested not only the BA model but also other models of the E1 PSF, namely: the Kadmenski, Markushev, and Fur- man (KMF) [55] and the generalized Lorentzian (GLO) [56] models.
The Brink-Axel function fBA(E1) for the E1 PSF is de- scribed by a standard Lorentzian according to
fBA(E1)(Eγ) = 1
3(π~c)2 · σGEγΓ2G
(Eγ2−EG2)2+Eγ2Γ2G, (17) where the constant 3(π1
~c)2 = 8.68×10⁻⁸mb−1 MeV−2. As shown in Fig. 6, the BA model describes the high- energy photonuclear data rather well, but it significantly overestimates the low-energy PSF data obtained using the Oslo Method [9, 10].
The BA model is dependent on Eγ alone. Both the KMF and GLO models, on the other hand, include an ad- ditional temperature dependence because they embody a temperature-dependent resonance width given by
ΓG(Eγ,Θ) = ΓG
EG2(Eγ2+ 4π2Θ2), (18) where the nuclear temperature Θ is a function of the excitation energy of the final levelEf, such that
Θ = q
(Ef−∆)/a. (19)
In Eq. (19),ais the shell-model LD parameter described in Sect. III B and the pairing energy for odd-odd nuclei is calculated using ∆ =−0.5|Pd|, wherePdis the deuteron- pairing energy tabulated in Ref. [42]. For 140La, Pd =
−2.079 MeV and, thus, ∆ =−1.0395 MeV.
The KMF model for theE1 PSF is then given by fKMF(E1)(Eγ,Θ) = 1
3(π~c)2 ·σGΓGEγΓG(Eγ,Θ)
(Eγ2−EG2)2 . (20) As in previous works, e.g., Refs. [25, 30, 31, 57], we have set the dimensionless Fermi-liquid parameter FK to a value of 0.7 [55, 58]. As shown in Fig. 6, the KMF model describes the Oslo data (i.e. the regionEγ .Sn) much better than the BA model.
The GLO model, developed by Kopecky and Uhl [56], connects the BA model near the maximum of the GDER with the KMF model at low γ-ray energy. This model has the following analytic form
fGLO(E1)(Eγ) = σGΓ2G 3(π~c)2
h FK
4π2Θ2ΓG
EG5
+ EγΓG(Eγ,Θ) (E2γ−E2G)2+Eγ2Γ2G(Eγ,Θ)
i . (21) Overall, Fig. 6 shows that the GLO model for theE1 PSF best reproduces both the low- and high-energy data.
A single-particle (SP) model [59, 60] was adopted in this work to describe the magnetic dipoleM1 strength.
Although we varied the SP strength to test its influence on the simulations, Fig. 6 suggests that any additional M1 strength is likely to be small because the models for the E1 PSF already reproduce the low-energy ex- perimental data adequately (KMF and GLO models), or over predict (BA model). Ultimately, a value of SP = 1×10⁻⁹ MeV−3 was adopted for the M1 PSF cf. the adopted value in previous studies of 180W [25],
183,185,187W [30] and186Re [31]. A scissors mode [61, 62]
for the M1 PSF was also considered in this work but it is expected to be very weak and did not produce any significant differences.
As a further consideration, we also tested the empir- ical function developed by Kheswa et al. [9] to fit the low-energy charged-particle [9, 10] and high-energy pho- tonuclear [49, 63] experimental strength function data for several lanthanum isotopes. This model combines three standard Lorentzians (BA model) with resonances centered on 6.4 MeV (σG = 2.9 mb, ΓG = 1.3 MeV), 9.9 MeV (σG = 15 mb, ΓG = 1.6 MeV), and 11.4 MeV (σG = 15 mb, ΓG = 1.4 MeV), together with a GLO model centered on a GDER with EG = 15.6 MeV, σG = 336 mb, and ΓG = 5.6 MeV. A fixed nuclear temperature Θ = 0.1 MeV was adopted in the GLO
[MeV]
Eγ
0 5 10 15 20 25
] -3 [MeVE1f
10-9
10-8
10-7
10-6
BA KMF GLO Kheswa
,n): 12-17 MeV γ
Fit ( γ,xn)
139La(
139La
3He)
3He,
139La(
140La La(d,p)
139
138La α)
3He,
139La(
FIG. 6: (Color online) Experimental data overlaid with BA [52, 53] (green dot-dashed line), GLO [56] (blue medium-dashed line), and KMF [55] (black long-dashed line) models describing the E1 PSF. The photonuclear
139La(γ, xn) data (filled-black circles) are taken from Ref. [49], the 139La(3He,3He’) data (filled-red squares) and the 139La(3He,α) data (open-green circles) are both taken from Ref. [9], and the139La(d, p) data (filled-blue triangles) are taken from Ref. [10]. The small-dashed purple curve la- beled as Kheswa corresponds to the PSF described in Ref. [9].
The solid-orange curve represents a Lorentzian fit to the giant dipole resonance observed over 12-17 MeV used to deduce the adopted parametrizations of the PSF.
component of this model in place of, and to remove the excitation-energy dependence given by, Eq. (19). The to- tal fitting function represented by this model is overlaid with the experimental data labeled “Kheswa” in Fig. 6.
Quadrupole strength is expected to contribute far less than dipole strength. We have modeled the contribution of theE2 PSF based on the giant quadrupole electric res- onance (GQER). This model uses a standard Lorentzian (SLO) with a single resonance to describe the isovector- isoscalar quadrupole vibration, given by
fSLO(E2)(Eγ) = 1
5(π~c)2 · σGΓ2G
Eγ[(E2γ−E2G)2+ (EγΓG)2], (22) where5(π1
~c)2 = 5.20×10⁻⁸mb−1MeV−2. GQER param- eters were calculated using the following global systemat- ics: EG = 63A−1/3 MeV [64], ΓG = 6.11−0.012AMeV [65], and σG = 1.5×10⁻⁴· Z2E2GΓA−1/3
G mb [65]. Our adopted parameters are listed in Table IV.
Photon strength corresponding to M2 and higher- order multipole transitions were not considered in mod- eling the neutron-captureγ-ray cascades in this work due to their expected insignificance.
IV. RESULTS AND DISCUSSION
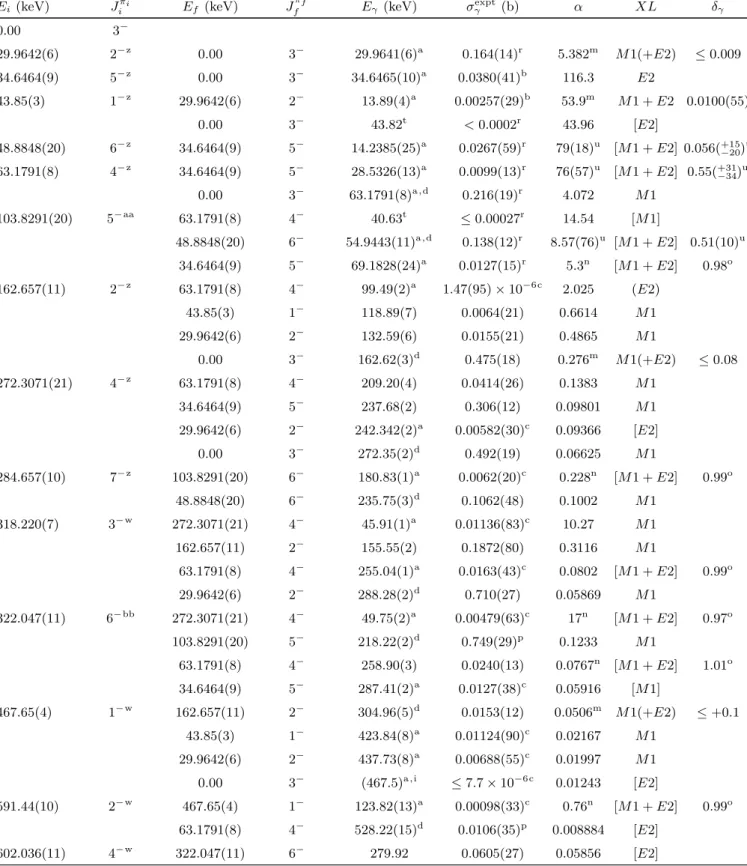
Table V lists partial γ-ray production cross sections (σγ) for 418γrays associated with 173 levels of the140La decay scheme [3] up to an excitation energy of 3009.8 keV.
Of these experimental transitions, 145 are primaryγrays originating at the neutron separation energy. A spin win- dow of 1 ≤ J ≤ 7, through both direct and indirect population, is observed. Using previous information in ENSDF [3], transitions measured in the prompt γ-ray spectrum were placed in the140La level scheme.
The nucleus140La is odd-odd (Z = 57,N = 83) with a relatively high level density. The 139La(n, γ) reaction populates many levels based on several possible configu- rations above theZ= 50 andN = 82 shell closures. The low-lying levels in the residual nucleus are well character- ized in terms of quasiparticle couplings between valence protons in the 1g7/2and 2d5/2orbits with neutrons in the 2f7/2 and 3p3/2 orbits [33, 34]. Earlier theoretical work suggests these negative-parity states involve the proton- neutron multiplets |π(ljp)⊗ν(ljn);|jp−jn|. . .|jp+jn|i where ljp(n) and jp(n) corresponds to the proton (neu- tron) orbital and the total angular momentum, respec- tively, of the aforementioned valence subshells. There is considerable evidence for mixing between these configu- rations [66], leading to a complicated level structure for
140La. Indeed, the failure of the Brennan-Bernstein cou- pling model in odd-odd nuclei [67] for140La, which pre- dicts 6− for its ground-state spin-parity rather than 3− [3], is not surprising as the mixing between quasiparticle configurations shifts the level ordering with respect to the pure configuration limits. Furthermore, theoretical cal- culations that underestimate configuration mixing fail to
accurately reproduce the low-lying spins, e.g., Ref. [68].
These observations, together with the underlying theo- retical conjecture, are consistent with the observed com- plicatedγ-ray spectrum shown in Fig. 1.
Theγ-ray transitions observed in this work have been obtained from a singles measurement. Many of the γ- ray signals occur in close proximity to one another lead- ing to peaks that are often superimposed on top of one another rendering direct measurement of the intensity difficult. In these cases, identified by footnotes in Ta- ble V, branching ratios from ENSDF [3] were used to normalize the cross sections. The normalization transi- tion for each level, usually the strongestγ-ray branch, is also indicated. For certain transitions, also noted in Ta- ble V, limits on theγ-ray intensities depopulating a level could only be established through the measured feeding intensity (Pm
j=1σγj) to that level. Here, we assume the depopulation of the level must be at least equal to, or greater than, the observed feeding. The lower limit for a transition depopulating a given level is obtained as
σγi ≥
m
P
j=1
σγj(1 +αj)
n
P
i=1
bRi(1 +αi)
bRi, (23)
wheremandndenote the total number ofγrays feeding (j) and deexciting (i) the level, respectively, and bRi is the ENSDF-reported [3] branching ratio. Limits on γ- ray cross sections for transitions deexciting the following levels were all determined using Eq. (23): 1188.4, 1672.6, 1686.8, 1736.0, 1744.0, 1818.4, 1823.5, 1842.1, 2006.1, and 2125.5 keV. In addition, for severalγ-ray transitions a contaminant contribution to the observed multiplet, ei- ther from the background or another transition of similar energy, was subtracted from the observed peak intensity to arrive at the reported cross sections. These transitions are also identified with footnotes in Table V.
The level energies of 140La in Table V were obtained from a recoil-corrected least-squares fit to the exper- imental Eγ data. These energies compare well with the adopted values in ENSDF [3]. Spin-parity assign- ments for the levels involved, γ-ray transition multipo- larities (XL) and multipole mixing ratios (δγ) reported in Table V were taken from ENSDF [3] where available, and internal-conversion coefficients (α) were recalculated with BRICC [40] according to the tabulated transition multipolarities. The Jπ values could be verified for all but one of the first ten levels up to our established critical energyEc = 285 keV (see Sect. IV B). Unknown tran- sition multipolarities were assumed to be characterized by the lowest multipole order consistent with angular- momentum selection rules cf. Weisskopf single-particle estimates. Although many of these transitions may, in fact, have mixed-multipole character (with an E2 ad- mixture), for most transitions (Eγ &200 keV) this will have a negligible impact on the α-corrected cross sec- tions. On the other hand, for several lower-energy tran- sitions belowEc,δγ was adjusted to optimize agreement
with the observedγ-ray intensity balance (see Sect. IV E) and statistical-model calculations. Similar investigations withδγ have been carried out previously in181W [25] and
186Re [31].
A. Capture-stateJπ composition
In neutron capture the spin of the capture state (Jc.s.) in the compound nucleus is determined by~Jc.s.=~Jg.s.+
~l+~s, whereJg.s.represents the ground-state spin of the target nucleus, l is the neutron orbital angular momen- tum and s = ±1/2 is the neutron spin angular mo- mentum. The parities of the two states are related by πc.s.=πg.s.(−1)l. In thermal neutron capture l= 0 and because the ground state of139La is 7/2+, capture-state resonances in the140La compound nucleus haveJπ= 3+ and 4+. The sum of the cross sections for populating low-spin (σ(−);Jπ= 3+) and high-spin (σ(+);Jπ = 4+) resonances, together with that of any bound resonances (σ(B), whereEB < Sn), contribute to the total thermal neutron-capture cross section:
σ0=σ(−) +σ(+) +σ(B). (24) In the 139La target there is a single bound resonance where EB = −48.63 eV, J = 4, and σ(B) = 8.955 b [27]. Using the recommended values of σ(−) = 0.084 b and σ(+) = 0.005 b for populating the 3+ and 4+ cap- ture states aboveSn[27], respectively, the spin-fractional composition of the capture state may be deduced from
F−= σ(−) σ0
and F+=σ(B) +σ(+) σ0
, (25) where F−+F+ = 1. For the statistical-model calcu- lations described in this work we adopt a capture-state compositionJc.s.π = 3+(0.9%) + 4+(99.1%) based on the recommended values above [27], which agrees well with our experimental data.
Because the prevailing decay from the capture state proceeds via E1 transitions, direct feeding of negative- parity states dominate the decay process and a spin win- dow of 2− ≤ Jπ ≤ 5− may be observed. However, given that the overwhelming contribution comes from a 4+ state, this implies the range 3− ≤Jπ≤5−is favored.
Indeed, Table V shows that primary-γ decays to final levels below∼1 MeV withJπ = 3−, 4−, or 5−, are, on average, more than an order of magnitude stronger than decays to a 2− level. Using this information together with the observed systematics, we impose the following limitations on γ-ray multipolarity and final-level Jπ as- signments to improve the decay scheme where possible:
Jπ = (3−,4−,5−) for levels fed by primary γ rays with σγ ≥ 0.01 b assuming E1 character and a 4+ capture state;J = (2,3,4) for levels fed by primaryγ rays with σγ < 0.01 b assuming E1 or M1 character and a 3+ capture state. Footnotes are used to identify these as- signments in Table V.
B. Constraints on the140La decay scheme In our previous works on light [69], medium-mass [29, 57, 70], and heavy nuclei [25, 30, 31], it has been demonstrated that comparison of experimental depopu- lation with simulated population of individual levels is a powerful tool for constraining nuclear structure proper- ties and decay-scheme completeness. The simulated pop- ulation of a levelPLsim is calculated withDICEBOX as a fraction per neutron capture, while the measured exper- imental intensities are determined as absolute cross sec- tions. Clearly, it is important we compare simulated and experimental quantities with the same units. To achieve this, we converted the experimental values to intensities per neutron capture of a levelPLexptusing the relation
PLexpt=
n
X
i=1
σγi(1 +αi)
σ0 , (26)
where n is the number of γ rays depopulating a given level. Preempting the following discussion in this section, representative comparisons of the simulated population with experimental depopulation are shown in Figs. 7(a):(i) and 7(b):(i) for all levels below Ec. These plots were generated using the GLO/CTF model combination for the E1 PSF/LD, assuming the PSF parametrization in Table IV and the LD parametrization of Ref. [43]. Porter-Thomas fluctuations from indepen- dent nuclear realizations give rise to the uncertainties on the ordinate, while the experimental uncertainty in the measured cross sections generate those on the abscissa.
The uncertainty onσ0 has not been propagated through because this quantity was only used to normalizePLexpt. Agreement between model and experiment is indicated by the close proximity of results to the slope of unit gra- dient and through their corresponding residuals R, de- fined asR =PLsim−PLexpt, shown in Figs. 7(a):(ii) and 7(b):(ii).
According to the present (n, γ) analysis and previ- ous information in ENSDF [3], we have decided to set Ec to 285 keV. There are 10 levels below this value of Ec. The good agreement between simulation and ex- periment (e.g., Fig. 7(a)) provide support for choosing a set of adopted models (see Sect. IV F) and the corre- sponding nuclear structure information for all levels be- lowEc: γ-ray transition energies, internal-conversion co- efficients, branching ratios, multipole-mixing ratios, and spin-parity assignments.
All levels belowEc are considered to have firmJπ as- signments, apart from the two ENSDF-reported levels at 92.8 and 106.1 keV [3], each of which have unknownJπ assignments and no γ-decay branches are known. The only evidence for the 92.8-keV level is from a much ear- lier139La(d, p) measurement [66] where the authors claim that the observed weakly populated structure may not be real, leading to a tentative assignment. No other mea- surements have been able to confirm this level and we find no evidence supporting its assignment in this work.

![FIG. 6: (Color online) Experimental data overlaid with BA [52, 53] (green dot-dashed line), GLO [56] (blue medium-dashed line), and KMF [55] (black long-dashed line) models describing the E1 PSF](https://thumb-eu.123doks.com/thumbv2/9dokorg/1314835.105808/9.892.492.827.604.833/color-online-experimental-overlaid-dashed-medium-dashed-describing.webp)
![FIG. 7: (Color online) Upper panels (a):(i) and (b):(i): The simulated population (per neutron capture) of levels below the critical energy of 285 keV versus their experimental depopulation (per neutron capture) assuming using the GLO [56] model for the PS](https://thumb-eu.123doks.com/thumbv2/9dokorg/1314835.105808/13.892.93.830.77.500/simulated-population-neutron-capture-critical-experimental-depopulation-assuming.webp)