28-Mev Linear Accelerator
F. D . BROOKS and J. R. BIRD
Atomic Energy Research Establishment, Harwell, England
1. The Linac Facilities
T he Harwell 28-Mev electron linac1 r u n n i ng into t he " b o o s t e r"
target is, for our purposes, a pulsed neutron source wit h the following properties. T he pulse repetition frequency is 200 per second, t he pulse width is 0.25 /xsec (minimum), a nd t he neutron intensity during t he pulse is ~ 1 017 neutrons/second.
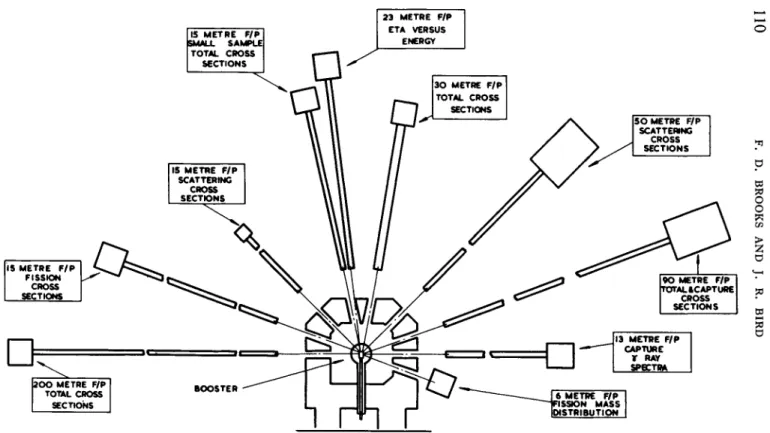
Figure 1 indicates how 10 flight paths are at present disposed about the booster for various cross section measurements. T he longest path (200 meters) is used for total cross section work. Other paths are used for fission, scattering, a nd capture cross sections, respectiv- ely, while another is used for measurements of eta versus energy.
T he shorter flight paths, 13 and 6 meters, respectively, are used for studies of capture y-ray spectra for different resonances, a nd fission mass distributions for different resonances, respectively. T he total cross section facility at 15 meters is designed for small-sample work, and we are hoping that this wil l p ut us into competition wit h c h o p- pers for measurements on separated isotopes a nd fission products.
Signals from t he 10 detector stations are cabled back to a central laboratory, housed in t he same building as t he accelerator, for time- of-flight analysis. F or this analysis we have seven 100-channel units, one 1000-channel unit, a nd a digital magnetic tape recording system2 which is equivalent to four 4096-channel time analyzers.
For t he remainder of this paper we wil l confine ourselves to t wo of the partial cross section experiments mentioned above. T h e se are (i) a measurement of eta versus neutron energy for U2 3 5, a nd (ii ) an investigation of capture y-ray spectra for different resonances i n P t1 9 5.
2. Measurement of Eta Versus Neutron Energy
T he experiment to measure η, the n u m b er of p r o m pt fission neutrons emitted p er neutron absorbed, as a function of incident neutron
109
FIG. 1. Layout of neutron cross section experiments utilizing the Harwell "booster" pulsed neutron source.
0 F. D. BROOKS AND J. R. BIRD
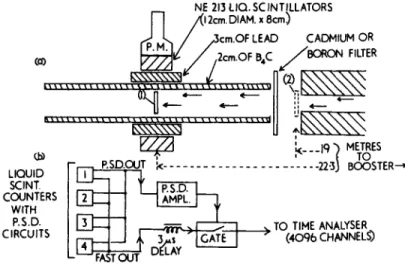
energy, E, is similar, in principle, to several other "direct'' measure- ments 3 -7 on the three most a b u n d a nt fissile nuclei. Figure 2(a) shows the experimental arrangement, a flight path wit h sample positions, (1) at 22.3 meters and (2), at 19 meters from the pulsed neutron source. T he fission neutron detector, which is at 22.3 meters, consists of four liquid scintillation counters ( N E 213 liquid* ) in parallel. Each counter has a fast o u t p ut for timing and a pulse shape discriminator to bias out y-ray scintillations. T h e se o u t p u ts
LIQUID SCINT.
COUNTERS WITH
P.S.D.
CIRCUITS
NE 213LIQ.SCINTILLATORS J 2cm. DIAM.x8cm)
CADMIUM OR 'BORON FILTER
ν TO TIME ANALYSER
* (4096 CHANNELS)
L" FAST OUT
FIG. 2. a, Experimental arrangement for the measurement of eta; b, block diagram of pulse shape discrimination system.
are coupled as shown in Fig. 2(b); the fast o u t p ut is delayed 3 ^sec whil e the P . S . D. amplifier decides whether to gate it t h r o u gh to the time analyzer as a neutron scintillation. T h is P . S . D. s y s t e m8 enables us to gate out more than 9 9 . 9% of the y-rays detected in the scintillator, irrespective of y-energy. At the same time, the detection efficiency for fission neutrons, as measured using a calibrated P u2 40 spontaneous fission source, is ~ 5 %.
F o ur u r a n i um metal samples ( 9 3% U2 3 5, 6% U2 3 8, 1 % U2 3 4) w e re used for the measurement of η for U2 3 5. I n this paper we present some of t he data obtained using the thickest sample, "sample A , "
which was a disk of 3.1-inch diameter and 8.95 g m / c m2 U2 3 5. Sample
* Supplied by Nuclear Enterprises (G.B.) Ltd., Edinburgh, Scotland.
B, of 8.59 g m / c m2 U2 3 5, but otherwise similar to A, fulfille d an important auxiliary role in this measurement on "sample A . "
T he η measurement using A was divided into two broad energy regions, 0.7-11 and 5-300 ev, respectively. I n the lower energy region the c a d m i um filter was used [see Fig. 2(a)] and the time-of- flight resolution was 44 nsec/meter. T he boron filter was used in the upper region and the resolution there was 11 nsec/meter. T h r ee time-of-flight runs were made in each region to measure:
(a) the count rate F, wit h A at position (1) [Fig. 2(a)];
(b) the count rate wit h Β at (1); and
(c) the count rate wit h Β at (1) and A in transmission, at (2).
R un (c) divided by r un (b) t h us gave Γ, the fraction of neutrons transmitted by A. By using this "self-detection" method we have ensured that F and Τ are measured wit h essentially identical resolution. Eta was calculated from the formula
where k is the detector efficiency, which may be assumed to be constant provided that ν the average n u m b er of neutrons per fission is constant, N(E) is the n u m b er of incident neutrons as a function of energy, and φ is the scattering correction factor.
Additional time-of-flight runs were made to determine relative values of N(E) and to normalize the relative values of η thus obtained to the thermal value η = 2.077.9 T he spectrum N(E) was measured using a thin B F3 counter detector known to have an efficiency which varied as (E)~1/2. T he data were normalized to the thermal η value by a c a d m i um difference method.
T he scattering factor, φ, is difficul t to measure or calculate. A simple analysis covering only the possibilities of scattering out of the sample or absorption after one scattering, and neglecting the small energy shift in scattering, gives for φ:
φ-Υ Ο)
V = k · N(E) · (1 - Γ)
Φ = [1 — (σ^/στ)2 — T' · σ$Ι στ{ \ — asjaT)] 1 (2) where a s and στ are the scattering and total cross sections, respec-
tively, of the sample, and T' is the sample transmission averaged over the paths of the scattered neutrons. As yet we have not attempted
to measure or calculate φ exactly. Instead we have calculated η only at energies where we could reasonably assume that 1.00 < φ < 1.05.
For sample A this meant, i n practice, that we calculated η only where the transmission, T, was measured to be less than ^ 0 . 3 .
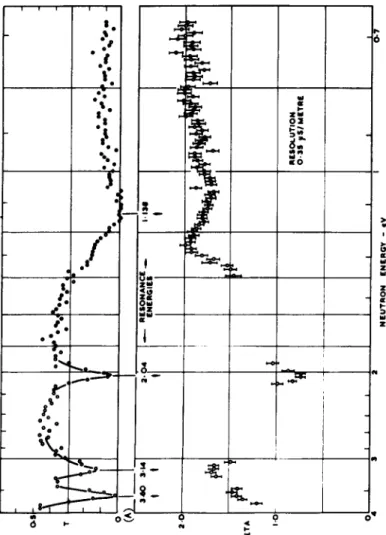
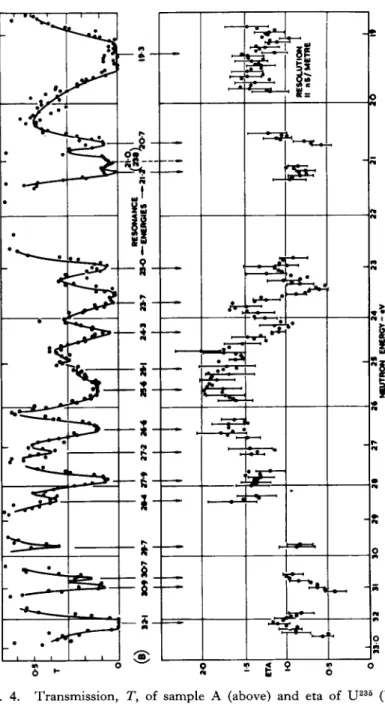
Figures 3 and 4 show the measurements of transmission, Γ , a nd eta from 0.7 to 33 ev incident neutron energy. T h e re are many gaps in the eta data due to the lack of information on φ. However, we are able to present data at most of the resonance energies and also, i n several cases, to determine t he behavior of η over resonances. I n many of these cases the result is that η varies t h r o u gh the resonance, a result which is similar to that which Bollinger5 ,6 observed i n several P u2 39 resonances a nd which suggests resonance-resonance inter- ference i n t he fission process. Such interference implies of course, that we cannot analyze resonance fission cross sections i n terms of the single level Breit-Wigner formula. However, if following T e i c h m a n n10 we assume that t he single level formula is a good approximation (i.e., that interference is a m i n i m um a nd can be neglected) at the resonance energy, we can w r i t e4 for values, ηκ, of eta at resonance energies:
VR
i. e.,
r
f=
F*
, (3)where Γγ and T1 are radiation and fission widths, respectively. T h u s, if we know, or can assume, values for ν a nd Γγ9 we can arrive at values for rf. Some fission widths obtained by t a k i n g11 ν = 2.43 and assuming a constant radiation w i d t h12 Γγ = 33 M ev are shown and compared wit h recent B N L - 3 25 d a t an( u ) in Table I. T he agree- m e nt between the two sets of data is quite good. A useful b y - p r o d u ct of t he direct eta measurement might therefore be that it affords a simple, and perhaps reliable, method of determining fission widths.
3. Gamma-Rays from Platinum Resonances
I n the study of the intensities of individual y-rays following reso- nance neutron capture, it is desirable to have t he best available y-ray resolution. Al l measurements to date have been made wit h
FIG. 3 . Transmission, T, of sample A (above) and Eta of U2 35 (below)
versus incident neutron energy; a, from 0 . 7 to 4 . 0 ev at 0 . 3 5 /usee/meter resolution; 6, from 2 . 8 to 3 . 7 ev and from 4 . 6 to 1 1 . 0 ev at 4 4 nsec/meter resolution.
FIG. 4. Transmission, T, of sample A (above) and eta of U2 35 (below)
versus incident neutron energy; a from 1 1 . 5 t o l 8 . 5 e v; o from 19.0 to 33.0 ev.
Resolution = 1 1 nsec/meter.
T A B L E I
FISSION W I D T H S OF U2 35 NEUTRON RESONANCES
Resonance
energy (ev) 1.14 2.04 3.14 3.60 4.84 6.1 6.38 7.1 8.78 9.26
14 76 46
Fission (a) 94 Widths
(Mev) (6) 106 ± 1 1 12 ± 3 115 ± 4 4 45 ± 4 4 ± 3
5.1 56 10.8 24 65 56
9 ± 1 23 ± 18 60 ± 6 —
(a) Calculated from the value η of eta at resonance energy assuming ν = 2.43, Γγ = 33 Mev.
(b) Value given in Hughes and Schwartz.11
8 F. D. BROOKS AND J. R. BIRD
single sodium iodide crystals of as large a size as possible in order to reduce the effect of pair escape events. By using an additional crystal to detect escaping 0.51-Mev y-rays in coincidence wit h a primary event an appreciable improvement in line shape can be achieved. T h is technique has been used to measure the intensity of the three highest energy y-rays from the first three resonances in P t1 9 5.
FLIGHT TUBE PLATINUM TARGET
INCIDENT NEUTRONS
Ι 8 0 0
M O O
COINC. A ,\
" SINGLES 7 4 9 M W
\ !
1 1 1 1
11,
4 6 GAMMA-ENERGY
McV 8
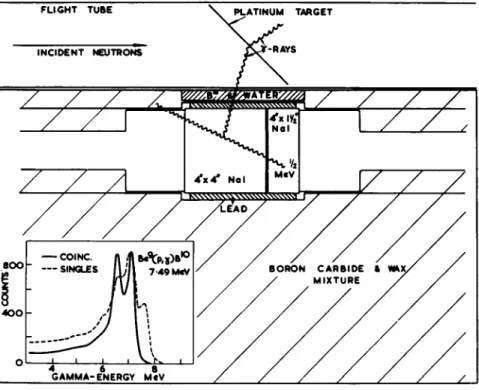
FIG. 5. Experimental layout for the measurement of y-ray spectra from resonant neutron capture in platinum. Inset shows pulse-height spectra obtained from the 4 x 4 inch N a l (Tl) crystal using the 7.49 Mev y-ray from B e9 (py y) B10 ; (i) broken curve, no coincidence required ; (ii) solid curve, requiring a coincident 0.5-Mev y-ray detected in the 4 X 1.5 inch N a l (Tl) crystal. Curves (i) and (ii) are normalized to equal count rate at the first escape peak. The actual count rate with coincidence is 15 times less than without coincidence.
T he experimental layout is shown in Fig. 5. T he target of 250 gm of platinum is at 13.5 meters from the neutron booster and the time
of detection of y-rays defines the time-of-flight of the captured neutrons wit h a resolution of 25 nsec/meter. T he primary y-ray detector is a 4 by 4 inch N al crystal beside which is a 4 by 1.5 inch crys- tal. T he line shape obtained wit h this method is shown in Fig. 5 (inset) for the 7.49-Mev y-ray from B e9 (p, y) B1 0. T he coincidence require- ment removes the total energy peak and many C o m p t on events.
1 0 , 0 0 0
ι,οοο
D Z
8
IOO
°οοβ£Ι*»*
, ç5 r ^ „4 196
•o
ί Γ
1 I
• oo •
ο 11.9 eV R E S O N A N C E
• 19.6 «V M
• 6 8 cV ··
- 2 ND. EXC SX - I ST EXC. ST - G R O U N D ST
OO oo -çp
,w 5 6 7 8 M e V
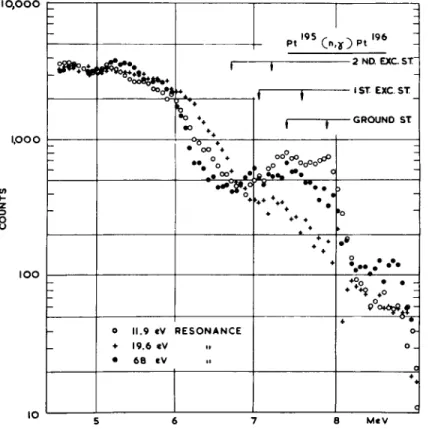
FIG. 6 . Coincidence pulse-height spectra obtained for the 1 1 . 9 ev (open circles), 1 9 . 6 ev (crosses) and 6 8 ev (solid circles) neutron resonances in P t1 9 5. The energy calibration of the abcissa indicates electron pulse height in Mev plus 0 . 5 Mev.
I t also reduces the counting rate in the first escape peak by a factor of 15. T he first and second escape peaks are resolved m u ch better than usual, partly because of the removal of C o m p t on events, but chiefly because the primary events that are favoured by the technique,
occur in a slab of the main crystal parallel to the photomultiplier so that the optical efficiency is more uniform than normal. T he line shape has been measured for a n u m b er of y-rays in the energy range 4 to 10 M ev and analyzed in terms of Gaussian peaks plus a C o m p t on tail. T he width of the peaks are found to increase only slowly wit h energy.
I n order to measure the spectra from resonances, the neutron time-of-flight and the pulse height from the large crystal were recorded digitally on magnetic tape. T h is method allows the resonance area to be determined for each pulse-height channel so that the background is determined and removed from the one set of data without requiring repeated runs. T he spectra thus obtained for the first three resonances in P t1 95 are shown in Fig. 6. T he ordinate is the actual n u m b er of counts for the 11.9-ev resonance, the other curves having been normalized to equal areas. T he arrows show the posi- tions at which peaks are expected for the transitions from the captur- ing state to the ground state of P t1 96 and to the first and second excited states. T he known line shapes for these three y-rays have been used in a least squares program to determine the intensity of each transition at each resonance.
T he spectra do not show zero counts above the g r o u nd state peaks indicating that there is some contribution having a resonance shape which can be attributed to chance coincidences. T h is has been correct- ed for, by using the shape of the spectrum for the 96-ev resonance (which involves capture in P t1 9 8) for energies above the binding energy which is 6.5 Mev. T h is shape was normalized to the observed count rate above the ground state peaks for each P t1 95 resonance spectrum. T he normalizing factor was found to be approximately equal to the ratios of the total count rates for the respective resonan- ces. T h is correction changes the individual y-ray intensities by the order of 1 0% but gives a notable improvement in the least squares fitting .
T he relative intensities of the various y-rays are given in Table I I normalized to unity for the ground state transition of the 68.5-ev resonance. T he errors quoted include contributions from both the statistical errors and systematic errors. T he latter were estimated from the effect of various changes on the assumptions involved in the process of fitting line shapes.
T he results are also given in Table I I of measurements made wit h thermal neutrons using a c a d m i um difference technique, but
T A B L E I I
RELATIVE INTENSITIES OF CAPTURE GAMMA RAYS FOR RESONANCES IN P T1 95 + η
Neutron energy (ev)
Gamma raya
Relative intensities Neutron
energy (ev) Gamma
raya
Singles Singles Coinc.
Bollinger
et al.13
Yo 1.00 1.00 1.00 1.00
11.9 Yi 0.29 ± 0.1 0.53 ± 0.1 0.40 ± 0.1 < 0.05
Ύ2 < 0.02
Yo 0.29 ± 0.05 0.20 ± 0.05 0.16 ± 0.03 0.25 ± 0.03 19.6 Υι 0.19 ± 0.05 0.23 ± 0.05 0.23 ± 0.05 0.10 ± 0.02
Ύ2 0.25 ± 0.03
Yo 0.48 ± 0.1 0.67 ± 0 . 1 5 0.45 ± 0.08 0.43 ± 0.04 68.5 Υι 0.52 ± 0.1 0.67 ± 0 . 1 5 0.51 ± 0.1 0.24 ± 0.06
Υ2 0.12 ± 0.03
Groshev et al.14t Kinsey et α/.14
Thermal Υο 0.4 0.4 0.3
(not nor- Υι 0.4 0.2
malized) Υ2 0.35 0.6 0.2
a Yoy Yu Y2—transitions from capturing state to ground state, 1st, and 2nd excited states, respectively.
these are on an arbitrary intensity scale not normalized to the values i n the rest of the table. T he relative intensities of the three y-rays agree reasonably well wit h the results of previous experiments considering the poor accuracy involved in the difference measure- ments. T he first two sets of results for resonances given in Table I I are the results of earlier measurements made wit h a single sodium iodide crystal as the y-ray detector. T h e se show quite satisfactory agreement for the intensities deduced for the ground and first excited state transitions. However, a comparison wit h the results of Bollinger et al.13 show rather poor agreement unless larger systematic errors are assumed to dominate this type of measurement.
ACKNOWLEDGMENTS
We would like to express our thanks to Dr. Alexander Langsdorf, visitor to us from Argonne National Laboratory, who collaborated in the early
stages of the capture y-ray experiment. We are also indebted to Miss M. R.
Avery for assistance in that experiment and to Mr. J. E. Jolly and Miss G.
Holman for assistance in the measurement of eta versus energy for U2 3 5.
REFERENCES
1. M. J. Poole and E. R. Wiblin, Proc. 2nd. Intern. Conf. Peaceful Uses of Atomic Energy, Geneva, 1957 14, 266 (1958).
2. J. R. Waters and J. R. Bird,-Nucleonics 19, 17 (1961).
3. H. Palevsky, D . J. Hughes, R. L. Zimmerman, and R. M. Eisberg, J. Nuclear Energy 3, 177 (1956).
4. F. J. M . Farley, J. Nuclear Energy 3, 33 (1956).
5. L. M. Bollinger, O.R.N.L. Rept. O R N L - 2 3 0 9 , p. 167 (1956).
6. L. M. Bollinger, R. E. Cote, and G. E. Thomas, Proc. 2nd. Intern. Conf.
Peaceful Uses of Atomic Energy, Geneva, 1957 15, 127 (1958).
7. M. L. Yeater, R. W. Hockenbury, and R. R. Fullwood, Nuclear Sci. &
Engr. 9, 105 (1961).
8. F. D . Brooks, R. W. Pringle, and B. L. Funt, I.R.E. Trans, on Nuclear Sci. NS-7, 35 (1960).
9. R. L. Macklin et al, O . R . N . L . 60-2-84 (1960).
10. T . Teichmann, Phys. Rev. 77, 506 (1950).
11. D . J. Hughes and R. B. Schwartz, "Neutron Cross Sections," B N L 325, 2nd. ed. 1958.
12. W. W. Havens and E. Melkonian, Proc. 2nd. Intern. Conf. Peaceful Uses of Atomic Energy, Geneva, 1957 15, 99 (1958).
13. L. M. Bollinger, R. E. Cote, and T . J. Kennett, Phys. Rev. Letters 3, 376 (1959).