The Blue Supergiant Progenitor of the Supernova Imposter AT 2019krl
Jennifer E. Andrews,1Jacob E. Jencson,1 Schuyler D. Van Dyk,2 Nathan Smith,1Jack M. M. Neustadt,3 David J. Sand,1 K. Kreckel,4 C. S. Kochanek,3 S. Valenti,5 Jay Strader,6 M. C. Bersten,7, 8, 9
Guillermo A. Blanc,10, 11 K. Azalee Bostroem,5 Thomas G. Brink,12 Eric Emsellem,13, 14
Alexei V. Filippenko,12, 15 Gast´on Folatelli,7, 8, 9 Mansi M. Kasliwal,16 Frank J. Masci,2 Rebecca McElroy,17 Dan Milisavljevic,18 Francesco Santoro,19 andTam´as Szalai20, 21
1Steward Observatory, University of Arizona, 933 North Cherry Avenue, Tucson, AZ 85721-0065, USA
2Caltech/Spitzer Science Center, Caltech/IPAC, Mailcode 100-22, Pasadena, CA 91125, USA
3Department of Astronomy, The Ohio State University, 140 West 18th Avenue, Columbus, OH 43210, USA
4Astronomisches Rechen-Institut, Zentrum f¨ur Astronomie der Universit¨at Heidelberg, M¨onchhofstraße 12-14, 69120 Heidelberg, Germany
5Department of Physics, University of California, 1 Shields Avenue, Davis, CA 95616-5270, USA
6Department of Physics and Astronomy, Michigan State University, East Lansing, MI 48824, USA
7Instituto de Astrof´ısica de La Plata (IALP), CONICET, Paseo del bosque S/N, 1900, Argentina
8Facultad de Ciencias Astron´omicas y Geof´ısicas, Universidad Nacional de La Plata, Paseo del Bosque, La Plata, Argentina
9Kavli Institute for the Physics and Mathematics of the Universe (WPI), The University of Tokyo, 5-1-5 Kashiwanoha, Kashiwa, Chiba, Japan
10The Observatories of the Carnegie Institution for Science, 813 Santa Barbara Street, Pasadena, CA 91101, USA
11Departamento de Astronom´ıa, Universidad de Chile, Casilla 36-D, Santiago, Chile
12Department of Astronomy, University of California, Berkeley, CA 94720-3411, USA.
13European Southern Observatory, Karl-Schwarzschild-Straße 2, D-85748 Garching bei M¨unchen, Germany
14Univ. Lyon, ENS de Lyon, CNRS, Centre de Recherche Astrophysique de Lyon UMR5574, F-69230 Saint-Genis-Laval France
15Miller Institute for Basic Research in Science, University of California, Berkeley, CA 94720 USA
16Division of Physics, Mathematics, and Astronomy, California Institute of Technology, Pasadena, CA 91125, USA
17Sydney Institute for Astronomy, School of Physics, A28, The University of Sydney, NSW, 2006, Australia
18Department of Physics and Astronomy, Purdue University, 525 Northwestern Avenue, West Lafayette, IN 47907, USA
19Max Planck Institut f¨ur Astronomie, K¨onigstuhl 17, D-69117 Heidelberg, Germany
20Department of Optics and Quantum Electronics, University of Szeged, H-6720 Szeged, D´om t´er 9., Hungary
21Konkoly Observatory, Research Centre for Astronomy and Earth Sciences, H-1121 Budapest, Konkoly Thege Mikl´os ´ut 15-17, Hungary
(Received September 26, 2020; Revised August 31, 2021; Accepted June 8, 2021) Submitted to ApJ
ABSTRACT
Extensive archival Hubble Space Telescope, Spitzer Space Telescope, and Large Binocular Telescope imaging of the recent intermediate-luminosity transient, AT 2019krl in M74, reveal a bright optical and mid-infrared progenitor star. While the optical peak of the event was missed, a peak was detected in the infrared with an absolute magnitude ofM4.5µm=−18.4 mag, leading us to infer a visual-wavelength peak absolute magnitude of−13.5 to−14.5. The pre-discovery light curve indicated no outbursts over the previous 16 yr. The colors, magnitudes, and inferred temperatures of the progenitor best match a 13–14 M yellow or blue supergiant (BSG), if only foreground extinction is taken into account, or a hotter and more massive star, if any additional local extinction is included. A pre-eruption spectrum of the star reveals strong Hα and [N ii] emission with wings extending to ±2000 km s−1. The post- eruption spectrum is fairly flat and featureless with only Hα, Na I D, [Ca II], and the Ca II triplet in emission. As in many previous intermediate-luminosity transients, AT 2019krl shows remarkable observational similarities to luminous blue variable (LBV) giant eruptions, SN 2008S-like events, and
Corresponding author: Jennifer E. Andrews jandrews@gemini.edu
arXiv:2009.13541v2 [astro-ph.SR] 27 Aug 2021
massive-star mergers. However, the information about the pre-eruption star favors either a relatively unobscured BSG or a more extinguished LBV withM >20 M likely viewed pole-on.
Keywords: stars: massive, supergiants — supernovae: individual (AT 2019krl) 1. INTRODUCTION
Existing in the magnitude space between traditional supernovae (SNe) and classical novae lies a menagerie of explosive and eruptive transients with peak magnitudes in the range −10 < MV <−15 mag and optical spec- tra dominated by narrow- or intermediate-width Balmer emission lines. These “SN imposters” (Van Dyk et al.
2000;Smith et al. 2011;Kochanek et al. 2012;Van Dyk
& Matheson 2012) may arise from a variety of progen- itors and have been attributed to a number of poten- tial physical mechanisms, including instabilities near the Eddington limit (Humphreys & Davidson 1994;Smith &
Owocki 2006;Owocki et al. 2004), instabilities in nuclear burning in late post-main-sequence evolution (Shiode &
Quataert 2014;Smith & Arnett 2014), stellar mergers or common-envelope phases in binary star systems (Soker
& Kashi 2013;Kochanek et al. 2014;Smith et al. 2016b, 2018), or electron-capture supernovae (ecSNe;Botticella et al. 2009;Kochanek et al. 2012;Adams et al. 2016).
Originally, the handful of known SN imposters were interpreted as giant eruptions of massive stars akin to η Carinae’s Great Eruption (Van Dyk et al. 2000;
Goodrich et al. 1989;Filippenko et al. 1995;Humphreys et al. 1999; Smith et al. 2001). While giant eruptions are one type of outburst experienced by luminous blue variables (LBVs), they are phenomenologically different from the lower-amplitude, irregular, S-Doradus varia- tions that are more commonly seen in LBVs (van Gen- deren 2001; Clark et al. 2005;Smith et al. 2011;Smith 2017;Weis & Bomans 2020;Davidson 2020).
Over the years, as more intermediate-luminosity tran- sients have been discovered and a broader diversity was seen in their light curves, spectra, and possible pro- genitors, they were grouped into three broad classes of events: (1) giant eruptions of massive LBVs, (2) SN 2008S-like events (also known as intermediate- luminosity red transients, ILRTs, or intermediate- luminosity optical transients, ILOTs) that have been proposed as eruptions of heavily dust enshrouded blue supergiants or explosions of super-asymptotic-giant- branch (AGB) stars as ecSNe, and (3) luminous red novae (LRNe), which have usually been interpreted as binary mergers or common-envelope (CE) ejections in low- or intermediate-mass stars. All of these involve large amounts of episodic mass loss, and many of them share observed properties that blur the distinction be- tween categories. For example, LBVs can experience
super-Eddington eruptions which are accompanied by large amounts of mass loss (Smith & Owocki 2006;
Owocki et al. 2004), but some LBV eruptions might also be the result of stellar mergers (Smith et al. 2016b, 2018;Pastorello et al. 2019a). The most well known ex- ample of the phenomenon was the Great Eruption ofη Car (Smith 2012;Smith et al. 2018). The SN 2008S-like events are characterized by a highly obscured dusty pro- genitor, and strong [CaII] and CaIInear-infrared (NIR) triplet emission lines in their spectra (Prieto et al. 2008, 2009;Thompson et al. 2009), but some LBVs including η Car exhibit all these properties as well (Smith et al.
2011,2016b,2018). The SN 2008S-like transients have been interpreted as arising either from a terminal low- luminosity SN event (Botticella et al. 2009; Kochanek et al. 2012; Adams et al. 2016) or from massive-star outbursts in a dusty cocoon (Berger et al. 2009; Bond et al. 2009;Smith et al. 2009;Humphreys et al. 2011).
With the discovery that the outburst of V1309 Sco was due to the merger of an inspiraling binary system of 1–2 M (Mason et al. 2010; Tylenda et al. 2011;
Pejcha 2014), links could be made between red novae and merger events (Tylenda et al. 2011), including the more massive (3–10 M) proposed mergers V838 Mon (Bond et al. 2003; Sparks et al. 2008) and M31-LRN- 2015 (Dong et al. 2015;MacLeod et al. 2017;Blagorod- nova et al. 2020). The spectra of these events change dramatically with time, starting with narrow Balmer emission lines on top of a rather featureless blue con- tinuum, and evolving to a cool, dusty, molecular-band- dominated spectrum. Other well-known mergers of even more massive stars include NGC 4490-OT at∼30 M (Smith et al. 2016b; Pastorello et al. 2019a) and the similar transient AT 2017jfs (Pastorello et al. 2019b), M101-2015OT1 at ∼18 M (Blagorodnova et al. 2017;
Goranskij et al. 2016), and SNHunt248 with a mass pos- sibly as large as 60 M(Mauerhan et al. 2018). The light curves of these objects show prominent double or mul- tiple peaks, with more massive progenitors linked with brighter peak magnitudes and a longer duration between peaks (Kochanek et al. 2014; Smith et al. 2016b; Pas- torello et al. 2019a).
Some intermediate-luminosity transients cannot be strictly classified into one of the three groups dis- cussed above. For instance, UGC 2773-OT exhibited [Ca II] and Ca II emission in its spectra, similar to the SN 2008S-like events, but appears to have had a
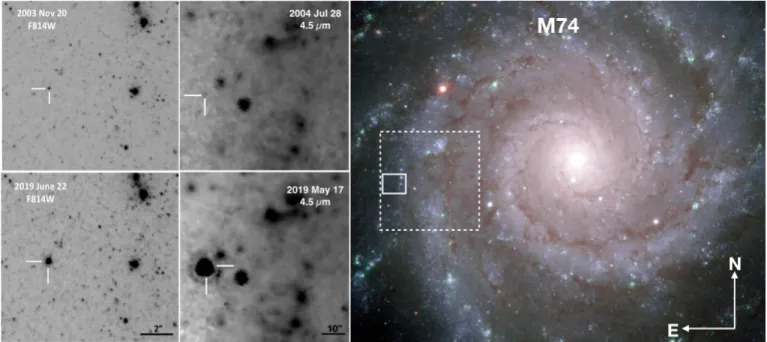
Figure 1. Pre- and post-eruption images of AT 2019krl withHST F814W (two left panels) andSpitzer/IRAC 4.5µm (middle panels). AT 2019krl is indicated by the white tick marks, and the panels have the same orientation with north up, east to the left. The scale of theHST (solid rectangle) andSST (dashed rectangle) images is shown against the Gemini/GMOS color image on the right.
luminous, blue progenitor and a slow rise to peak lu- minosity and a decade-long eruption akin to the Great Eruption ofη Car (Smith et al. 2010,2016a;Foley et al.
2011). Moreover, η Car — the quintessential LBV gi- ant eruption — showed prominent [CaII] emission and molecular absorption in light-echo spectra (Prieto et al.
2014;Smith et al. 2018), plus prodigious dust formation and other features that are also attributed to ILRTs.
Similarly, the optical spectra of SN 2002bu evolved from the appearance of an LBV to that of a SN 2008S type, and observations over a decade after the outburst are still inconclusive about whether the event was terminal (Szczygie l et al. 2012).
Here we present another case of an intermediate- luminosity transient that shows outburst characteris- tics belonging to LBV, SN 2008S-like events, and mas- sive star mergers. In this case, however, a luminous blue progenitor is clearly detected in pre-eruption data.
AT 2019krl (ZTF19abehwhj) was discovered on 2019 July 07 (Ho 2019) by the Zwicky Transient Facility (ZTF; Bellm et al. 2019) in the nearby spiral galaxy M74 (NGC 628). It was later classified as either a Type IIn supernova or an LBV in outburst, based on an opti- cal spectrum taken on 2019 July 8.4 that showed strong, complex Hαemission with a narrow (130 km s−1) and an intermediate (2000 km s−1) width component (Andrews et al. 2019). M74 has been host to the well-studied SNe 2002ap, 2003gd, and 2013ej which have resulted in a
rich dataset of archival imaging in the optical and in- frared. From ground-based imaging using 20 reference Gaia DR2 (Gaia Collaboration et al. 2018) stars we ob- tained an absolute position of AT 2019krl ofα(J2000) = 01h36m49s.633,δ(J2000) = 15◦46046.0032. A subsequent search of the Spitzer Heritage Archive found that the object was detected in archivalSpitzer Space Telescope (SST;Werner et al. 2004;Gehrz et al. 2007) images and appeared as a bright source in the last observational epoch on 2019 May 17, approximately two months prior to the optical discovery (Szalai et al. 2019). Adopt- ing a distance modulus to M74 of µ = 29.95 ± 0.03 (stat.) ±0.07 (syst.) mag (d= 9.77±0.17±0.32 Mpc;
McQuinn et al. 2017, which is consistent with the dis- tance determined byKreckel et al. 2017using the plan- etary nebula luminosity function), the absolute magni- tude of AT 2019krl in the brightest epoch fromSpitzer wasM4.5µm =−18.4. The combination of bright mid- infrared (MIR) emission, low optical brightness, and narrow Balmer emission suggested that AT 2019krl was likely one of the intermediate-luminosity transients dis- cussed above.
We outline the observations and data reduction in Sec- tion2, and discuss the light curve and spectroscopic evo- lution of the progenitor and event in Section3. Section 4discusses the constraints on the progenitor and explo- sion from the data, and Section 5 compares these with
other intermediate-luminosity transient types. We end with concluding remarks in Section6.
2. OBSERVATIONS 2.1. HST Photometry
The site of the transient has been imaged many times before withHST. In addition,HST/ACSF814W obser- vations of M74 obtained on 2019 June 22 (PI: D. Sand) serendipitously imaged AT 2019krl two weeks before the discovery report was issued (Ho 2019). Using this post- outburst observation, we could easily isolate the progen- itor star in pre-outburst archivalHST images.
Pre-transient ACS/WFC data were obtained from programs GO-9796 (PI: J. Miller; 2003 November 20), GO-10402 (PI: R. Chandar; 2005 June 16), and GO- 15645 (PI: D. Sand; 2019 June 22). Several epochs of WFC3/UVIS are available, including from programs GO-13364 (PI: D. Calzetti; 2013 October 17), GO-13773 (PI: R. Chandar; 2014 October 14), GO-14668 (PI:
A. Filippenko; 2016 October 04), and GO-15166 (PI:
A. Filippenko; 2017 December 04). Additionally, an- other post-explosion epoch was taken with WFC3/UVIS on 2019 November 07 (GO-15151; PI: S. Van Dyk). One epoch of WFPC2/WF3 data was also obtained from GO-10402 (PI: R. Chandar; 2005 February 16). The data were all obtained from the Mikulski Archive for Space Telescopes (MAST1) with standard pipeline cali- brations applied. See Table1. In Figure 1we show the transient location in a pre-eruption image from 2003, and one post-eruption image from 2019. We analyzed these data with DOLPHOT2(Dolphin 2000,2016), after using AstroDrizzle (Hack et al. 2012) to produce driz- zled image mosaics and to flag cosmic-ray hits in the in- dividual frames. We used the recommended parameters for DOLPHOT and adopted values for the parameters FitSky=3 andRAper=8 for the photometry. We present theHST photometry on the Vega scale in Table1.
2.2. LBT Photometry
Observations of M74, including the position of AT 2019krl, were obtained as part of the Large Binoc- ular Telescope (LBT) Search for Failed Supernovae (Kochanek et al. 2008). As part of this survey, UBVR images of M74 were obtained between 2008 and 2019 using the Large Binocular Cameras (LBC; Giallongo et al. 2008) on the LBT. The data reduction and im- age processing are described byGerke et al. (2015) and Adams et al. (2017). In summary, the best images are
1https://archive.stsci.edu/
2http://americano.dolphinsim.com/dolphot/
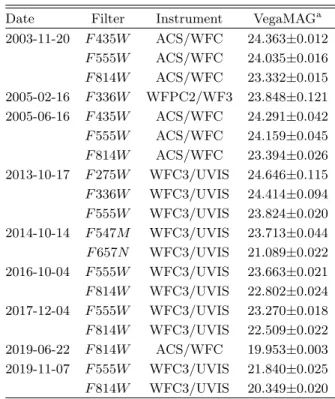
Table 1. HST observations
Date Filter Instrument VegaMAGa
2003-11-20 F435W ACS/WFC 24.363±0.012 F555W ACS/WFC 24.035±0.016 F814W ACS/WFC 23.332±0.015 2005-02-16 F336W WFPC2/WF3 23.848±0.121 2005-06-16 F435W ACS/WFC 24.291±0.042 F555W ACS/WFC 24.159±0.045 F814W ACS/WFC 23.394±0.026 2013-10-17 F275W WFC3/UVIS 24.646±0.115 F336W WFC3/UVIS 24.414±0.094 F555W WFC3/UVIS 23.824±0.020 2014-10-14 F547M WFC3/UVIS 23.713±0.044
F657N WFC3/UVIS 21.089±0.022
2016-10-04 F555W WFC3/UVIS 23.663±0.021 F814W WFC3/UVIS 22.802±0.024 2017-12-04 F555W WFC3/UVIS 23.270±0.018 F814W WFC3/UVIS 22.509±0.022 2019-06-22 F814W ACS/WFC 19.953±0.003 2019-11-07 F555W WFC3/UVIS 21.840±0.025 F814W WFC3/UVIS 20.349±0.020 aDOLPHOT magnitudes obtained from theHST data.
combined to make a reference image, and the individual epochs are analyzed using the ISIS image-subtraction package (Alard & Lupton 1998;Alard 2000). The differ- ence imaging provides a light curve of the variable flux that is unaffected by crowding. The mean flux of the source in the reference image is subject to the effects of crowding and is less well-determined.
The data are calibrated using stars in the Sloan Digi- tal Sky Survey (SDSS;Ahn et al. 2012) and transformed to UBVRC Vega magnitudes using the conversions re- ported by Jordi et al. (2006). These calibrations are accurate to 0.1 mag or better. The uncertainties in the transient light curve are estimated using the variance of light curves extracted from nearby source-free regions, as these empirical uncertainties will include any system- atic contributions to the uncertainties beyond simple Poisson errors. The LBT photometry is listed in Ta- ble2.
2.3. Spitzer Photometry
There have been many observations of M74 in the 3.6 and 4.5 µm imaging channels ([3.6] and [4.5]) of the Infrared Array Camera (IRAC; Fazio et al. 2004) on- board Spitzer since 2004 as part of several observing programs (PID 159, PI: R. Kennicutt; PID 3248, PI: W.
P. Meikle; PID 30494, PI: B. Sugerman; PID 40010, PI:
M. Meixner), including extensive coverage since 2014 by
Figure 2. Optical and infrared light curves of AT 2019krl. UBVR data are from the LBT and other data are fromHST and Spitzer. The light curves have been shifted by the constants indicated for ease of viewing. The left panel shows the light curve of the progenitor, while the right panel focuses on the eruption. The date of our brightestSpitzer epoch is indicated by a vertical dashed line, and upper limits from the Spitzer measurements, stacked in one-year bins, are indicated by downward pointing triangles. The upper limits are similar in the 3.6µm and 4.5µm bands. The data are presented in Tables1,2, and3.
the SPitzer InfraRed Intensive Transients Survey (SPIR- ITS; PIDs 10136, 11063, 13053, 14089; PI: M. Kasliwal) through the end of 2019. Pre-discovery photometry was presented by Szalai et al. (2019) up until the infrared (IR) peak of the transient on 2019 May 17, including the upper limits of the nondetections at 5.8µm and 8.0µm of 5µJy and 15µJy, respectively.
As part of SPIRITS, the post-basic calibrated data (PBCD) level images were downloaded from theSpitzer Heritage Archive3 and Spitzer Early Release Data Service4 and processed through an automated image- subtraction pipeline (for details, see Kasliwal et al.
2017). For reference images, we used the images taken on 2004 July 28 for theSpitzerInfrared Nearby Galaxies Survey (SINGS; Kennicutt et al. 2003). We performed aperture photometry on the difference images using a 4 mosaicked-pixel (2.004) aperture and background annu- lus from 4–12 pixels (2.004–7.002). The extracted flux is multiplied by the aperture corrections of 1.215 for [3.6]
and 1.233 for [4.5] as described in the IRAC Instrument Handbook5. To estimate the photometric uncertainties, we performed photometry with the same parameters as above in a grid of apertures spanning a 3200 box with
3https://sha.ipac.caltech.edu/applications/Spitzer/SHA/
4 http://ssc.spitzer.caltech.edu/warmmission/sus/mlist/
archive/2015/msg007.txt
5 http://irsa.ipac.caltech.edu/data/SPITZER/docs/irac/
iracinstrumenthandbook/
800 spacing centered at the location of the transient, excluding the central aperture. We adopt a robust esti- mate of the root-mean-square (rms) uncertainty in the distribution of flux measurements for the aperture grid (0.5×[85th−16th percentile]) as representative of the 1σuncertainties in our photometry.
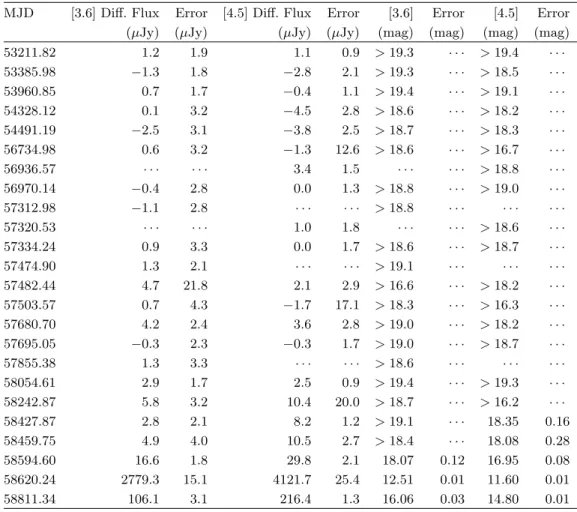
In the 2004 reference images used for subtraction, a possible quiescent counterpart is visible at both [3.6] and [4.5]. Our aperture photometry gives low-significance measurements of Fν,[3.6] = 4.6 ± 4.5 and Fν,[4.5] = 7.1±3.6µJy, consistent with 2005 January 15 measure- ments bySzalai et al.(2019). Given the limited spatial resolution of Spitzer/IRAC and the complicated back- ground emission, it is not possible to rule out that the emission at the site is due to confusion with nearby, unrelated sources. Thus, we infer 3σ limits on the IR flux of the precursor in 2004 of Fν,[3.6] < 14 and Fν,[4.5]<11µJy. We adopt our difference imaging mea- surements throughout the rest of this work with the caveat that they may underestimate the true source flux.
We convert our flux measurements to Vega-system mag- nitudes using the zero-magnitude fluxes presented for each IRAC channel in the IRAC Instrument Handbook and list our photometry in Table3.
2.4. Spectroscopy
Multiple long-slit optical spectra were taken of AT 2019krl with various telescopes/instruments be- tween July and November 2019. These include one epoch with Binospec (Fabricant et al. 2019) on the
Table 2. AT 2019krl LBT photometrya
MJD U B V R
mag mag mag mag
54859 – – 23.58±0.27 22.42±0.06
54862 23.59±0.17 24.16±0.14 23.80±0.18 22.46±0.01 55126 23.64±0.20 24.32±0.06 23.60±0.07 22.44±0.01 55471 23.46±0.08 24.19±0.04 23.65±0.05 22.47±0.01 55536 23.66±0.05 24.30±0.04 23.75±0.04 22.46±0.01 55825 – 24.37±0.12 23.59±0.06 22.39±0.02 55826 – 24.23±0.04 23.59±0.03 22.39±0.02 55882 – 24.22±0.07 23.62±0.06 22.38±0.02 55884 – 24.35±0.08 23.69±0.11 22.40±0.01 55889 – 24.28±0.07 23.56±0.05 22.40±0.02 55924 23.86±0.16 24.19±0.06 23.59±0.03 22.39±0.01
56215 – – 23.44±0.13 22.33±0.07
56301 23.53±0.21 24.35±0.13 23.75±0.07 22.43±0.02
56592 – – 23.51±0.27 22.40±0.03
56661 23.96±0.17 24.07±0.04 23.56±0.05 22.39±0.01 56981 23.78±0.09 24.12±0.03 23.46±0.03 22.37±0.01 56988 – 24.04±0.08 23.36±0.07 22.37±0.01 57071 23.50±0.27 23.99±0.12 23.57±0.14 22.40±0.03 57309 23.65±0.07 24.03±0.06 23.36±0.03 22.31±0.01 57362 23.77±0.16 24.02±0.07 23.34±0.06 22.32±0.02
57391 – – – 22.32±0.03
57690 – – – 22.31±0.02
58014 23.68±0.05 23.78±0.04 23.07±0.03 22.20±0.01 58074 23.36±0.12 23.86±0.04 23.04±0.02 22.21±0.01 58076 23.57±0.16 23.90±0.05 23.10±0.08 22.22±0.02 58127 23.60±0.11 23.77±0.04 23.02±0.03 22.18±0.01 58375 23.50±0.06 23.66±0.02 22.87±0.03 22.04±0.01
58423 – – – 22.11±0.03
58837 22.93±0.10 22.95±0.02 21.59±0.01 20.96±0.01 aMagnitudes are in the Vega system.
6.5 m MMT telescope, one epoch with the Kast dou- ble spectrograph (Miller & Stone 1993) mounted on the Shane 3 m telescope at Lick observatory, one epoch with the Goodman spectrograph (Clemens et al. 2004) on the 4.1 m SOAR telescope, one epoch taken with the DEep Imaging Multi-Object Spectrograph (Faber et al.
2003, DEIMOS) on the 10 m Keck-II telescope at Mau- nakea, and a final epoch with the Multi-Object Double Spectrographs (Pogge et al. 2010, MODS) on the twin 8.4 m LBT at Mount Graham International Observa- tory. These spectra were reduced using standard tech- niques, including bias subtraction, flat fielding, cosmic ray rejection, local sky subtraction, and extraction of one-dimensional spectra. The MMT data were reduced using the Binospec pipeline (Kansky et al. 2019). Most observations had the slit aligned along the parallactic
angle to minimize differential light losses (Filippenko 1982). Flux calibration was done with standard-star observations taken on the same night at similar air- mass.
A pre-outburst spectrum is serendipitously available from observations using the Very Large Telescope/Multi Unit Spectroscopic Explorer (VLT/MUSE) spectro- graph (Bacon et al. 2010) as part of the PHANGS6- MUSE survey (E. Emsellem et al., in prep.). This optical integral field unit provides a 10 ×10 field of view with 0.002 pixels and a typical spectral resolution of∼2.5 ˚A over the nominal wavelength range, covering 4800–9300 ˚A. Observations of M74 (Kreckel et al. 2018,
6Physics at High Angular resolution in Nearby GalaxieS;http:
//www.phangs.org
Table 3.AT 2019krlSpitzer Photometry
MJD [3.6] Diff. Flux Error [4.5] Diff. Flux Error [3.6] Error [4.5] Error (µJy) (µJy) (µJy) (µJy) (mag) (mag) (mag) (mag)
53211.82 1.2 1.9 1.1 0.9 >19.3 · · · >19.4 · · ·
53385.98 −1.3 1.8 −2.8 2.1 >19.3 · · · >18.5 · · ·
53960.85 0.7 1.7 −0.4 1.1 >19.4 · · · >19.1 · · ·
54328.12 0.1 3.2 −4.5 2.8 >18.6 · · · >18.2 · · ·
54491.19 −2.5 3.1 −3.8 2.5 >18.7 · · · >18.3 · · ·
56734.98 0.6 3.2 −1.3 12.6 >18.6 · · · >16.7 · · ·
56936.57 · · · 3.4 1.5 · · · >18.8 · · ·
56970.14 −0.4 2.8 0.0 1.3 >18.8 · · · >19.0 · · ·
57312.98 −1.1 2.8 · · · >18.8 · · · ·
57320.53 · · · 1.0 1.8 · · · >18.6 · · ·
57334.24 0.9 3.3 0.0 1.7 >18.6 · · · >18.7 · · ·
57474.90 1.3 2.1 · · · >19.1 · · · ·
57482.44 4.7 21.8 2.1 2.9 >16.6 · · · >18.2 · · ·
57503.57 0.7 4.3 −1.7 17.1 >18.3 · · · >16.3 · · ·
57680.70 4.2 2.4 3.6 2.8 >19.0 · · · >18.2 · · ·
57695.05 −0.3 2.3 −0.3 1.7 >19.0 · · · >18.7 · · ·
57855.38 1.3 3.3 · · · >18.6 · · · ·
58054.61 2.9 1.7 2.5 0.9 >19.4 · · · >19.3 · · ·
58242.87 5.8 3.2 10.4 20.0 >18.7 · · · >16.2 · · ·
58427.87 2.8 2.1 8.2 1.2 >19.1 · · · 18.35 0.16
58459.75 4.9 4.0 10.5 2.7 >18.4 · · · 18.08 0.28
58594.60 16.6 1.8 29.8 2.1 18.07 0.12 16.95 0.08
58620.24 2779.3 15.1 4121.7 25.4 12.51 0.01 11.60 0.01
58811.34 106.1 3.1 216.4 1.3 16.06 0.03 14.80 0.01
2019) were taken on 2018 November 13 and targeted the source position in three rotations, alternating with two sky pointings, for a total on-source integration time of 50 min. Data reduction is carried out using a pipeline wrapping around the MUSE data reduction pipeline (Weilbacher et al. 2020) and developed by the PHANGS team.7 A log of the spectroscopic observations is given in Table4.
3. ANALYSIS 3.1. Metallicity
Using the adopted distance of 9.77 Mpc (McQuinn et al. 2017), AT 2019krl is located roughly 5.4 kpc from the center of M74. Assuming the oxygen abundance gradient in M74 is 12 + log[O/H]= (8.834±0.069) + (−0.044±0.011)×R dex kpc−1 (Berg et al. 2015) we derive 12 + log[O/H] = 8.59±0.1, a value consistent with the solar oxygen abundance of 8.69±0.05 (Asplund
7https://github.com/emsellem/pymusepipe
et al. 2009). Therefore, we assume the metallicity at the location of AT 2019krl is approximately solar.
3.2. Extinction
The equivalent width (EW) of the Na I D λλ5889, 5896 absorption feature is often used following the pre- scription ofPoznanski et al. (2012) to estimate the ex- tinction of an extragalactic transient, althoughPhillips et al.(2013) have cautioned against using this relation to obtain extinction estimates. Unfortunately, the NaI D lines in AT 2019krl are seen only in emission (Fig- ure3), likely from a contribution from the surrounding circumstellar medium (CSM). For core-collapse SNe the observed color, for example, can be used to estimate the extinction, since the intrinsic colors of such SNe are rel- atively well defined (e.g., Drout et al. 2011; Stritzinger et al. 2018, although see de Jaeger et al. 2018). Since outbursts such as AT 2019krl are not well understood, this is also not a viable option.
However, we can instead attempt to constrain the red- deningE(B−V) of AT 2019krl from the nearby stellar population. Using a technique similar to that outlined
Figure 3. Spectroscopic evolution of the progenitor (gray) and eruption of AT 2019krl. A list of the spectroscopic observations is presented in Table4. The spectra have not been corrected for extinction, but have been smoothed to show prominent emission lines (which are marked with gray dotted lines) more clearly.
by Kreckel et al. (2013), we use penalized pixel-fitting (Cappellari & Emsellem 2004;Cappellari 2017) to deter- mine the linear combination ofBruzual & Charlot(2003) simple stellar population templates that best fits an inte- grated 100 pc wide annular integrated spectrum. This fit requires a third order multiplicative polynomial, which agrees well in shape with aCalzetti et al.(2000) atten- uation law. From this comparison we obtain a value of E(B−V)total= 0.12 mag, after including the Milky Way line-of-sight reddening toward M74 ofE(B−V)MW = 0.062 mag (Schlafly & Finkbeiner 2011). This is only a lower limit, as circumstellar extinction around the tran- sient may be much higher, but likely provides us with a reasonable estimate of total foreground extinction which we will use throughout the rest of the paper.
3.3. Light Curve and Color Evolution
The optical light curves, shifted for ease of viewing, are shown in Figure2, with the photometry listed in Tables 1, 2, and 3. The absolute magnitudes of the progenitor at the first epoch in 2003 are roughlyMF435W =−6.0 mag, MF555W = −6.3 mag, and MF814W =−6.8 mag corrected for E(B −V)total = 0.12 mag. In 2013 the progenitor is somewhat brighter with MF275W =−5.9 mag,MF336W =−6.1 mag, andMF555W =−6.5 mag.
From ourHST photometry taken in 2017, we see that MF555W =−7.0 mag, or almost a magnitude brighter than in 2003, and that between 2017 September and 2018 September it brightens by another 0.1–0.2 mag.
The LBT data, which begin in 2009, show a fairly flat evolution up until late 2017, eliminating any other major eruptions in the decade previous.
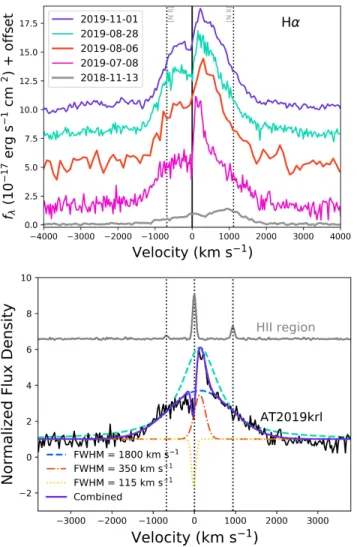
Figure 4. Top: The evolution of the Hαemission line, with zero velocity determined by the centroid of narrow Hαemis- sion from nearby Hiiregions along the slit. The excess in the 2018 pre-eruption spectrum at∼1000 km s−1is due to [NII] λ6584 and is marked by a dashed line. [NII]λ6548 is also marked near −700 km s−1. Bottom: The MMT/Binospec spectrum can be fit using 3 Gaussians: two in emission (narrow and broad), both centered at +135 km s−1 relative to nearby H ii regions, and one in absorption centered at
−20 km s−1. The difference between emission and absorption velocities suggests an outflow of 155 km s−1. An additional Lorentzian (FWHM = 1100 km s−1) is shown for compar- ison (teal dashed line). The poor match to the line profile indicates that electron scattering does not dominate the pro- duction of the broad component. The emission of a nearby HIIregion is also shown to further illustrate the true redshift of the Hαprofile for AT 2019krl.
The 3.6µm magnitudes are also shown in Figure 2.
Only upper limits are obtained for the majority of the early evolution, but similar to the optical data, the 3.6µm and 4.5µm data do not seem to indicate any ma- jor outbursts between 2004 and 2018. There is a notice- able increase from 2018 December to 2019 April as the
Figure 5. Color evolution of the progenitor and outburst of AT 2019krl. As in other figures the date of our brightest Spitzer epoch is indicated by a vertical dashed line and all data have been corrected forE(B−V) = 0.12 mag.
4.5µm luminosity increases from −11.9 to −13.0 mag.
Finally, on 2019 May 17 we obtain our highest luminosi- ties ofM3.6µm=−17.5 mag, andM4.5µm=−18.4 mag.
From these Spitzer data, we can constrain the peak of the outburst to be between 2019 April 21 and May 17.
The peak was not observed in the optical data owing to Sun constraints.
We only obtained a handful of observations after dis- covery. The photometry from the ACS/F814W im- age taken on 2019 June 22 reveals a luminosity of MF814W = −10.2 mag, which then falls to −9.9 mag by 2019 November 07. Similarly, M3.6µm and M4.5µm have dropped to−13.9 and −15.2 mag, respectively, by 2019 November, corresponding to a decrease of roughly 0.02 mag day−1.
As shown in Figure 5, the source steadily becomes redder, with a larger change in the color of the bluer bands. The U −B color evolves from roughly −0.6 to
−0.1 mag, theB−V from 0.4 to 0.8 mag, and theHST V −I color remains fairly flat at∼0.7 mag. After the eruption the HST V −I and B−V colors both jump to roughly 1.4 mag, while U −B gets redder by only 0.1 mag. This indicates that the post-eruption object was much redder than the pre-eruption progenitor. We will discuss how the light curve and color evolution can be used to infer progenitor and explosion properties in Section4 below.
3.4. Spectroscopic Evolution
The spectroscopic evolution of AT 2019krl, including a progenitor spectrum from∼6 months prior to eruption, are shown in Figure3and listed in Table4. To confirm
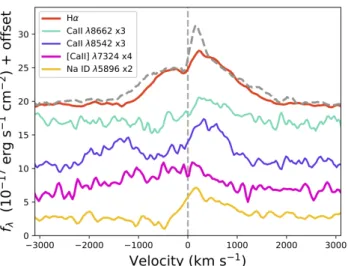
Figure 6. Velocities of prominent emission lines in the 2019 November LBT spectrum. Most lines have been multiplied by a constant. The dashed gray line is the Hαemission from the 2019 July Binospec spectrum, smoothed to match the resolution of MODS.
the rest velocities of the components which appear red- shifted with respect to the zero velocity of the galaxy, we have also plotted the profile of a nearby HIIregion in Figure4. This exercise shows that there is a true ve- locity offset between the HIIregion and the peak of Hα emission, and that we are fully resolving the narrow Hα component in AT 2019krl, which is much broader than the HII region lines.
All spectra exhibit prominent Hα emission, but are otherwise almost featureless. As Figure 4 shows, the Hα emission line in all epochs appears to be multi- peaked, with an absorption feature near −20 km s−1 as measured from our earliest spectrum on 2019 July 08 from the MMT. This spectrum can be reproduced by a combination of a broad Gaussian with full width at half-maximum intensity (FWHM) = 2000 km s−1 and a narrow Gaussian with FWHM = 350 km s−1, both in emission and centered at +135 km s−1, combined with a narrow Gaussian in absorption centered at −20 km s−1 and with FWHM = 115 km s−1. The absorption feature is unresolved, so the model line-width is only an upper limit for the true FWHM of the absorption line. This P Cygni absorption persists over the next few months, and as we show in Figure 6, the absorption minimum and width are almost identical between the July MMT spectrum (dashed gray line) and the November LBT spectrum (red solid line). This indicates that the faster material from the eruption is still expanding into slower- moving CSM.
The strong Ca II NIR triplet, which is not present in the progenitor, as well as Na ID λλ5890, 5896 and very weak [Ca II], are all seen in emission in the post-
Table 4. Optical Spectroscopy of AT 2019krl
Date MJD Telescope R Exp.
+Instrument λ/∆λ (s) 2018-11-13 58435.41 VLT+MUSE 2600 3000 2019-07-08 58672.46 MMT+Binospec 3100 1800 2019-07-09 58673.95 Lick Shane+Kast 770 3600 2019-08-06 58701.35 SOAR+Goodman 1100 1800 2019-08-28 58723.56 Keck+DEIMOS 1875 1200 2019-11-01 58788.19 LBT+MODS 2000 900
eruption spectra. A comparison of the prominent emis- sion lines from our last epoch on 2019 November 01 is shown in Figure 6, where some lines have been multi- plied by a constant indicated in the legend for ease of viewing. While the red side of Ca II NIR and Hα are qualitatively similar, both lack an extended red shoul- der that is seen in the other lines. The absorption in the CaIIlines at−650 km s−1, which is offset by∼800–
900 km s−1from the peak of the line, may indicate mul- tiple locations for the various line emissions. This could be explained with an eruption in a dense, equatorial CSM, where the ejecta could expand much faster at the poles, yet slower in the plane of the disk where the [CaII] emission would arise. A similar trend of faster Hαand Ca II and slower [Ca II] was seen in the post-eruption spectra of UGC 2773-OT which may also have a bipolar nebula (Smith et al. 2016a).
4. RESULTS
4.1. Constraints on the Progenitor
TheHST and LBT data, along with the MUSE spec- trum of the progenitor of AT 2019krl, allow us to thor- oughly investigate the properties of the star that gave rise to this transient. Without a reliable value for the local extinction, our conservative choice ofE(B−V) = 0.12 mag will only provide lower limits to the mass and temperature of the progenitor, but will allow us to rule out certain classes of stars.
In Figure 7 we show the optical spectral energy dis- tributions (SEDs) of the progenitor from photometry in 2005 (HST only), 2013 (HST and LBT), and 2017 (HST and LBT). These epochs were chosen owing to the avail- ability of the ultraviolet (UV) andU-band data, which provide the tightest constraints on the masses and tem- peratures of massive stars. We have attempted to fit the data with ATLAS synthetic spectra of stars of solar metallicity and log(g) = 2.0 (Castelli & Kurucz 2003).
From all three epochs we can immediately rule out a cool progenitor, such as a red supergiant (RSG) or an AGB star, as even the minimum fit temperature of 6500
K is too high for those types of stars. The P Cygni ab- sorption feature seen in the MMT spectrum is offset by
∼ 155 km s−1 from the peak of Hα traces the outflow wind velocity of the star, is also faster than typical RSG winds that have average wind velocities of 10–20 km s−1 (Mauron & Josselin 2011;Goldman et al. 2017;Beasor
& Davies 2018). Moreover, RSGs and AGB stars do not exhibit strong Hαemission.
The 2005 epoch can be best fit by an 11,000 K star with log(L/L) = 4.4, although there is excess emis- sion in theF814W band that cannot be fit with just a single stellar model. In the subsequent two epochs the progenitor appears to cool and become more luminous with time, dropping to Teff = 6500 K with a higher lu- minosity of log(L/L) = 4.6 by 2017. This is, of course, a lower limit, since any additional extinction (host or circumstellar) would raise both the temperature and lu- minosity. For instance, acceptable fits could be made to the 2005 data with a 17,000 K model andE(B−V) = 0.6 mag. Note that we have not attempted to fit theR-band data in 2013 and 2017, as this filter contains the bright Hαemission seen in the progenitor spectrum.
For comparison, yellow supergiants (YSGs) have 7500 K & Teff & 4800 K and log(L/L) > 4.36, with LBVs and blue supergiants (BSGs) exhibiting signifi- cantly warmer temperatures. LBVs in their cool out- burst states typically have temperatures around 6000–
10,000 K. The SED fits therefore indicate that the progenitor star was either a rather hot YSG, a quite cool BSG, or an LBV-like star in a cool phase. The F555W −F814W color evolution (shown in Fig. 5) is too blue for an RSG, and is more consistent with a BSG or YSG.
In Figure8we compare the 2005 and 2013HST data to the MESA Isochrones & Stellar Tracks (Choi et al.
2016; Dotter 2016, MIST8) to help constrain the pro- genitor masses. For each epoch we have determined the best-fit mass for three possible extinction values, with the lowest value of AV = 0.4 mag corresponding to that used throughout this paper. The colors indicate the main sequence (MS, red), supergiant branch (SGB, teal), and helium core burning (HeCB, yellow) phases, and the solid, dotted, and dashed lines show the vari- ous mass tracks. In both 2005 and 2013 we find a lower limit to the progenitor mass of 13.5 M; however, the data with the largest amount of extinction applied yield a progenitor mass of 58 M in 2005 and only 29.5 M in 2013.
8http://waps.cfa.harvard.edu/MIST/
Figure 7. Evolution of the SED of AT 2019krl fromHST (filled symbols) and LBT (open symbols) observations. The data have only been corrected for E(B −V) = 0.12 mag.
For comparison ATLAS synthetic spectra of stars with solar metallicity and log(g) = 2.0 are shown.
To illustrate how the progenitor mass estimate changes depending on the epoch, we show the evolu- tion of the source inMF555W andF555W−F814W in Figure 9. Similar to the SED fits, there is a trend to redder colors with time. This translates to shifts in pro- genitor mass estimates from around 13 M to 15 M, but also a shift in the inferred evolutionary stage from SGB to HeCB. This, of course, is not real evolution, as the change to helium core burning takes significantly more time than a mere 15 yr. Instead, it illustrates how changes in the stellar structure due to instability before an eruption can mimic observed evolutionary changes; values for the inferred mass or luminosity from any single epoch of such a transient should therefore be regarded with caution.
We can also use the stellar population of the lo- cal environment surrounding AT 2019krl to put some constraints on the progenitor. Color-magnitude dia- grams assembled from the 2003 HST data, assuming E(B−V) = 0.12 mag and shown in Figure11, reveal no stars brighter thanMF555W = –4 mag andMF814W
= –6 mag within 50 pc of the progenitor star, and none brighter than MF555W = –5 mag within 100 pc. This nominally suggests a lack of stars more massive than 8 M surrounding AT 2019krl, and that the progenitor of AT 2019krl is overluminous for the age that would be inferred from the surrounding stars. One way to cre- ate this scenario is through a binary rejuvenation in a blue-straggler star (Smith & Tombleson 2015).
Finally, the progenitor spectrum provides clues about the physical state of the star prior to eruption. The
Figure 8. Color-magnitude diagram of the progenitor of AT 2019krl (stars) in 2005 (top) and 2013 (bottom) with varying degrees of extinction applied. The main sequence (MS, red), supergiant branch (SGB, teal), and helium core burning (HeCB, yellow) are highlighted. The best-fit masses corresponding to each extinction value are shown as a solid, dotted, and dashed line, respectively. At no time was the SED as red as an AGB star or RSG.
spectrum is dominated by broad Hαwith wings extend- ing to roughly ± 2000 km s−1 (Fig. 3). Strong [N II] λ6584 emission is present as well, much stronger than the Hα emission. Unlike the narrow emission lines of nearby H II regions that have FWHM at the resolution limit of the spectrum of∼115 km s−1, the [NII]λ5755, λ6584 and [OI]λλ6300, 6363 lines have much broader FWHM as shown in Figure 10 and listed in Table 5.
This may point to emission of N-rich CSM, commonly seen around massive stars, although the excitation of the [NII] emission is uncertain and may be complicated by a mix of shock excitation and photoionization. In par- ticular, shock excitation cannot be ignored as the broad
Figure 9. Same as Figure 8 but illustrating the evolu- tion of the progenitor of AT 2019krl within the F555W − F814W color-magnitude diagram with time, corrected for E(B−V)=0.12 mag.
line width is much faster than typical BSG or cool su- pergiant wind speeds.
The high [N II]/Hα intensity ratio and the width of almost 103km s−1are reminiscent of the Outer Ejecta of η Car (Smith & Morse 2004). In Figure10we show the pre-explosion progenitor spectrum of AT 2019krl com- pared to that of the S Ridge in the outer ejecta ofη Car from Smith & Morse (2004), which has been scaled to the [NII]λ6584 line strength of AT 2019krl. There are striking similarities between the two spectra. In the case ofη Car, the high [NII]/Hαratio arises in very N-rich CSM ejected several hundred years prior to the main eruption, with expansion speeds faster than the bulk outflow in the main eruption or the present-day wind (Kiminki et al. 2016). In these ejecta around η Car, the emission is powered by shock excitation as very fast ejecta overtake the CSM (Smith 2008; Smith & Morse 2004) and these N-rich ejecta are seen alongside a bright soft X-ray shell (Seward et al. 2001). There may also be photoionization from O-type stars in its surroundings, but the central star does not photoionize these ejecta, because they reside outside thick layers of CSM with neutral atomic gas, molecular gas, and dust (Smith &
Morse 2019).
It is plausible that the same mechanisms responsible for the N-rich emission seen in η Car are at play in AT 2019krl, although the data are far less constraining for AT 2019krl. Regardless of excitation and chemical abundance, the strong, broad [NII] emission does point to prior episodes of mass loss with speeds faster than the progenitor’s wind, and that the current eruption is
plowing into material lost in a previous eruption. Any previous eruption would have had to happen prior to 2003 or it would have been detected in our light-curve data. Therefore, we can estimate a lower limit of a ra- dius of the nebula surrounding AT 2019krl to be 1100 km s−1×16 yr, or 5.5×1016cm.
Photoionization may still contribute to the [NII] emis- sion in AT 2019krl, although as we discuss below, the lack of nearby O-type stars combined with the fast [NII] may make this scenario less likely. It is also possible that other lines of ionized N may be present, but are lost in the noise of the spectrum, and the [NII] emission strength may be unrelated to the progenitor star’s tem- perature. The higher-excitation lines seen in the spec- trum ofη Car’s ejecta that clearly require shock excita- tion are below the noise level in our progenitor spectrum of AT 2019krl.
Another class of stars that could possibly show this level of Hα flux are sgB[e] stars, which are easily con- fused with LBVs in quiescence, since they can appear spectroscopically similar, and have similar temperatures and luminosities. The sgB[e] stars generally show [OI] emission (Aret et al. 2016) which is not seen in the post- eruption spectra of AT 2019krl, although it is present in the pre-eruption spectrum with a simlar width to the [N II] lines (Fig. 10). If the [O I] and [N II] emis- sion are due to the B[e] phenomenon, their high veloc- ities (∼ 1000 km s−1) are puzzling, since velocities in sgB[e] stars are generally on the order of 200–300 km s−1, with higher velocities confined to the electron-scattering wings in Hα, if present (Clark et al. 2013; Aret et al.
2016;Torres et al. 2018, for example).
4.2. Post-Eruption Analysis
The light-curve peak was unfortunately missed in the optical. However, we can use the change in magnitude in the Spitzer MIR fluxes to estimate an approximate peak magnitude in the optical light curve bands. The 4.5µm data increased by 6.75 mag between 2018 Novem- ber and the peak in 2019 May. If we assume a similar change in the R-band luminosity from 2018 November, then the peak would beMR=−14.6 mag. If instead we assume that the color difference between R and other bands remains the same at peak outburst as in late 2017, we can estimate the maximum absolute bright- ness ofMF814W =−14.3 mag,MV =−13.8 mag, and MF555W = −13.5 mag on 2019 May 17. This is well within the distribution of peak visual-wavelength abso- lute magnitudes for other SN impostors and/or giant LBV eruptions (Smith et al. 2011).
Comparison of the Hαevolution (Figure3) also shows very little change in the Hα line profile from our first
Figure 10. (Top:) Velocities of prominent emission lines in the 2018 pre-eruption spectrum. Most lines have been multiplied by a constant indicated in the legend and have been smoothed for ease of viewing. (Bottom:) Pre-eruption 2018 MUSE spectrum (orange) compared with the S Ridge in the outer ejecta ofη Car. Theη Car spectrum has been scaled to match the [NII]λ6583 emission.
spectrum,∼60 days after eruption, to the last epoch on
∼180 days. Additionally, the presence of weak [CaII] yet relatively strong CaIIemission may provide some in- sight into the circumstellar environment of AT 2019krl.
We can use the ratio of these lines to estimate the elec- tron densities using the prescription ofHumphreys et al.
(2013). From the 2019 November spectrum we obtain an estimate ofne= 1.1×107cm−3. This of course as- sumes that the emission lines are coming from the same region, which may not be accurate, since the two sets of lines exhibit different temporal evolution and different line profiles. In SN 2008S (Prieto et al. 2008;Smith et al.
2009) and UGC 2773-OT (Smith et al. 2010), these for- bidden emission lines were linked to vaporizing dust in the CSM during the outburst. The same may have oc- curred in AT 2019krl, as dust grains that formed around the progenitor may have evaporated during the sudden luminosity increase of the eruption (Kochanek 2011).
Figure 11. Color-magnitude diagrams of the immediate environment around AT 2019krl from the 2003 HST data, adjusted to the assumed distance and reddening. We have isolated the stars within 50 pc and 100 pc of the transient (see, e.g., Williams et al. 2018;Schady et al. 2019), which is shown with the star symbol (the photometric uncertainties for AT 2019krl are smaller than the symbol). Also shown for comparison are theoretical evolutionary tracks at solar metallicity for single stars at 11 and 8 M from BPASS (Stanway & Eldridge 2018) and 8 Mfrom MIST (Choi et al.
2016;Dotter 2016).
5. DISCUSSION
Even though the optical peak of the outburst was missed because AT 2019krl was behind the Sun, the extensive data on the pre-eruption star provides new and important clues into the progenitor. The observa- tional properties overlap significantly with other tran- sients, and below we discuss how AT 2019krl is like and unlike various transient event classes.
5.1. Comparison to LBV eruptions
While LBVs can experience low-amplitude, irregular, S-Doradus variations, where the peak of the luminosity is thought to shift from the UV to the optical and the star brightens ∼ 1–2 mag, they can also go through a rare form of eruptive mass loss referred to as giant erup- tions. Many of the so-called “SN imposters” have been interpreted as these giant eruptions of LBVs, similar to the historical eruption of P Cygni or the Great Eruption ofηCar (Van Dyk et al. 2000;Smith et al. 2011). During these eruptions the luminosity of the star increases while the temperature usually drops. The eruptive phase of an LBV can last for years, as in the cases ofηCar (Smith &
Frew 2011) and UGC 2773-OT (Smith et al. 2016a, Fig- ure12). Additionally, quiescent or eruptive LBV winds can lie in the 100–600 km s−1 range, similar to the re- solved narrow Hαcomponent seen in AT 2019krl. The overall appearance of the spectrum in AT 2019krl — including the [Ca II] and Ca II lines, along with the comparable Hαprofiles and line strengths, the inferred temperature, the dusty CSM, and the IR excess — are all consistent with known LBV giant eruptions.
In Figure 12 we show the B-band light curve of SN 1954J (Tammann & Sandage 1968), thought to be the eruption of a luminous (MV ≈ −8.0 mag) and mas- sive (>25 M) LBV (Van Dyk et al. 2005). The light curves appear similar, except for the small amplitude variability seen in SN 1954J, which is on a fast enough timescale to have been missed by the cadence of the progenitor data for AT 2019krl. We also show the unfil- tered light curve of UGC 2773-OT in Figure12. Unlike AT 2019krl, UGC 2773-OT had a much more gradual rise to brightness, but both events exhibit a slow de- cline in luminosity post-peak. Estimates for the mass of UGC 2773-OT are∼20 M(or greater if larger extinc- tion is adopted), which is similar to that of AT 2019krl (Smith et al. 2010; Foley et al. 2011), and both have inferred dusty, asymmetric CSM.
Although the masses and luminosities estimated above for AT 2019krl, using the modest extinction of AV = 0.4 mag, are significantly lower than those tradition- ally associated with LBVs (Smith et al. 2011), only an additional 1–1.5 mag of extinction could easily push
Figure 12. Comparison of theRandF814W light curves of AT 2019krl to other transients. The left panel shows the historical light curves of the progenitors, while the right panel focuses on the eruption. All data have been corrected for their respective E(B−V). Data are fromBlagorodnova et al.(2017, M101 OT2015-1),Kankare et al.(2015, SNhunt248),Tammann & Sandage (1968, SN1954J),Botticella et al.(2009, SN 2008S), andSmith et al.(2010,2016a, UGC2773-OT). Note that the UGC2773-OT data are unfiltered.
AT 2019krl’s progenitor to higher masses, as shown in Figure 8. Moreover, recent studies with revised dis- tances have shown that Milky Way LBVs extend to lower initial masses and luminosities than previously thought (Smith et al. 2019). The brightness of the erup- tion and the slow evolution afterward, combined with the color and mass of the progenitor, provide strong ev- idence for the possible LBV-like nature of AT 2019krl.
5.2. Comparison to SN 2008S-Type Events One class of transients with progenitors that are very bright in the IR are the SN 2008S-like events. Well- studied members of this class include the namesake SN 2008S (Prieto et al. 2008; Botticella et al. 2009;
Smith et al. 2009), NGC 300 OT2008-1 (Berger et al.
2009;Bond et al. 2009;Humphreys et al. 2011;Thomp- son et al. 2009;Kochanek et al. 2012), SN 2002bu (Smith et al. 2011; Szczygie l et al. 2012), PTF10fqs (Kasli- wal et al. 2011), AT2017be (Cai et al. 2018), and M51 OT2019-1 (Jencson et al. 2019;Williams et al. 2020).
The SN 2008S-type transients show strong Balmer, CaIINIR triplet, and [CaII] emission in their spectra, with outflow velocities on the order of 500–1000 km s−1, similar to many LBV great eruptions. In Figure 13we show the Hαemission at∼70 days post-peak for a sam- ple of SN 2008S-like events. All exhibit fairly smooth profiles with wings extending to ∼ 1000 km s−1; how- ever, for AT 2019krl the emission line is broader and multipeaked. While AT 2019krl shows strong Hα and the CaIINIR triplet, the [CaII] emission is quite weak
and appears months after peak. This is unlike SN 2008S- like events which have strong, prompt [CaII] emission.
The photometric evolution is also dissimilar between the SN 2008S-type events and AT 2019krl, as shown in Figures 12 and 13. In particular, AT 2019krl is at least 1.5 mag brighter in the 4.5µm band at peak, and while we are unsure of its brightness in the R band at peak, we do know that it fades quite slowly and is brighter than SN 2008S by day 200. Furthermore, the late-time evolution of SN 2008S-type events seems to fade well below the luminosity of the progenitor, partic- ularly in the IR (Adams et al. 2016). This of course is expected for terminal events. We do not currently have the post-eruption observation to tell if this is the case for AT 2019krl, so continued observations are needed.
This class of transients has been associated with highly dust-obscured progenitors that only appear in the MIR (Prieto et al. 2008;Thompson et al. 2009), and often show signatures of dust in the months following eruption, either surviving or newly formed (Prieto et al.
2009). Of course, if the dusty CSM has a nonspherical geometry, then the amount of dust obscuration for the progenitor may vary widely depending on viewing angle (Smith et al. 2009, 2011; Soker 2020). An asymmet- ric CSM around NGC 300-OT was proposed based on optical spectropolarimetry (Patat et al. 2010) and NIR spectroscopy (Ohsawa et al. 2010). If the same is true for AT 2019krl, and the dust is confined to a torus around the progenitor star which we happen to view pole-on, it could appear bright in both the optical and IR.
Figure 13. Left: Spitzer4.5µm light curves of the progenitors and eruptions of AT 2019krl, M51OT (Jencson et al. 2019), and SN 2008S (Prieto et al. 2008). For SN 2008S we are using the distance derived to NGC 6946 inAnand et al.(2018) of 7.72 Mpc. Right: Hαemission line profiles of SN 2008S type events at around 60–70 days. The AT 2019krl spectrum is from 2019 July 08, the AT 2017be spectrum is unpublished from MMT/Bluechannel taken on 2017 March 08, M51OT is from 2019 March 07 (Jencson et al. 2019), SN 2008S is from 2008 April 25 (Botticella et al. 2009), and SN 2002bu from 2002 June 08 (Smith et al. 2011).
In Figure14we compare the optical and MIR SEDs for the progenitor of AT 2019krl to the progenitor of SN 20008S and NGC 300-OT. The detection of the optical component only yielded upper limits for SN 2008S and NGC 300-OT, while in every epoch of the AT 2019krl progenitor, we have significant detections.
The much closer NGC 300-OT had clear progenitor de- tections in all of the IRAC bands, while SN 2008S and AT 2019krl had only an upper limit estimated from the 3.6µm images. The 2018Spitzerdata for AT 2019krl are from the post-cryogenic mission only, so there is no way to determine the brightness in the 5.8µm and 8.0µm bands, but we have attempted to fit an MIR compo- nent with a blackbody temperature of 400 K, between the two temperature values of SN 2008S (Prieto et al.
2008; Thompson et al. 2009, 440K) and NGC 300-OT (Berger et al. 2009, 338K). As we mention above, upper limits were measured for 5.8µm and 8.0µm during the cryogenic mission, but the increase in the MIR luminos- ity of AT 2019krl by 2018 suggests that it would have been detected in these longer wavelength bands.
NGC 300-OT was also detected in the 24µm MIPS band, while only an upper limit could be derived for SN 2008S. It is more ambiguous in the case of AT 2019krl, since a detection was made at the location of the progenitor in the MIPS 24µm data in 2005, but the mitigating factors of pixel size and the distance of M74 make it difficult to determine if the flux originates from the transient, as opposed to distant surrounding material associated with star formation. If the 24µm flux comes from AT 2019krl, then it suggests a second
Table 5. Progenitor spectrum emission line properties
Line EW Flux FWHM FWHM
˚A ˚A 10−17 erg s−1 cm2 ˚A km s−1
5755 28±9 2.0±0.3 19±3 970±50
6300 72±10 4.6±0.3 15±1 770±50 6548 194±20 14.2±0.8 25±1 1180±100
6563 46±13 3.4±0.7 8±1 350±30
6584 397±35 29.0±1.0 22±1 1000±100
region of cooler dust much further out than the warmer dust mapped by the 3.6µm and 4.5µm fluxes. Given the uncertain origin of the 24µm flux and the fact that IRAC data at other MIR wavelengths gave only upper limits, we cannot provide good constraints on a unique fit for this cool component.
After the discovery of SN 2008S and NGC 300-OT, Thompson et al.(2009) suggested that they constitute a new class of transients that may be caused by ecSNe, an explanation also suggested byBotticella et al.(2009).
The explosion of a super-AGB (sAGB) star as an ecSN has an expected kinetic energy of∼1050 erg, and pro- genitors are thought to be in the initial mass range 8–10 M. The exact mass range is still debated, and may be very narrow (Doherty et al. 2015). The progenitor photometry for AT 2019krl points to the equivalent of a single star initially more massive than 13 M. Even with no extinction correction, it was much hotter and likely less dust-enshrouded than an sAGB star. This clearly rules out an ecSN from a sAGB star for the case
of AT 2019krl. Additionally, sAGB stars pulsate with large variability (>1 mag) in their light curves, particu- larly in the IR (Thompson et al. 2009). These variations are not seen in the progenitor of AT 2019krl (Figure13), at least to brightness levels that would be above the de- tection limit of the availableSpitzer observations.
Plausible alternative progenitor scenarios to this class of events are the outburst of a heavily obscured LBV (Smith et al. 2009, 2011), or other dust enshrouded massive star in a binary system (Berger et al. 2009;
Bond et al. 2009; Smith et al. 2011). SN 2008S had an estimated total extinction of AV = 2.5 mag at peak (Prieto et al. 2008) and M51-OT a total reddening 0.7< E(B−V)[mag]<0.9 (Jencson et al. 2019), which for RV = 3.1 translates to 2.2< AV <2.8 mag. If we assume a total AV = 2.5 mag for AT 2019krl, then the best fit implies a stellar mass as high as 58 M from the 2005HST data, or 29.5 Mfrom the 2013HST data, as we show in Figure 89. Even with lower amounts of ex- tinction, 1.5< AV <2.0 mag, AT 2019krl would have a value safely within the expected masses of LBVs (Smith et al. 2004,2019).
5.3. Comparison to Mergers
Often referred to as red novae or LRNe, low-mass or intermediate-mass merger candidates can span a wide range of peak magnitudes and progenitor masses, yet may show a similar set of observational signatures (Kochanek et al. 2014;Pastorello et al. 2019a). Merger candidates typically exhibit an initial peak in their op- tical light curve, followed by a secondary peak at some later date. Early-time spectra exhibit a blue continuum with narrow (100–300 km s−1) Balmer emission which fades with time as the spectra redden and cool, until finally molecular absorption lines appear and dominate the spectra a few months after maximum brightness.
In Figure12we compare the light curve of AT 2019krl to those of the massive star merger candidates M101-OT (Blagorodnova et al. 2017) and SNHunt248 (Kankare et al. 2015; Mauerhan et al. 2015, 2018). It is still unclear what mechanism is responsible for the multi- ple light-curve peaks; however, options include a com- mon envelope (CE) ejection for the first peak and a sec-
9Please note that these mass estimates are made with respect to evolutionary models of single stars that do not include eruptive events and should be interpreted with caution. We therefore do not expect that these accurately reflect the true initial mass of AT 2019krl or its actual evolutionary state, and it should not be surprising that observations at different epochs during an erup- tion may yield different mass estimates. These are only meant to illustrate the equivalent mass of a single star that might have the same luminosity.
ond peak created during the final binary merger, or the first peak being caused by the adiabatic cooling of a CE event, while the second is from CSM interaction with the mass loss during inspiral (Metzger & Pejcha 2017). In the second scenario, viewing angle can easily change the observational signatures of the mergers. Soker (2020) estimates an up to 2 mag difference in brightness be- tween equatorial observers and those viewing from the polar direction.
It is possible that AT 2019krl had a double-peaked light curve missed by our sparse post-eruption obser- vations. If so, the overall shape of the light curve fits those of merger candidates, with an absolute luminos- ity of the progenitor and the outburst being consistent with the class. In particular, the color and temperature of AT 2019krl is quite similar to that of M101 OT2015-1, which was likely a YSG with Teff = 7000 K (Blagorod- nova et al. 2017). The progenitor mass and luminosity was quite a bit higher (18 Mand log(L/L) = 4.9) for the M101 transient, but by adopting a moderately larger extinction, AT 2019krl could have a similar mass (Fig- ure8). Of course, additional luminosity may come from the inspiral itself; therefore, the mass of the progeni- tor would be overestimated. The outflow speed implied from the P Cygni absorption of 155 km s−1 in the Hα emission is consistent with mass-loss speeds from the outer Lagrange point in stellar mergers (Pejcha et al.
2016), and is similar to the 150–200 km s−1P Cygni ab- sorption seen in the light echoes of η Carinae, which has been attributed to an outflow caused by the inspiral phase before a merger (Smith et al. 2018).
One glaring discrepancy between AT 2019krl and merger candidates arises in the spectroscopic evolution.
The Hα emission is present and strong at all times in AT 2019krl, while in merger candidates it often fades after peak and may reemerge at late times. LRNe also lack the CaII NIR and [Ca II] emission that we see in AT 2019krl. Most notably, the molecular bands that form in merger spectra after ∼ 100 days are not seen in AT 2019krl. The lack of molecular lines is not un- expected, as our last photometric observation in 2019 December shows a transient with a temperature of at least 5250 K, still too warm for the creation of molecu- lar lines.
A complication is that, in principle, mergers can oc- cur across a wide range of initial masses, and mergers in more massive stars might not look the same as lower- mass mergers. Moreover, some individual LBV giant eruptions, including the prototypical case ofηCar, have been proposed as massive-star merger events (Smith et al. 2018), and mergers and mass gainers have been invoked to explain evolutionary considerations for LBVs
Figure 14. SED of the progenitor of AT 2019krl com- pared to the progenitors of SN 2008S (Prieto et al. 2008) and NGC 300-OT (Prieto et al. 2009). The MIR of AT 2019krl has been fit assuming a 400 K blackbody as described in the text. The dashed red line shows the combined blackbody fit to the AT 2019krl data (solid line) that has been reddened withE(B−V) = 1.0 mag.
more generally (Justham et al. 2014;Smith & Tombleson 2015;Aghakhanloo et al. 2017). Therefore, the distinc- tion between LBVs and low-mass merger events, such as V1309 Sco and LRNe, might arise simply from a con- tinuum of different initial masses (Smith et al. 2016b), rather than distinctly different mechanisms.
6. CONCLUSIONS
AT 2019krl clearly had a luminous and blue progeni- tor with no previous outbursts detected in the archival HST and LBT images during the 16 yr before the event.
Observationally, it is consistent with known examples of giant LBV eruptions and SN 2008S-like objects with strong Hα, [Ca II], and CaII NIR triplet emission and an estimated peak absolute magnitude between−13 and
−14, yet it does not match a single class exactly.
The estimated mass of the directly-detected progeni- tor without any local extinction places the star in a mass regime of at least∼13 M. This is a lower limit because a modest increase in the adopted extinction correction could easily move the progenitor to higher masses. Im- portantly, this moderately massive BSG progenitor is detected, despite the fact that the surrounding stellar population seems to indicate an older age and lower turnoff mass of only 8 M.
We propose a scenario wherein AT 2019krl was the eruption of a BSG in a dense disk or toroidal CSM that was observed nearly pole-on. A pole-on view of an ob- ject in a dusty torus is needed to simultaneously account for the presence of a strong IR excess and a seemingly
contradictory lack of line-of-sight extinction. This sce- nario could arise from binary interaction and a high- mass merger that resembled a giant LBV outburst.
Combined with what appears to be a fairly low- extinction environment, AT 2019krl may provide a link between SN 2008S-like transients and those occurring from unobscured progenitors, since similar observational properties of transient events seem to be occurring from very different progenitor types. Deep UV-to-NIR late- time observations with very large ground-based tele- scopes, HST, or JWST will allow us to determine if indeed we have a hot luminous star cloaked in a massive dust shell created during the eruption, and if there is both a terminal and nonterminal eruption scenario that can create a very similar transient event.
We thank the referees for comments that helped us improve this paper, as well as the staffs of the observato- ries where data were obtained. J.E.A. and N.S. receive support from National Science Foundation (NSF) grant AST-1515559. Research by D.J.S. is supported by NSF grants AST-1821967, 182197, 1813708, 1813466, and 1908972, as well as by the Heising-Simons Foundation under grant #2020-1864. Research by S.V. is sup- ported by NSF grant AST-1813176. K.K. gratefully acknowledges funding from the Deutsche Forschungs- gemeinschaft (DFG, German Research Foundation) in the form of an Emmy Noether Research Group (grant number KR4598/2-1). TS is supported by the J´anos Bolyai Research Scholarship of the Hungarian Academy of Sciences, by the New National Excellence Program (UNKP-20-5) of the Ministry of Technology and Inno- vation of Hungary, by the GINOP-2- 3-2-15-2016-00033 project of the National Research, Development and In- novation Office of Hungary (NKFIH) funded by the Eu- ropean Union, and by NKFIH/OTKA FK-134432 grant.
A.V.F.’s group received funding from NASA/HST grants GO-14668, GO-15166, and AR-14295 from the Space Telescope Science Institute (STScI), as well as from the TABASGO Foundation, the Christopher J.
Redlich Fund, and the Miller Institute for Basic Re- search in Science (U.C. Berkeley; A.V.F. is a Miller Senior Fellow). Support for HST program GO-15151 was provided by NASA through a grant from STScI.
Some of the data reported herein were obtained at the MMT Observatory, a joint facility of the University of Arizona and the Smithsonian Institution. Research at Lick Observatory is partially supported by a gener- ous gift from Google. Based in part on observations made with the NASA/ESAHubble Space Telescope, ob- tained from the Mikulski Archive for Space Telescopes (MAST) at STScI. STScI is operated by the Association


![arXiv:2109.07329v1 [astro-ph.SR] 15 Sep 2021](data:image/gif;base64,R0lGODlhAQABAIAAAP///wAAACH5BAEAAAAALAAAAAABAAEAAAICRAEAOw==)