FROM SOCIALIST EQUALITY TO CAPITALIST STRATIFICATION: HOW PEOPLE SEE IT
Felix Riedl1–Max HalleR2
AbstrAct The transition from socialism to capitalism has led to diverging socioeconomic outcomes for the Post-Communist countries of Central and Eastern Europe (CEE). While common social problems of capitalist societies were virtually unknown prior to the collapse of socialism, they have been on the increase since the introduction of comprehensive market-oriented reforms. The objective of our article is to investigate the impact of the rising inequality in income in CEE and the effects of distinct trajectories on the change of individual orientations toward social inequality in Post-Communist East Europe. We present statistical data on structural changes and apply linear and logistic regression on data from the ISSP survey 2009 on the perception of social inequality. Our findings suggest that both individual and structural conditions are relevant for attitudes related to inequality. First, objective inequality itself is not associated with individually perceived income differences. Second, different Post-Communist welfare regimes indicate an effect on such perceptions as well as on the individuals’ assessment of the society they live in. Further, the socioeconomic position affects the attitudes toward a redistribution policy.
Keywords Social inequality, equality, social policy, CEE, Eastern Europe, Post- Communist welfare states, economic transition
1 Felix Riedl, graduate student, University of Graz, Austria (Please direct all correspondence to max.haller@uni-graz.at.
2 Max Haller, Professor of Sociology, University of Graz, Austria; email: max.haller@uni-graz.at Acknowledgements: We would like to thank Philipp Babcicky, Roland Verwiebe and two anonymous reviewers for their helpful comments on earlier versions of this article.
INTRODUCTION
The countries of the macro-region widely known as Central and Eastern Europe (CEE) share a common recent history. For several decades of the former century they were governed as state-socialist regimes and represented the ideological, political and economic antagonist of the Western capitalist world. The economies of the socialist-led states were centrally planned and the institution of private ownership was for the most part absent (Bandelj &
Mahutga, 2010: 2136). Among the achievements of this system were strong industrial development and economic growth (particularly in those countries which were least developed before 1917 and 1945, respectively), an educational upgrading of the whole population, full employment and a comprehensive welfare system (Lane, 1971). The adverse features included a retardation of productivity, a slow-down of the increase in the population’s living standard compared with Western Europe3, and an increasing gap between the population at large and the new ruling class, the Nomenclatura (Djilas, 1957;
Voslenski, 1984). State socialism in East Europe collapsed between 1989 and 1991 and with its abolishment new independent nations emerged on the political map. The newborn states rapidly established democratic institutions as well as an economic system based on private property and free markets. In this process they faced major challenges, having to cope simultaneously with differentiation and polarization within a considerably short time span (Lane, 1992; Mikhalev, 2003; Verwiebe & Wegener, 2000). After a difficult period of transition, however, they are now on a remarkable path of growth and the socio-economic situation and opportunities have been improved considerably.
The reflections that guide the reasoning of this paper are as follows: During the last two decades, the Post-Socialist countries have been transforming toward capitalist market economies and as part of this transformation have also been adapting their systems of social protection. It is evident that the transition process has varied for each country, and thus some of them have achieved a more successful transformation and today are better off economically than others. An important concomitant of this process was that some of these countries have managed to join the European Union and the NATO, while others have formed the Commonwealth of Independent States (CIS) (Aidukaite, 2010: 9). However, there was also another crucial consequence of the transition: Levels of social inequality have been rising dramatically in some of the CEE countries. Starting from these facts, the
3 The GDP of Czechoslovakia, for instance, fell from the level of neighbouring Austria in the late 1940s below that of Greece or Portugal in the 1980s.
goal of our article is to analyze the impact of the transformation process on orientations and perceptions toward social inequality in these countries.
This article makes use of recent data from the module Social Inequality 2009 of the International Social Survey Programme (ISSP), which included twelve East European Post-Socialist countries: Bulgaria, Croatia, Czech Republic, Estonia, Hungary, Latvia, Poland, Russia, Slovakia, Slovenia, Ukraine and East Germany. The next sections present the theoretical framework and the hypotheses. We then describe the ISSP dataset, variables and methods of analysis and present our empirical findings. The final section concludes with a discussion of the results and their implications.
THEORETICAL FRAMEWORK
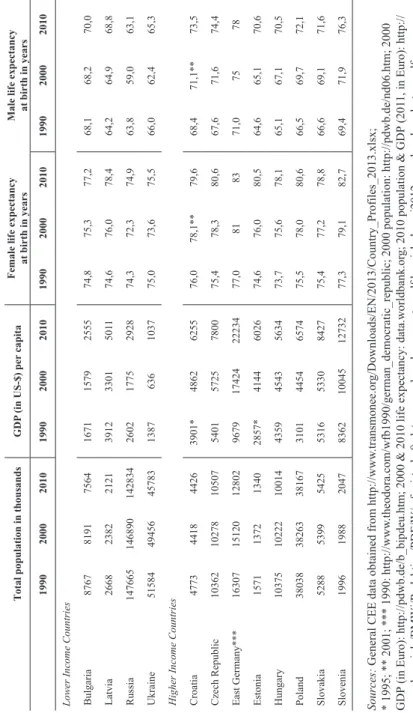
Central and Eastern European countries can be grouped by various socioeconomic features and indicators. For example, one can classify them by their GNP per capita, as demonstrated by Jolanta Aidukaite (2010: 10; see also Haller, 1990). She points out that the majority of the Post-Communist states are characterized through their comparatively low level of income, while a small group of them is better off. Regarding the ISSP-participant countries, Ukraine has a (comparatively) low level of income (or GNP per capita), while Bulgaria, Latvia, and Russia have relatively low incomes;
Croatia, the Czech Republic, Slovakia, Poland and Hungary have a rather high income, and Slovenia and East Germany have a high income. Table 1 provides general socioeconomic data (population figures, GDP per capita, life expectancy in years), distinguishing between CEE countries with lower and higher incomes on the basis of the aforementioned reasoning.
The presented figures correspond by and large to the countries’ geographical position: Countries closer to Western Europe have higher incomes, people live longer and population development is more stable in comparison with countries further to the East. Such a classification clearly shows considerable variation at the macro level. GDP per capita has increased in most countries, but only weakly in Russia while in the Ukraine it has even decreased. Similar figures appear concerning life expectancy which also increased everywhere except Russia and the Ukraine. The differences in this regard between the CEE countries are huge: Male life expectancy was 63,1 years in Russia in 2010, but 76,3 – 13 years more – in Slovenia. However, even East Germany (the former German Democratic Republic), which experienced the strongest increase in GDP per capita due to massive support from Western Germany, does not fare well in one important indicator: The population has dropped massively from
Table 1 General socioeconomic data of the CEE ISSP participant countries Total population in thousandsGDP (in US-$) per capitaFemale life expectancy at birth in yearsMale life expectancy at birth in years 199020002010199020002010199020002010199020002010 Lower Income Countries Bulgaria87678191756416711579255574,875,377,268,168,270,0 Latvia26682382212139123301501174,676,078,464,264,968,8 Russia14766514689014283426021775292874,372,374,963,859,063,1 Ukraine5158449456457831387636103775,073,675,566,062,465,3 Higher Income Countries Croatia4773441844263901*4862625576,078,1**79,668,471,1**73,5 Czech Republic10362102781050754015725780075,478,380,667,671,674,4 East Germany***1630715120128029679174242223477,0818371,07578 Estonia1571137213402857*4144602674,676,080,564,665,170,6 Hungary10375102221001443594543563473,775,678,165,167,170,5 Poland38038382633816731014454657475,578,080,666,569,772,1 Slovakia52885399542553165330842775,477,278,866,669,171,6 Slovenia1996198820478362100451273277,379,182,769,471,976,3 Sources: General CEE data obtained from http://www.transmonee.org/Downloads/EN/2013/Country_Profiles_2013.xlsx; * 1995; ** 2001; *** 1990: http://www.theodora.com/wfb1990/german_democratic_republic; 2000 population: http://pdwb.de/nd06.htm; 2000 GDP (in Euro): http://pdwb.de/b_bipdeu.htm; 2000 & 2010 life expectancy: data.worldbank.org; 2010 population & GDP (2011, in Euro): http:// www.bmwi.de/BMWi/Redaktion/PDF/W/wf-wirtschaftsdaten-neue-laender,property=pdf,bereich=bmwi2012,sprache=de,rwb=true.pdf
16,3 Million to 12,8 Million people due to a reduction in fertility rates and emigration. Our paper addresses the effect of macro structures on the micro level. The general theoretical proposition is specified as follows:
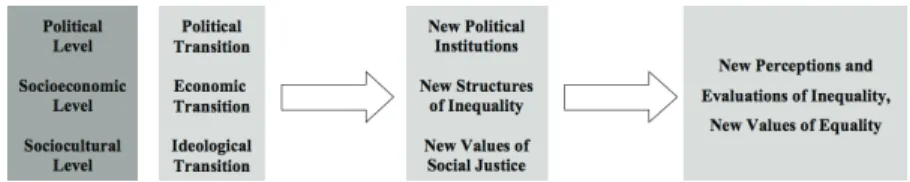
The process of transition from communism to capitalism in the CEE countries has been taking place on a political, a socioeconomic and a sociocultural level. While the political transformation spawned new political institutions, the socioeconomic transition has led to new emerging forms of social inequality and the ideological transition has engendered new values regarding social justice. These developments have affected the orientation of the population toward social inequality.
Figure 1 illustrates the proposition as a three-level and tripartite temporal structure and indicates the causal relationships between each phase.
Figure 1 General theoretical background proposition
In Europe, the period between 1989 and 1991 was characterized by the
“vertiginous decline of communism that culminated in the liberation of Eastern Europe and the break-up of the Soviet Union” (Gros & Steinherr, 2004: 33). Simultaneously, with the gaining of independence of the CEE countries and the establishment of new nations, the road for economic reforms was paved by policy makers in order to launch the transformation toward market economies. An evaluation of the transition process requires an examination of the question whether the following characteristic features of command economies were successfully abolished: 1. A preference for industry, particularly heavy industry, and a neglect of the service sector; 2. a high level of investment rates for physical and human capital; 3. the absence of an extended financial sector which allocates savings to investment as well as the virtual absence of interest rates; and 4. the absence of an institutional and legal framework that characterizes a market economy (Gros & Steinherr, 2004: 117).
In the literature, the transforming CEE countries are basically divided into three categories, i.e. East Germany, CEE countries outside the Former Soviet Union (FSU), and the successor countries of the FSU. East Germany
32 Figure 1: General theoretical background proposition
fully merged with West Germany in a short time span.4 Countries of the second class, most of which are rather small, received much support from the European Union (EU) in order to converge their economies toward the Western market model. The third group of countries suffered from political chaos in the aftermath of communism. Even though each group was facing a different starting point, the common feature of all the countries was the need for a profound transformation and reform program. A successful reform plan had to take into account existing political and economic circumstances;
a plan that could be performed successfully say in Poland or Hungary was not necessarily a useful strategy for the Ukraine or Russia (Gros & Steinherr, 2004: 60-1). Thus the economic reform aims as well as the resulting outcomes varied considerably between the countries. Changing a command economy into a market economy requires price reforms, privatization, financial market reforms, fiscal reforms and changes in the legal framework. Ideally, “all the reforms, or preparations for them, must be launched quickly, even if they take a decade to implement” (Gros & Steinherr, 2004: 105). However, from the beginning the transition was accompanied by a heated debate over the speed and process of economic reforms around the two opposing approaches of “gradualism” and “shock therapy” as modes of transformation (Ivanova, 2007). Supporters of the gradualist approach claimed that economic growth could only be achieved with a full-scale program of an adequately coordinated and sequenced macroeconomic reform. Advocates of shock therapy believed that an instant economic liberalization in an economy without pre-existing markets was a sufficient condition for the immediate emergence of new markets that would meet every demand (Ivanova, 2007:
169). A clearer understanding of the modes of transition can be achieved with the construction of types of transformation, i.e. the characteristic path of socioeconomic development that a CEE country had to take. Three such types can be distinguished: Stable transformation (e.g. Czech Republic, Hungary), unstable transformation (e.g. Bulgaria, Russia), radical transformation and inclusion into a ready-made state (e.g. East Germany) (Verwiebe & Wegener, 2000: 126). In order to meet the new emerging needs of the population, the
4 East Germany’s transformation was entirely piloted by West Germany, and included the adoption of its institutions, political and technical expertise as well as the instant implementation of the encompassing social safety net. Its industrial enterprises were integrated into the world economy overnight (or closed down if highly unprofitable). In this way the basis of competitiveness was destroyed by a dramatic monetary revaluation of 300 % over the course of the monetary union of East and West Germany. 40 % of the previously existing jobs vanished, industrial production dropped, and unemployment increased dramatically (see also Verwiebe
& Wegener, 2000: 132).
phase of economic rebuilding also required adaptations of the social safety net, or to put it another way, the establishment of capitalist welfare states.
In the former Communist countries, problems like poverty or unemployment were considered irrelevant because they were regarded as
“solved”. Nevertheless, social problems were present and they had adverse effects on particular social groups while, on the other side, a Nomenclatura as an upper class with special privileges did exist (Aidukaite, 2010; see also Djilas, 1957; Voslenski, 1984). Social security was organized primarily through employment because everybody was obliged to work. Housing costs, food and transportation were more or less free; social policies encompassed full employment, free education, and free social services and healthcare.
Social security operated as a huge redistributive mechanism that promoted equality between the large social classes and groups. However, after the collapse the shift from a command economy to a market economy challenged its basic pillar, the state’s dedication to full employment. In summary, it was not sustainable under the new economic conditions, which led to a massive social restructuring and a decline in the standards of living for many people. Despite the successful performance of the economy, particularly in the emerging private sector, poverty, income inequality, decreasing real incomes, unemployment and high mortality became manifest social problems (Aidukaite, 2010: 8; Arts & Gijsberts, 1998: 146-7; Verwiebe & Wegener, 2000: 127; see also Adam, 1999). Ivanova (2007) claims that social inequality in many CEE countries increased due to a combination of economic and social policies, which were in favor of the market-led model of transition that ultimately, however, failed to generate a “trickle-down effect” of economic growth (Ivanova, 2007: 197). Others argue that what actually happened in the first few years of transformation was plainly the neglect of social policy, since it was not considered to be an actual priority. Social protection was undertaken with an ad hoc approach, but eventually since the mid-1990s many governments in CEE spawned welfare reforms in order to meet long- term budgetary and socio-demographic challenges (Sengoku, 2004: 232).
Social reforms in CEE during the transition can be summarized as follows:
First, a withdrawal of the state from many activities and services was striven for. Several subsidies and the provision of many public goods and services were either abolished or suspended. Many health-care and social-care services were privatized and activities of voluntary and non-governmental organizations were encouraged by the state. Second, the welfare systems were institutionally pluralized, for example by the separation of social security funds from the state budget, or by the provision of social security by a number of independent institutions. At the same time, the powers and responsibilities
of regional and local governments were extended (Sengoku, 2004: 232-3).
The European Union, the World Bank and the IMF have had a considerable impact on these reforms (Clasen, 2012: 400; Ivanova, 2007: 167, 169).
However, these welfare reforms did not match adequately the emerging new social problems. Even though their overall effects have been positive for the social structure of CEE societies, several large social groups were faced with a significant deterioration of their life circumstances. They included individuals with a low-level of education and members of ethnic minorities (e.g. Roma people) who frequently were excluded from the labour market, as well as retired and aged persons whose pensions did not keep pace with rising prices so that their standard of living deteriorated considerably. On the other hand, there were also “winners” of the transformation, particularly the young and healthy citizens with higher levels of education and social capital.
Furthermore, regional inequality rose dramatically due to the concentration of wealth and better-paid jobs in urban and more western areas. Being a rural inhabitant in CEE literally became a risk of social exclusion during the last two decades (see also Aidukaite, 2010: 16; Bandelj & Mahutga, 2010:
2138-40). Nevertheless, social policy experts agree that despite the problems associated with the reforms, public welfare provision in CEE performs better today than one might expect. Labelling the newly-emerging welfare states merely as “residual” might be inappropriate (Aidukaite, 2010: 20; Sengoku, 2004: 234). Similarly, the assumption that these countries constitute one distinct welfare regime has been challenged (Leibrecht et al., 2011).
The CEE countries differ significantly in socioeconomic terms, and the same holds true for the developing systems of their public welfare provision (Fenger, 2007: 13). Therefore, one could explore whether the countries constitute distinct welfare regimes including qualitatively different arrangements between the state, the market, and the family (Esping-Andersen, 1990). Even though his approach was focused on Western countries, Esping-Andersen’s typology has been used ever since as a core idea for comparative research on the welfare state. It is thus useful to analyze whether the Post-Socialist countries can be assigned to genuine welfare regimes that are distinguishable from each other, as suggested by Fenger (2007). Following this idea, we propose that three different welfare regime types exist in East Central Europe today, including the following countries from our data set:
1. Post-Communist former Soviet states: Russia, the Baltic states (Latvia, Estonia), Ukraine;
2. Post-Communist East European states: Poland, the Czech and the Slovak Republic, Hungary, Slovenia, Croatia, Bulgaria;
3. Post-Communist German state: East Germany (“Neue Bundesländer”).
In general, the reasons for the distinction between the first and second group are that state socialism was in existence for around seventy years in the first group, but only about half a century in the latter. Further, the level of development in the second group was higher. This was also true for the German Democratic Republic, which, in addition, experienced a unique process of transition, as outlined before. Most importantly, however, are the insights from the discussion on the development of these countries as welfare states. Scholars in this field view social policy in CEE as a multidimensional phenomenon that is affected by a variety of specific forces in regard to the socio-economic conditions, characteristics of social security institutions, the impact of globalization and Europeanization, and the composition and impact of political elites (Aidukaite, 2011). In general, four groups of scholars can be identified in this regard: The first group asserted that a common Post-Socialist welfare model does not exist, but that the CEE countries developed toward a liberal welfare state. The second group argues that due to institutional differences and varying social and economic performance comparison with established West European welfare state typologies is problematic. The third group addresses the emerging differences among the new (CEE) member states of the EU in order to develop a modification of existing welfare- state typologies. The fourth group argues that aside from some differences, the CEE countries share considerable historical, institutional, and socio- economic characteristics. Therefore, it is justifiable to speak of distinctive Post-Socialist welfare regimes (Aidukaite, 2011: 216-7). On the basis of a cluster analysis that included indicators of governmental programs (e.g. public expenditure on health, education, the ratio of physicians to inhabitants, levels of individual and corporate taxes, wage level for public servants) and also social situation variables (e.g. GDP growth, life expectancy, unemployment, infant mortality, inflation), Fenger (2007) argues that CEE countries can be grouped into three distinct types of welfare regimes: the Former-USSR type, the Post-Communist European type and the Developing welfare states type.
In comparison of these three types, the Post-Communist European countries have the highest revenues from social contributions, the highest government expenditure for health and the highest spending on social protection as well as the lowest level of inflation (Fenger, 2007: 18-9, 23-5). It is important to point out that our own typology largely corresponds with Fenger’s (2007), but the properties of our research design necessitate a substantial adaptation: We substitute the Developing welfare states type - which consists, for instance, of Moldova and Georgia - with East Germany as a type on its own for the following reasons. First, its situation is exceptional among the CEE countries and second, our data set does not include countries of the developing type.
In the preceding section we discussed the dramatic socioeconomic upheaval in CEE during the last two decades. The new public institutions had to tackle the social problems and challenges in terms of new patterns of social inequality. It can be assumed that social perceptions of the conflicting models of transformation and confusing developments have had a crucial impact on the population’s attitudes toward equality and social justice. Due to the dramatic effects of the transition, the transformation and transition process in CEE has also raised the attention of inequality research (see also Verwiebe &
Wegener, 2000; Örkény & Székelyi, 2000). As a result of diverging structural conditions, the different CEE societies are characterized by different forms of inequality, and also by diverging models and methods for the justification, surveillance, and stabilization of inequality (see also Haller et al., 1995:
259). This is mainly achieved by an ideology of social (in)equality and justice. Such an ideology serves at least three purposes: The legitimation of the privileged position of the better off; the provision of a legitimation for the worse off so that they accept their disadvantaged position and adapt to their living conditions; a critique and delegitimation of the existing order of distribution (Hradil, 2002: 223). The main theoretical strands which address the general phenomenon of the justification or delegitimation of inequality are (neo-)functionalist consensus theory and (neo-)marxist and non-Marxist conflict theory. The first claims that a society needs an accordance of beliefs and values in order to function without problems. Conflict theory, however, assumes that individual interests, perceptions and evaluations vary across society because individuals are situated in different positions within the social structure, which makes a consensus in values and beliefs highly unlikely (see also Verwiebe & Wegener, 2000: 124; Haller et al., 1995: 222-3).
In order to overcome the seemingly theoretical contradictions between these two approaches we assume that two value systems exist in this regard:
Primary values based on culture and secondary values based on the location of individuals in socio-structural positions. Most members of a society share primary values because they are grounded in the common cultural heritage and, we may add, in the dominant political system. These values are passed on in the course of socialization. Secondary values differ from one social class and population group to the next, since different groups hold different social-structural positions and thus have diverging interests, perceptions and value orientations (Verwiebe & Wegener, 2000: 124- 5). Which patterns of inequality ideologies are likely to be found in the beliefs of a contemporary East European society? We may distinguish here three different types of orientations: People’s attitudes can be egalitarian, functionalist, or meritocratic. Egalitarian views advocate substantive equality
and redistribution, whereas functionalists strongly oppose this idea and thus are anti-egalitarian. Functionalists are also characterized by an emphasis on positive effects of social inequality and a belief in achievement as the basis of unequal rewards. The meritocratic position favors a social order that guarantees the appreciation of high quality work, a good education and equality of opportunity (Haller et al., 1995). We assume that meritocracy is of minor relevance in Post-Socialist societies while functionalism - as the dominant ideology of a market-driven capitalist society - and egalitarianism - as the dominant ideology of former communism - are the prevalent ideologies.
HYPOTHESES
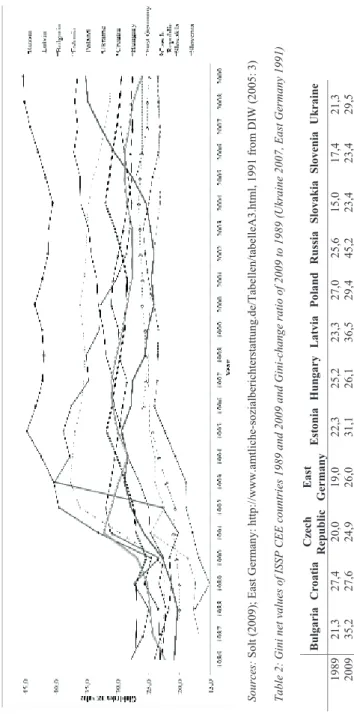
A comparison of Gini coefficients suggests diverging patterns of change of income distribution across the Post-Communist countries. Figure 2 and Table 2 show the progression of Gini-index values for CEE countries between 1986 and 2009. They clearly indicate that income inequality has increased in many of them during this period. Moreover, there is also considerable variation of income inequality between the CEE countries. The trajectories correspond largely to our typology proposed above: The increase of income inequality was modest in most Central East European countries which have been EU member states since 2004 (Croatia, the Czech Republic, Hungary, Poland, Slovakia and Slovenia); it was marked more in Bulgaria and the Post-Soviet countries, irrespective of whether EU member states or not (Latvia, Ukraine, but rather moderate in Estonia). Further, income inequality increased most strongly or, better speaking, exploded, in Russia.
It can be assumed that these strongly-diverging patterns of changes in economic inequality are reflected in subjective perceptions at the individual level. This leads to the first hypothesis:
33
Figure 2: Gini net values of ISSP CEE countries 1986 to 2009 Sources:Solt (2009); East Germany: http://www.amtliche-sozialberichterstattung.de/Tabellen/tabelleA3.html, 1991 from DIW (2005: 3) Table 2: Gini net values of ISSP CEE countries 1989 and 2009 and Gini-change ratio of 2009 to 1989 (Ukraine 2007, East Germany 1991) Sources:See Figure 2 BulgariaCroatiaCzechEast EstoniaHungaryLatviaPolandRussia SlovakiaSloveniaUkraine RepublicGermany 198921,327,420,019,022,325,223,327,025,615,017,421,3 200935,227,624,926,031,126,136,529,445,223,423,429,5 2009/1989 1,561,011,241,371,391,041,571,091,761,561,351,38
HYPOTHESIS 1: The individual perceptions that differences in income are too large will be higher in countries with high and increasing economic inequality and comparatively lower in countries with moderate or low inequality.
The economic transition has led to diverging outcomes for each CEE country.
In the course of these developments, the transforming states also reconstituted their fiscal and administrative systems of public welfare provision, which in turn resulted in distinct types of welfare regimes. The Post-Communist European states have a higher level of public expenditure on health and social protection, a higher level of revenues from social contributions and lower inflation levels than the former Soviet Union countries. The same holds true for East Germany, as it is part of the Federal German Republic that is labelled as a “conservative” welfare state in the literature (Fenger, 2007: 23; see also Esping-Andersen, 1990). In our analysis, we establish East Germany as a distinct type. We assume that the mentioned characteristics of welfare spending and provision are indicative of a welfare state’s ability to redistribute income and target the needs of the population. Accordingly, our second hypothesis reads as follows:
HYPOTHESIS 2: Residents of a country belonging to the type of a Post- Communist former Soviet state will be more likely to discern too large income differences in their countries. By contrast, residents of a Post-Communist East European state as well as East Germans will be less likely to perceive too large income differences.
It is evident that the classification of countries in terms of income inequality and type of welfare regime overlaps to a considerable degree (see also Fenger, 2007). In the empirical analysis we will test the two determinants separately and thus we will, at least in part, be able to distinguish between the two effects.
The socio-structural position of an individual is a determinant for beliefs about a just distribution of income and wealth in a society. Accordingly, an individual’s personal economic situation and self-evaluation of the social position might also affect beliefs about how the state should be involved in redistribution. Verwiebe & Wegener (2000: 145) point out that the causal relevance of the structural position increased together with the extent to which a CEE society has converged to Western European societies. They also argue that the impact of cultural (or primary) values has declined; that is, the “old” equality ideology of socialism has lost ground. Considering the three aforementioned major equality ideologies, we suggest that the special
situation of the transforming CEE societies has led to the prevalence of the ideologies of egalitarianism and functionalism (see also Verwiebe &
Wegener, 2000: 134). This leads to our third hypothesis:
HYPOTHESIS 3: An individual’s idea of the state’s role in redistribution is a function of its own socioeconomic position in a society. People in higher and privileged positions cling to the functionalist ideology, those in lower and deprived positions to the egalitarian ideology.
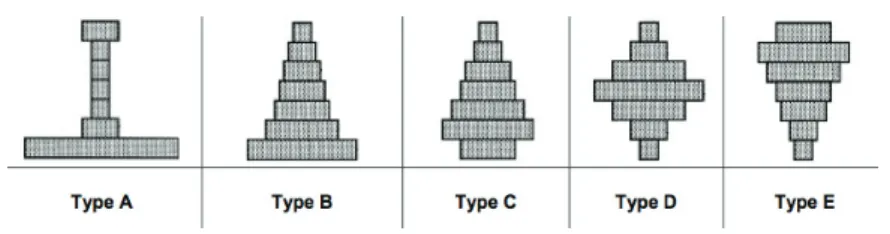
Örkény and Székelyi (2000: 201) suggested ti investigate a population’s perception of the distribution system as a separate dimension in comparative research on social inequality. In our view, the image of a functioning redistribution system is related to the notion of diverging types of society in terms of stratification. In the ISSP survey of 2009, five different stratification systems or types of societies were presented to the respondents (see Figure 5): An elite-mass model, a pyramid model, an alleviated pyramid, a diamond- model or middle-class dominated society, and an inverted alleviated pyramid (a society in which upper middle classes dominate). Respondents were asked two questions in regard to these models: First, what they thought their society actually looked like, and, second, which type of society they would prefer.
We assume that both the existing income distribution and the institutions of social protection and welfare provision – as described in the motivation for our second hypothesis – have an impact on perceptions of the societal stratification system. Thus, the fourth hypothesis is:
HYPOTHESIS 4: An individual’s perception of a particular type of stratified society depends on his/her membership in a particular welfare regime. Thus, people in Post-Soviet countries and people in countries with high economic inequality will see the stratification of their society more as an elite-mass model, but will prefer the inverted pyramid model. People in Central East European countries will perceive their societies mostly as a pyramid, and would prefer a middle-class model.
DATA AND METHODOLOGY
The following analysis is based on the ISSP module Social Inequality from 2009 (ISSP Research Group, 2012). The original sample consists of 53155 respondents from forty-four countries. Our analysis is carried out on the basis of a sample of 14031 individuals from twelve CEE countries. The three main
dependent variables (DV) are the perception of too large income differences, the support of income redistribution by the state, which are both described below, and the view of the societal stratification type, as described before.
The research questions also require additional typologies and data as system features or macro-social indicators (e.g. Gini coefficients and change ratios, welfare-regime types). Our original intention was to conduct multilevel regression. According to the literature, the number of countries in our research design is suitable for multilevel modelling (Hadler, 2004; Snijders
& Bosker, 2011). This method allows for the nesting of data, which means that the number of individuals within a country is taken into account. Further, the effects and standard errors of macro variables (e.g. Gini index, welfare regime) are estimated on the basis of the number of macro units (i.e. the countries) instead of the total sample size. In this way, multilevel regression provides reliable results (Hadler, 2004, 2005). However, the first stage of our multilevel model was computed and the indicators produced fell short of the critical threshold values. The most important indicator in this regard is the intraclass correlation coefficient. It is recommended that its calculation ought to result in a value between 0.10 and 0.25 (Snijders & Bosker, 2011: 18), but the values of our model vary between 0.03 and 0.05. This means that between three and five per cent of the overall variance can be explained by the macro context, which is not sufficient for the proper use of multilevel regression.
The alternative approach is linear regression and the use of binary-coded dummy variables that represent the country units (Hadler, 2004: 54).
In order to test Hypothesis 1 to 3, two major linear regressions were computed with SPSS. A logistic regression was calculated for Hypothesis 4.
The dependent variables (DV), independent variables (IV), control variables (CV) as well as the coding of all included variables are presented in Table 3.
All IV and CV were checked for multicollinearity (see also VIF and tolerance values in the linear regression tables). Each of the regressions is expanded by a second model that considers potential effects of an individual’s membership in a particular Post-Socialist country by means of country-dummy variables.
This additional regression allows identification of the effects of the country level while taking socio-structural control variables into account.
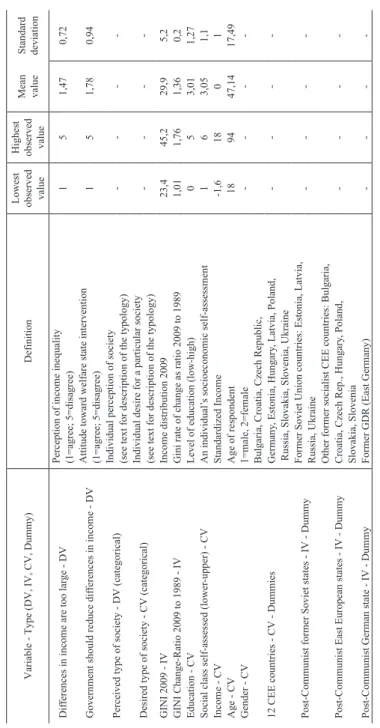
Table 3 Definition and description of the variables in the regression analysis Variable - Type (DV, IV, CV, Dummy)DefinitionLowest observed value Highest observed value
Mean valueStandard deviation Differences in income are too large - DV Perception of income inequality 151,470,72 (1=agree; 5=disagree) Government should reduce differences in income - DVAttitude toward welfare state intervention 151,780,94 (1=agree; 5=disagree) Perceived type of society - DV (categorical)Individual perception of society ---- (see text for description of the typology) Desired type of society - CV (categorical)Individual desire for a particular society ---- (see text for description of the typology) GINI 2009 - IVIncome distribution 200923,445,229,95,2 GINI Change-Ratio 2009 to 1989 - IVGini rate of change as ratio 2009 to 19891,011,761,360,2 Education - CVLevel of education (low-high)053,011,27 Social class self-assessed (lower-upper) - CVAn individual’s socioeconomic self-assessment163,051,1 Income - CVStandardized Income-1,61801 Age - CVAge of respondent189447,1417,49 Gender - CV1=male, 2=female---- 12 CEE countries - CV - DummiesBulgaria, Croatia, Czech Republic, ----Germany, Estonia, Hungary, Latvia, Poland, Russia, Slovakia, Slovenia, Ukraine Post-Communist former Soviet states - IV - DummyFormer Soviet Union countries: Estonia, Latvia, ---- Russia, Ukraine Post-Communist East European states - IV - DummyOther former socialist CEE countries: Bulgaria, ----Croatia, Czech Rep., Hungary, Poland, Slovakia, Slovenia Post-Communist German state - IV - DummyFormer GDR (East Germany)---- Sources: ISSP – Social Inequality 2009; see Figure 2 for Gini data
CORVINUS JOURNAL OF SOCIOLOGY AND SOCIAL POLICY 1 (2014)
EMPIRICAL RESULTS
The foci of our paper are the increase and shape of objective inequality across the CEE countries and their impact on the subjective perceptions of inequality. The ISSP survey provides an item that directly addresses this issue which is formulated as follows: “The differences in income are too large”
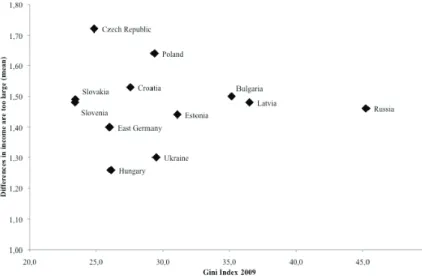
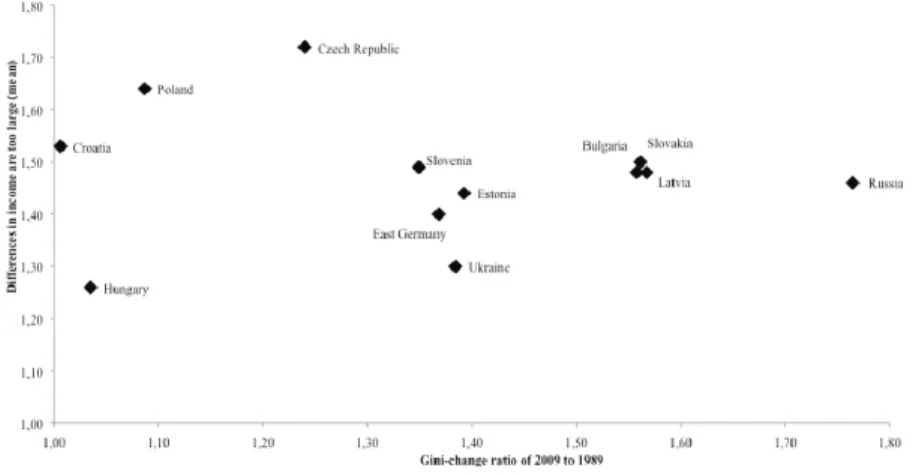
(GESIS, 2008). Respondents can indicate whether they agree or disagree by means of a Likert scale, whereby full consent is coded as 1 and non- consent is coded as 5. Figure 3 depicts the aggregate relationship between the CEE countries’ Gini values of 2009 and the mean values of the individual perceptions of income inequality. Additionally, Figure 4 shows the ratio of the change in income inequality between 1989 and 2009 and the mean values of the inequality perception. Hypothesis 1 claims that the levels of objective inequality are related to the subjective perception of too large differences in income.
Figure 3 CEE Gini-index values 2009 in comparison with mean values of income-inequality perception
Sources: See Figure 2; Mean values of perception from ISSP – Social Inequality 2009 Figure 3: CEE Gini-index values 2009 in comparison with mean values of income-inequality perception
Sources: See Figure 2; Mean values of perception from ISSP – Social Inequality 2009
Figure 4 CEE Gini-change ratio 2009 to 1989 in comparison with mean values of income-inequality perception
At first glance, the scatterplots do not appear to be in favor of Hypothesis 1;
there is no clear pattern that indicates a linear relationship between the level of objective inequality and its subjective perception. Figure 3 shows that the Post- Soviet countries – first of all Russia itself – are the most unequal; the perception of the population, however, is only at an intermediate level. This dimension varies strongly. However, between the more Western countries, Hungary has the lowest mean value while the Czech Republic has the highest. The lower the mean value, the stronger is the perception of large income differences. Maybe this reflects the fact that state socialism was more liberal in Hungary, permitting a considerable proportion of private entrepreneurship (“Goulash Communism”) while the Communists were very strong in former Czechoslovakia in the first elections after World War II5 and established soon a state-socialist system (see also Večerník, 2009). Likewise, Figure 4 does not indicate a linear relationship between the change in economic inequality (1989-2009) and the perception of it. Regression analysis provides us with a clearer message here; its major advantage is the possibility to include several independent and control variables at the same time in one. This makes it possible to avoid an overestimation or underestimation of the key determinants. We assume that attitudes and behavior are influenced also by the socio-structural position of an individual, and hence it is important to consider the respective control variables.
5 The Communists gained 38 % of the votes in the elections of 1946.35
Figure 4: CEE Gini-change ratio 2009 to 1989 in comparison with mean values of income- inequality perception
Sources: See Figure 2 and 3
Figure 5: ISSP Society types
Source: GESIS (2008: 13)
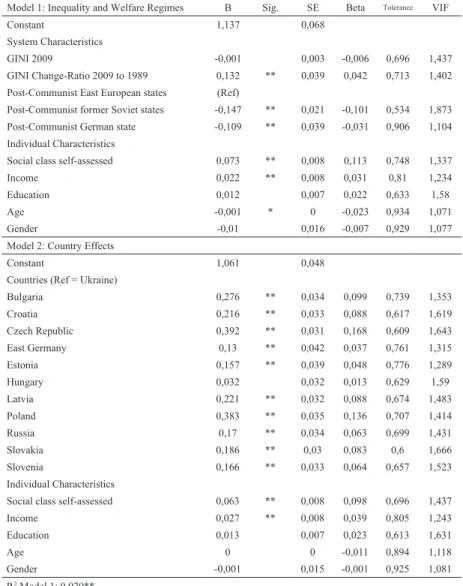
Table 4 Linear regression analysis of the perception of too large income differences
Model 1: Inequality and Welfare Regimes B Sig. SE Beta Tolerance VIF
Constant 1,137 0,068
System Characteristics
GINI 2009 -0,001 0,003 -0,006 0,696 1,437
GINI Change-Ratio 2009 to 1989 0,132 ** 0,039 0,042 0,713 1,402 Post-Communist East European states (Ref)
Post-Communist former Soviet states -0,147 ** 0,021 -0,101 0,534 1,873 Post-Communist German state -0,109 ** 0,039 -0,031 0,906 1,104 Individual Characteristics
Social class self-assessed 0,073 ** 0,008 0,113 0,748 1,337
Income 0,022 ** 0,008 0,031 0,81 1,234
Education 0,012 0,007 0,022 0,633 1,58
Age -0,001 * 0 -0,023 0,934 1,071
Gender -0,01 0,016 -0,007 0,929 1,077
Model 2: Country Effects
Constant 1,061 0,048
Countries (Ref = Ukraine)
Bulgaria 0,276 ** 0,034 0,099 0,739 1,353
Croatia 0,216 ** 0,033 0,088 0,617 1,619
Czech Republic 0,392 ** 0,031 0,168 0,609 1,643
East Germany 0,13 ** 0,042 0,037 0,761 1,315
Estonia 0,157 ** 0,039 0,048 0,776 1,289
Hungary 0,032 0,032 0,013 0,629 1,59
Latvia 0,221 ** 0,032 0,088 0,674 1,483
Poland 0,383 ** 0,035 0,136 0,707 1,414
Russia 0,17 ** 0,034 0,063 0,699 1,431
Slovakia 0,186 ** 0,03 0,083 0,6 1,666
Slovenia 0,166 ** 0,033 0,064 0,657 1,523
Individual Characteristics
Social class self-assessed 0,063 ** 0,008 0,098 0,696 1,437
Income 0,027 ** 0,008 0,039 0,805 1,243
Education 0,013 0,007 0,023 0,613 1,631
Age 0 0 -0,011 0,894 1,118
Gender -0,001 0,015 -0,001 0,925 1,081
R2 Model 1: 0,029**
R2 Model 2: 0,052**
N=8700
Significance: ** p ≤ 0.01 * p ≤ 0.05
Data: See Table 3
According to Table 4, the impact of the level of objective inequality is weak in comparison with an individual’s own class background. Being a member of a higher socioeconomic class (according to one’s own self-assessment) corresponds with a stronger rejection of the belief that inequality is too high, the dependent variable (DV). Also personal income has a significant effect on this belief or perception, albeit its Beta value is at a much lower level. In other words, people who are better off less frequently think that income differences in their country are too large. Interestingly, the impact of the level of income inequality in 2009 is statistically insignificant while the change ratio between 1989 and 2009 is significant and has the third highest Beta value. It indicates, however, a positive correlation with the DV. Thus, the data contradict the assumption of Hypothesis 1: They suggest that individuals from a country with increasing inequality do not tend to have the impression of too large income differences in their country.
The regression model indicates, however, strong support for Hypothesis 2. Controlling for the impact of the individual social position, the effect of membership in one of the CEE welfare regimes is statistically significant and strong (Model 1 in Table 4). The dummies for the Post-Communist former Soviet state and Post-Communist German state are both statistically significant and negatively correlated with the DV, whereas the former has a much higher Beta value than the latter. Individuals who live in a country within those distinct welfare regimes are coded as 1. This means that they indeed tend to share the belief that large differences in income exist in their countries. It also supports Hypothesis 2 by showing that people within the former Soviet Union have a stronger tendency to perceive large differences in income. It can be argued that people within the Post-Communist East European states do not tend to claim that large income differences exist, since they are coded as 0. Therefore, Hypothesis 2 is supported across all CEE countries. Model 2 in Table 4 reveals the country-level effect on the DV. Here we can see that particularly people in the Czech Republic and Poland exhibit the strongest tendency to reject the idea of large income differences in their countries.
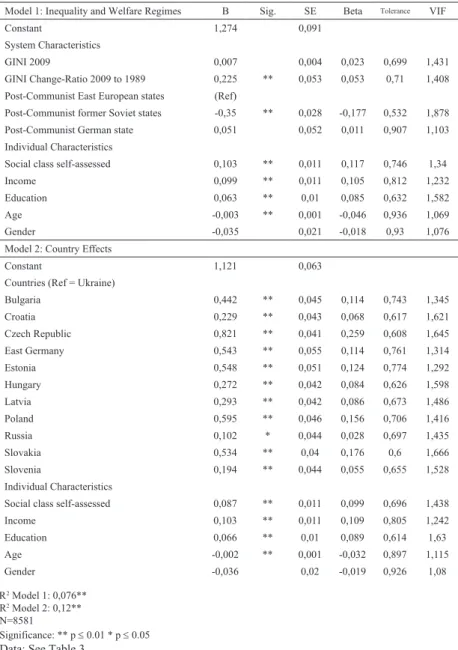
Hypothesis 3 can be tested with the regression model presented in Table 5. The hypothesis claims a strong relationship between an individual’s socioeconomic position and his or her attitude toward redistribution by the welfare state. The DV is formulated in the following way: “It is the responsibility of the government to reduce differences in income”. Here, too, the respondents can state their consent or non-consent on a Likert scale, with full consent coded as 1 and rejection coded as 5.
Table 5: Linear regression analysis of the attitude toward the reduction of income differences
Model 1: Inequality and Welfare Regimes B Sig. SE Beta Tolerance VIF
Constant 1,274 0,091
System Characteristics
GINI 2009 0,007 0,004 0,023 0,699 1,431
GINI Change-Ratio 2009 to 1989 0,225 ** 0,053 0,053 0,71 1,408 Post-Communist East European states (Ref)
Post-Communist former Soviet states -0,35 ** 0,028 -0,177 0,532 1,878
Post-Communist German state 0,051 0,052 0,011 0,907 1,103
Individual Characteristics
Social class self-assessed 0,103 ** 0,011 0,117 0,746 1,34
Income 0,099 ** 0,011 0,105 0,812 1,232
Education 0,063 ** 0,01 0,085 0,632 1,582
Age -0,003 ** 0,001 -0,046 0,936 1,069
Gender -0,035 0,021 -0,018 0,93 1,076
Model 2: Country Effects
Constant 1,121 0,063
Countries (Ref = Ukraine)
Bulgaria 0,442 ** 0,045 0,114 0,743 1,345
Croatia 0,229 ** 0,043 0,068 0,617 1,621
Czech Republic 0,821 ** 0,041 0,259 0,608 1,645
East Germany 0,543 ** 0,055 0,114 0,761 1,314
Estonia 0,548 ** 0,051 0,124 0,774 1,292
Hungary 0,272 ** 0,042 0,084 0,626 1,598
Latvia 0,293 ** 0,042 0,086 0,673 1,486
Poland 0,595 ** 0,046 0,156 0,706 1,416
Russia 0,102 * 0,044 0,028 0,697 1,435
Slovakia 0,534 ** 0,04 0,176 0,6 1,666
Slovenia 0,194 ** 0,044 0,055 0,655 1,528
Individual Characteristics
Social class self-assessed 0,087 ** 0,011 0,099 0,696 1,438
Income 0,103 ** 0,011 0,109 0,805 1,242
Education 0,066 ** 0,01 0,089 0,614 1,63
Age -0,002 ** 0,001 -0,032 0,897 1,115
Gender -0,036 0,02 -0,019 0,926 1,08
R2 Model 1: 0,076**
R2 Model 2: 0,12**
N=8581
Significance: ** p ≤ 0.01 * p ≤ 0.05 Data: See Table 3
Interestingly, the former Soviet states dummy exhibits the highest Beta value and a negative effect on the DV; thus, people within this welfare regime strongly tend to support redistribution policy. However, we are also interested in the effect of individual socioeconomic characteristics on the DV. Here, an individual’s socioeconomic class background turns out to have the highest impact, followed by levels of income and education. All of these IV are positively correlated with the DV, which implies that a higher socioeconomic position corresponds with the rejection of a redistributive policy. Model 2 in Table 5 takes the country effects into account and indicates that the effect of the membership in at least five countries is stronger than that of the individual socioeconomic position – four of them are associated with the Post-Communist East European states (the Czech Republic, Slovakia, Poland, Bulgaria). The positive Beta coefficient suggests that individuals from these countries tend to reject redistribution policy. In general, Hypothesis 3 is supported by the data.
Particularly the first model displays significant effects of the socioeconomic position on the DV. Concerning Hypotheses 1 to 3, each of the regressions suggests that also macro characteristics (that is, objective inequality and the membership in a welfare regime or a particular country) have considerable effects on people’s beliefs and perceptions about social inequality. We must note, however, that our regressions consider only individuals who have their own income. Concerning the two socio-demographic characteristics, gender has no significant impact in any of the regression models while age has a slight impact on and is negatively correlated with both DV. This means that older people tend to perceive larger income differences, and that they are more in favor of redistribution policy. This is plausible in view of the fact that they were socialized during the Communist period and many of them, now in their old age, will have experienced a deterioration in their standards of living.
The ISSP questionnaire includes two items that address typical images of stratified societies. Hypothesis 4 claims that an individual’s self-attribution to a distinct type of stratified society is contingent upon his or her membership in a particular welfare regime. One item asks for the individual perception and assessment of the type of society an individual lives in, another one is about an individual’s desire for a particular type. Figure 5 gives an overview of these images. Their step-like structure suggests a pattern of stratification, going from the bottom to the top, where every step equals a social stratum.
25 FROM SOCIALIST EQUALITY TO CAPITALIST STRATIFICATION: HOW PEOPLE SEE IT
Figure 5 ISSP Society types
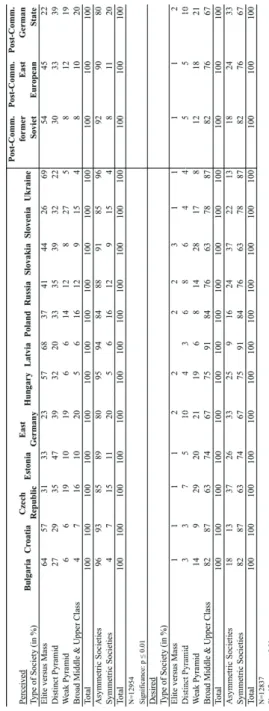
Before testing Hypothesis 4, let us investigate the distribution of relative frequencies across the CEE countries as well as across the three welfare regimes on both items; i.e. the preference and the desire for a particular society type. The cross tabulation in Table 6 lists each type by its most salient features in the upper half, whereas types D and E (see Figure 5) were aggregated to one single type (“broad middle and upper class”). As a next step, we recoded both variables to dichotomous dummies that distinguish between asymmetric (types A, B, C, coded as 0) and symmetric types of stratification (types D, E, coded as 1).
The key significance test (Pearson-Chi-Square) rejects for both items the null hypothesis, which claims that the welfare-regime types and the society types are not associated. This result further supports Hypothesis 4 since it implies a significant relationship between welfare regimes and the perception of the societal pattern of stratification. The right-hand side of Table 6 shows that most individuals in the Post-Communist former Soviet states (54 %) claim to live in a society with “a small elite at the top, very few people in the middle and the great mass of people at the bottom”. A similar pattern is indicated for the Post-Communist East European states (45 %), while a third (33 %) within this welfare regime associate their society with “a pyramid with a small elite at the top, more people in the middle, and most at the bottom”. The relative majority of East Germans are associated with this “distinct pyramid- type” (39 %), and about a fifth of them with the “elite vs. mass-type” (22 %) and the “weak pyramid-type” (19 %). Across all regimes, only a minority selects society types that indicate more equality, including a broader middle and upper class, except East Germans, who refer more often to such types.
Aggregating the society types into a binary coded variable clearly shows the differences between the regimes, with East Germans having the lowest share (80 %) of respondents that consider their society asymmetric. Bulgaria and Ukraine show the highest proportions (96 %) of asymmetric types; also Croatia, Hungary, Latvia and Slovakia have very high shares – each with
35 inequality perception
Sources: See Figure 2 and 3
Figure 5: ISSP Society types
Source: GESIS (2008: 13)
Table 6 Perceived and desired type of society, ISSP CEE countries and welfare regimes, 4-type and 2-type model 38
Table 6: Perceived and desired type of society, ISSP CEE countries and welfare regimes, 4-type and 2-type model Data: See Table 3