1
This manuscript is contextually identical with the following published paper:
Krasznai-K EÁ, Boda P, Borics G, Lukács BA, Várbíró G (2018) Dynamics in the effects of the species-area relationship vs. local environmental factors in bomb crater ponds. Hydrobiologia, 823, pp. 27-38.
The original published PDF available in this website:
https://link.springer.com/article/10.1007%2Fs10750-018-3693-x
Dynamics in the effects of the species-area relationship vs. local environmental factors in bomb crater ponds
Eszter Á. Krasznai-K. 1, 2, Pál Boda 2, 3, G. Borics2, 3, Balázs A. Lukács2, Gábor Várbíró 2, 3
1 Department of Limnology, University of Pannonia, H-8200, Egyetem Str. 10., Veszprém, Hungary
2 MTA Centre for Ecological Research, Danube Research Institute, Department of Tisza River Research, H-4026 Debrecen, Bem Square 18/C, Hungary
3 MTA Centre for Ecological Research, GINOP Sustainable Ecosystems Group, H-8237 Tihany, Klebelsberg Kuno Str. 3., Hungary
Corresponding author: Eszter Á. Krasznai-K.: krasznai. eszter@okologia. mta. hu
Abstract
The species-area relationship (SAR) is a well-investigated subject raising questions nonetheless. We hypothesized that SAR can be modified by naturally extreme conditions (high pH, conductivity and total phosphorus) in a small spatial scale. A bombing range was chosen as a sampling location with a
2
densely scattered cluster of bomb crater ponds, which vary in size and in extremity to study the hypothesis. Macroinvertebrate communities from twenty-five bomb crater ponds were sampled, along with the macrophyte community, while pH, conductivity, total phosphorus and area were also registered. A Decision tree was used to separate extreme from normal ponds based on their chemical characteristics. SAR was found to be the dominant driving force, increasing species richness in the extreme ponds. However, in the normal ponds, the Small Island Effect was observed. The macroinvertebrate communities and macrophyte community types are congruent in normal ponds.
Our findings imply that rules in ecology cannot be handled rigidly and there are dynamics existing between the factors that influence the composition of a macroinvertebrate community that cannot be ignored at habitat restorations.
Keywords: habitat diversity, ponds, macroinvertebrates, naturally extreme environment, species accumulation curves
Introduction
The positive relationship between species richness and area (SAR) is well documented in the literature and it can be considered as a general “law” in ecology (Preston, 1960; Ricklefs & Lovette, 1999). For decades, it has been in the focus of ecological studies and was proven by both paleontological and contemporary patterns of various organisms (Brown & Lomolino, 2000; Lomolino, 2000; it was documented in birds: Coleman et al., 1982; Palmgren, 1930; mammals: Kerr & Packer, 1997 and arthropods: Hill et al., 1995; Hurd & Fagan, 1992). Representing the number of species as a function of area size, the shape of the curve will change in accordance with the spatial scale (Hubbel, 2001;
Rosenzweig, 1995). At very small scales the species richness shows erratic changes referred to as Small Island Effect (SIE) (Lomolino & Weiser, 2001). Over this scale, a steep increase in species
3
richness can be observed. At the largest spatial scales, a considerable increase in species richness can be expected again, with sites included from all over the world (Hubbel, 2001; Shmida & Wilson, 1985).
The above pattern cannot, however, be explained by area alone. In terrestrial environments, the shape of SAR is influenced by, the variances in the intensity of biological factors (Hubbel 2001), regional factors and local environmental variables (e.g. Shmida & Wilson, 1985; Sfenthourakis & Triantis, 2009). Since habitat diversity does also have a significant positive effect on species composition and diversity (Báldi, 2008; Wolters et al., 2017), it is widely questioned if area by itself is capable to shape species diversity or is the increase in species richness an indirect effect through the accumulation of habitat types (see a review by Tews et al., 2004). A more recent study by Scheffer et al. (2006) stated, that the size of the area is only important to provide more space for different habitat types, which then will help to increase the number of species. Drawing an analogy, isolated water bodies (e.g. ponds or lakes) in terrestrial systems can be considered as islands in aquatic form, therefore, SAR also can show various patterns in aquatic environments (Oertli, 2002).
The composition of macroinvertebrate communities can also be severely influenced by extreme values of pH, conductivity or phosphorus. Acidity, caused by human disturbances (Svitok et al., 2014;
Wollmann, 2000) is shown to change species richness of aquatic macroinvertebrate communities (Mulholland et al., 1992; Wollmann, 2000). Also, acidity can increase the toxicity levels of some metals (e.g. Al, Cd, Pb, Zn, Cu, Fe), thus having a direct or indirect effect on macroinvertebrates (Herrmann et al., 1993; Mulholland et al., 1992). At the same time, extreme alkalinity (and the accompanying salinity) does negatively influence species richness directly (Kefford et al., 2006;
Piscart et al., 2005) or indirectly, through the reduction of macrophyte diversity (Vadstrup & Madsen, 1995). In a similar way, conductivity can have a significant effect on macroinvertebrate communities (Kefford, 1998), having either a positive (Heteroptera) (Van De Meutter et al., 2010) or a negative effect (Trichoptera, Ephemeroptera, Mollusca) (Dunlop et al., 2008; Horrigan et al., 2007) on the distribution of taxa. Finally, phosphorus can severely influence the macrophyte vegetation through
4
eutrophication (Bornette & Puijalon, 2011; Gong & Xie, 2001), thus having an indirect effect on macroinvertebrate communities by modifying habitat diversity.
Community composition in a given site is a result of a hierarchy of abiotic and biotic filters that successively determine which species, from an available pool, can persist at a site. Therefore, local communities are adapted to the specific characteristics of their habitat (Boix et al., 2001), and if the extremities of these factors (e.g. pH, conductivity, total phosphorus) establish an extreme habitat, the communities populating this habitat will also show specific patterns in species compositions and abundances (Dunlop et al., 2008; Kefford et al., 2006).
At small spatial scales, the local factors can shape the patterns in species compositions, thus they also might be able to shape the patterns of SAR. Therefore our aim was to investigate how (naturally) extreme values of environmental factors and area influence macroinvertebrate communities. We hypothesized, that naturally extreme conditions influence the communities of ponds and that the effect of extreme local factors will modify that of the species-area relationship in small spatial scale.
Materials and methods
Site selection and sampling
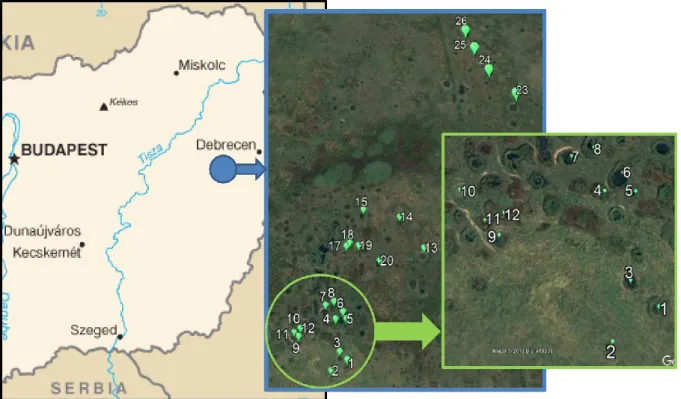
The chosen study area is located in a mosaic landscape in the Hortobágy National Park (East Hungary) in the vicinity of Nagyiván, Hortobágy, Nádudvar and Kunmadaras, between coordinates N47°27'20.69", E20°59'57.14"; N47°27'3.48", E20°59'42.56" and N47°26'34.31", E21°0'2.60". We selected this study area because it was used as a bombing range (air-to-ground bombing practising area) (~70 km2) by the German, Soviet and Hungarian air-forces form the early 1940’s to the late 1990’s, and thus thousands of bomb crater ponds are found here (Figure 1). These ponds vary in size,
5
depth and environmental characteristics, and most of them are filled with water, providing a proper model system for studying SAR. We selected a smaller area where dozens of densely situated ponds can be found (Figure 1).
The vegetation of the area is characterised by alkali grasslands on the highest and wetlands on the lowest elevations. High summer temperatures and enhanced evaporation cause soil alkalinisation and create a mosaic landscape, where spacious homogenous areas are hard to find. Following the water availability and the uneven patterns of soil salt contents, a variety of different habitat types muster a highly mosaic landscape (Molnár & Borhidi, 2003; Török et al., 2012). The mosaic quality of the area was also reflected in the characteristics of the ponds.
Through the dispersal abilities of most aquatic macroinvertebrates (Bilton et al 2001, Csabai et al.
2006) and the proximity of the ponds, the uniformity of the regional species pool was guaranteed. The sampled ponds were chosen to fit into three categories based on their size (1 m2, 10 m2, 100 m2 surface area, called T1, T10 and T100, respectively). The depth of the ponds ranged from 0.2 m to 1.5 m, correlating strongly with their area. The depths of the ponds were thus removed from our calculations not to distort our results.
The sampling was carried out in September (7-9th), 2011, which was a year of temperatures above and precipitation below the means. Temperature during the summer months and September (the month of the samplings) exceeded (+4oC), the expected (~18.9oC) (based on the means of 1971-2000), while precipitation was much lower (~80% during the summer months and only 4% during the ca. 30 days prior to the sampling, regarding the area in question) than the expected (~56 mm), pronouncedly in the area considered (data from the Hungarian Meteorological Service, www.met.hu/en/). Despite the drought, all of the studied ponds were filled with water due to the groundwater inflow, thus we can conclude that the ponds sampled fell into the group of permanent water bodies.
Altogether 25 ponds were sampled, 9 in both the T1 and T10, and 7 in the T100 category. The number of sub-samples was adjusted to fit the size of the pond (2, 4 and 6 sub-samples per T1, T10 and T100 size category, respectively).Sub-samples were divided between the habitat types found. The smallest
6
ponds (T1) permitted one type of habitat only (typically overgrown by macrophytes), here the sub- samples were taken from the open water and disturbing the bed. In the T10 category, sub-samples were taken from the open water, disturbing the bed and disturbing the vegetation grown at the edges, and in the largest ponds (T100), sub-samples were divided between open water, disturbing the bed and the different habitat types around the edges (Figure 2). One sub-sample was made up sampling a 0.125 m2 area with a standard pond net (1µm mesh size). The samples were pre-sorted for fragile specimens in the field, their volumes were reduced and they were immediately fixed in situ, in 70% ethanol.
All the collected specimens were identified to the lowest taxonomic level possible also identifying their developmental stages (larva, pupa, and adult). Larvae of water beetles and damaged specimens were identified to the genus, while Dipterans were identified to the family level. Taxonomic identification was carried out using the appropriate systematic keys and specialised literature on the local fauna: Askew, 1988; Bauernfeind & Humpesch, 2001; Boda et al. 2015, Cham, 2009; Csabai, 2000; Csabai et al., 2002; Eiseler, 2005; Gerken & Sternberg, 1999; Glöer & Meier-Brook, 1998;
Godunko et al., 2004; Grüner, 1966; Haybach, 1999; Karaman & Pinkster, 1977; Koch et al., 1989;
Kontschán, 2001; Kontschán et al., 2002; Niesemann, 1997; Pintér et al., 1979; Savage, 1989; Tachet et al., 2010; Waringer & Graf, 1997.
Measurement of physical and chemical variables
Temperature, electrical conductivity and pH were measured immediately before sampling using a Hach HQ40d Portable Multi-Parameter Meter. Both pH and electrical conductivity values were temperature compensated (20°C). Total phosphorus (TP) was determined by colorimetric method after digestion with H2SO4 (Chapman & Pratt, 1961). Diversity and abundance of macrophytes were used as a proxy of habitat diversity (Theel et al., 2008).
Statistics
7
Redundancy analysis (RDA) was used to explore the relationships between biological and environmental variables. The analysis was carried out based on the relative abundances of the species.
Prior to the calculations, we log-transformed the environmental data matrix. The determination of thresholds for extreme ponds was based on decision tree methods (Breiman et al., 1984), the classification tree was created using the ‘rpart’ classification tree package (Therneau et al., 2017), where the following model was built: rpart (extremity~pH+Total phosphorus(TP) +Conductivity).
Co-correspondence analysis (CoCA) was used to relate the macroinvertebrate and macrophyte communities. The analysis attempts to identify the patterns common to both communities through maximizing the weighted covariance between weighted average species scores of one of the communities and weighted averaged species scores of the other. It is a method widely used to analyse relations between aquatic communities (Backus-Freer & Pyron, 2015; Hanson et al., 2015). For the calculation we used the relative abundances of the species.
Calculations of RDA and CoCA were performed by CANOCO 5. 0 (ter Braak & Šmilauer, 2012;
Šmilauer & Lepš, 2014). Pearson correlation was calculated for the correlation and for linear methods;
for this, we used the ’lm’ method of the ggplot2 package (Wickham, 2011) in R Studio (Studio, R., 2012. RStudio: integrated development environment for R. RStudioInc, Boston, Massachusetts.).
Shannon diversity and dominance index of macrophytes (Warfe & Barmuta, 2004.; Stoner & Lewis, 1985.), were calculated using PAST 3.0 (Hammer et al., 2001).
Results
A total of 5135 individuals from 100 lower (species, genera and families) and 10 higher-level taxa (Heteroptera, Diptera, Coleoptera, Odonata, Gastropoda, Ephemeroptera, Crustacea, Lepidoptera, Megaloptera and Oligochaeta, in the descending order of the individuals found) were found.
Heteroptera were represented in the largest numbers (nearly 2000 individuals of 17 species) and Coleoptera in the greatest diversity (48 species and genera and almost 850 individuals). As a whole, individuals of Heteroptera represented 38.8% of all the aquatic macroinvertebrates caught, followed
8
by Diptera 17.8%, Coleoptera 16.5%, Odonata 10%, Gastropoda 7.7%, Ephemeroptera 7%, Crustacea 1.1%, Lepidoptera 0.7% and Megaloptera and Oligochaeta 0.2%. Regarding the lower taxa, Coleoptera were represented in the largest variety (48% of all species found), followed by Heteroptera (17%), Odonata (12%), Diptera (9%), Gastropoda (7%), Crustacea (2%), Ephemeroptera (2%) and Megaloptera, Oligochaeta and Lepidoptera (1% each). The taxon with the smallest number of individuals (n=10) and species (n=1) was the class of Oligochaeta, individuals of which were present in one of the ponds only.
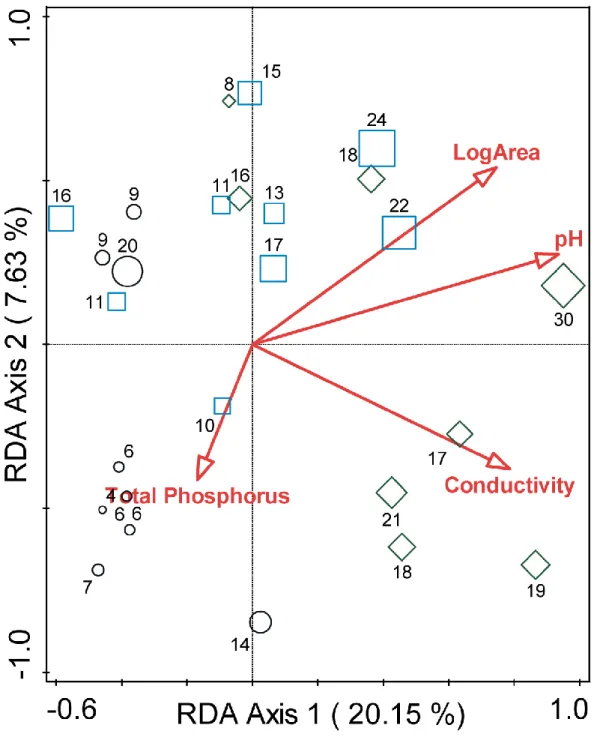
Total variation found with the RDA in species richness was 3452.085 and the investigated variables accounted for 35.2% of this variation. Adjusted explained variation was 22.3% (Table 1). Chemical variables such as pH and conductivity and physical variables like area size had a significant effect on the communities (the effect of the pH was highest with 18.4% of the variation), while total phosphorus had no significant effect on the communities (Table 2). In the analysis, area size, pH and conductivity showed a correlation with the 1. axis (Table 1, Figure 3). In the results of the RDA, a strong detachment could be observed among the sites but not exclusively based on their size. Thus we divided the samples into two groups and then a decision tree analysis was made to clarify which of the environmental factors was responsible for the division of these groups.
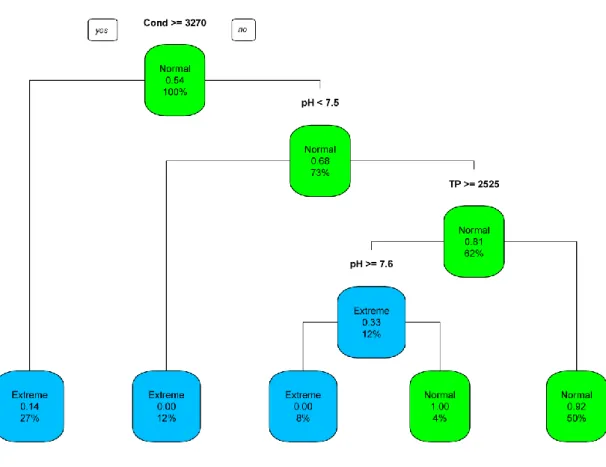
The decision tree was calculated based on the environmental variables. It showed a separation between the ponds and gave the threshold values for this separation. The two groups found this way were named extreme and normal ponds. There were four separation thresholds; the first one was conductivity less or over 3270 μScm-1, the second one was pH over or below 7.5, the third one was total phosphorus less or over 2525μL-1, the fourth separation threshold was again pH over/below 7.6 .
Ponds with a conductivity less than 3270 μScm-1 and pH in the range of 7.5 – 7.6 and the total phosphorus less than 2525 μL-1 were considered as ‘normal’ ponds. While ponds with a conductivity over or equal to 3270 μScm-1 and pH less than 7.5 or over 7.6 and total phosphorus over 2525μL-1 were considered as ‘extreme’ ponds (Figure 4) . It is important to emphasize that extreme conditions
9
resulted from the local microclimate and the mosaic quality of the soil in the area, not from anthropogenic activities.
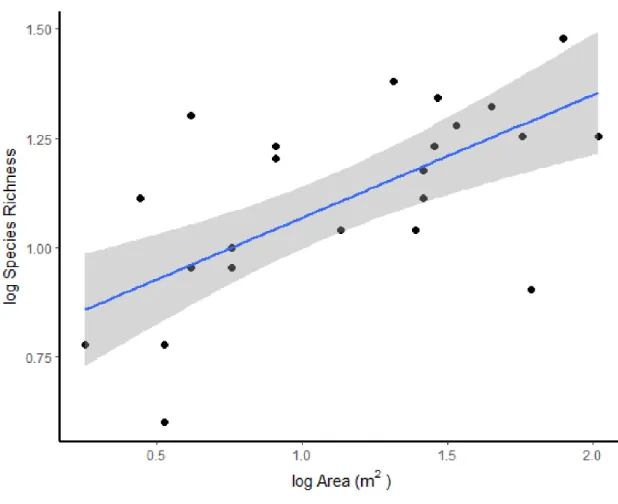
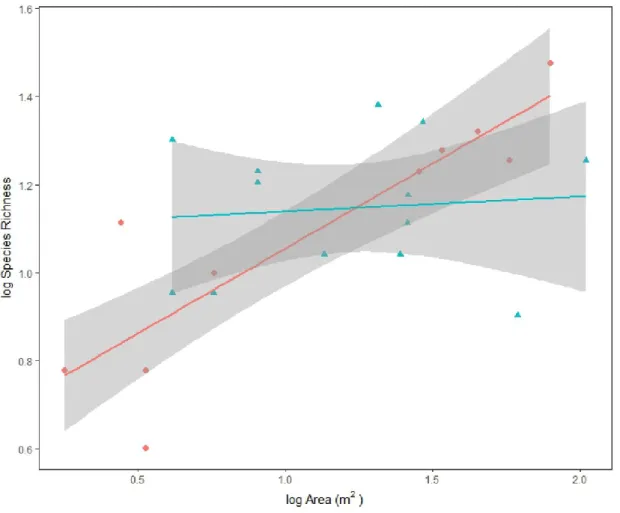
Total species numbers showed a significant positive correlation (R2=0.4392) with the size of the area sampled, when all of the ponds were analysed together (Figure 5). The correlation was tested also by analysing the group of normal and extreme ponds separately (Figure 6). In this case, the number of species grew with the increase of the area in extreme ponds only. Correlation between area size and the number of species was R2=0.3956 in case of the normal ponds (p=0.7) and R2=0.659 in case of the extreme ponds (p=0.0001) (Figure 6). In the Arrhenius equation, the result was y = 1.0916 x Area
0.2488, R² = 0.5132 for all ponds; y = 1.1299 x Area 0.0416, R² = 0.0131 for the normal; and y = 1.0979 x Area 0.2927, R² = 0.6856 for the extreme ponds.
Shannon diversity of macrophytes was slightly higher in normal ponds, but the difference was not significant. The dominance index of macrophytes was higher in the extreme ponds and we found significant difference in two species: the abundance of Lemna minor was significantly higher (F[1,23]=7.6831, p<0.04) in extreme ponds, while in normal ponds, Hydrocharis morsus-ranae was found in significantly higher abundance(F[1,23]= 4.5004, p<0.01).
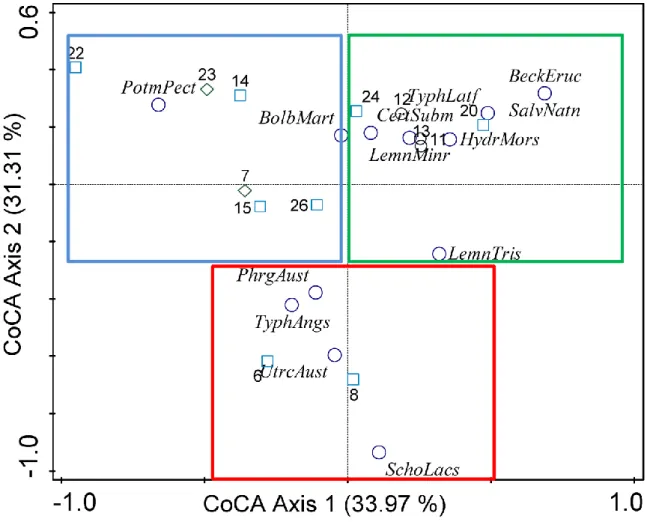
To make sure that there is a similarity between macrophyte and macroinvertebrate communities, Co- correspondences were analysed between the communities. Analysing all ponds together, no significant correspondence was found (first axis: lambda1=0.2471, p=0.51000, all axes: trace=0.9946, p=0.33000) (Appendix: Table 1, 'CoCA' Summary - All ponds). In this case the total variation of the analysis was 0.99458, while the explained variation was 24.84 (Appendix: Table 2, Analysis 'CoCA'- All ponds). When analysing the normal ponds only, Co-correspondence became significant (First axis lambda1=0.2356, p=0.03000, all axis trace=0.6934, p=0.01200) (Appendix: Table 1, 'CoCA' Summary - Extreme ponds removed). Here, the total variation was 0.69338 and the explained variation accounted for 33.97 (Appendix: Table 2, Analysis 'CoCA' - Extreme ponds removed). Analysing only the normal ponds, however, they separated into three groups based on the dominant macrophyte types (a. submerse, e. g. Stuckenia pectinata (L.) Börner; b. emergent, e. g. Typha angustifolia (L.) and
10
Phragmites sp.; c. floating, e. g. Salvinia natans (L.) or Hydrocharis sp.) (Figure 7; Appendix: Table 2, 'CoCA' Summary - Extreme ponds removed).
Discussion
As hypothesized, SAR tended to change according to the different local environments. Our results provide evidence that different patterns are found in the species-area relationship in normal versus naturally extreme ponds, at a small spatial scale.
Most importantly, the positive correlation between the species richness and the area showed a high significance in the case of the extreme ponds only. In this case, species richness increased on a steep gradient with the increase of area, and the correlation between area and species richness was strong.
On the contrary, in the case of the normal ponds, the correlation was weaker, not significant and species richness increased only moderately with the increase in the area (Figure 6). Since habitat diversity was not correlated with area, the increase in species richness in extreme ponds can be explained only by the effect of SAR. In normal ponds, however, the Small Island Effect can be suspected to affect species richness.
Another difference was that a significant and positive linear co-correlation between macrophyte and macroinvertebrate communities could only be found in the case of normal ponds. This relationship could not be found in the case of extreme ponds, and what is more, co-correlations could not be found between the communities, when all ponds were analysed together. This implies that extreme conditions can mask correspondences between the key communities (Appendix, Table 1). Besides the above, in the case of the ponds with non-extreme conditions, macroinvertebrate species could be ordered to the three types of macrophyte communities (submerse, emergent and floating niche) found in the ponds. Macrophyte community types are congruent among Pannonian lake types (Lukács et al.,
11
2015), therefore the correspondence in macroinvertebrate communities could also be congruent. The latter correlation could not be found in the ponds with extreme conditions, however.
Yet another difference was found with regard to the floating macrophytes observed. Hydrocharis morsus-ranae was found in a significantly higher abundance in normal ponds, while in extreme ponds, the abundance of Lemna minor was significantly higher. This can affect macroinvertebrate diversity, since the structural complexity provided by macrophytes, their shape (Warfe & Barmuta, 2006) and surface (Stoner & Lewis, 1985) was found to promote a higher macroinvertebrate taxon number.
According to Warfe & Barmuta, (2004), a more complex macrophyte structure can lead to higher macroinvertebrate diversity and abundance by hindering predators or by reducing velocities – and thus physical disturbances, locally. Since Hydrocharis morsus-ranae usually grows densely, it can, through the effects mentioned above, increase macroinvertebrate abundance. Notwithstanding, a dense layer of Lemna minor can, by shading, decrease or even eliminate the structuring of other macrophytes underneath, and through this, negatively influence macroinvertebrate diversity and abundance. (Parr et al., 2002).
However, these striking differences can easily be overlooked due to the similarities also present in the topic, namely, that there was no significant difference in species richness between normal and extreme ponds, and that the species-area relationship worked in both of the categories, studied either separate or together.
Altogether, it seems reasonable to assume, that in our case, the species-area relationship was not overridden by extremity. On the contrary, even under extreme circumstances, the available space a pond provided was filled up by species adapted to these extremities. Thus, in our case, SAR can be concluded to be the dominant driving force shaping the communities of the extreme ponds, while in the normal ponds, species richness still reflected the effects of SIE.
The increasing interest in the community ecology and conservation biology of ponds (De Meester et al., 2005; Oertli et al., 2009) and the uniqueness of the alkali ponds (registered in the Natura 2000 Network as habitats of community interests) press us to understand the mechanisms shaping their
12
communities. As we found, extreme conditions - as may occur in alkaline ponds - can cause bias in our results and thus they should be taken into account at habitat rehabilitations or re-establishing semi- natural habitats.
Acknowledgements
Thanks are due to Csaba Deák for the identification of multiple taxa. The authors would also like to say thanks to the anonymous Reviewers for the effort they put into improving the manuscript and Joan Mattia for the linguistic help. This work was funded by the GINOP-2.3.2-15-2016-00019, OTKA K104279, PD120775 grants. Balázs András Lukács was supported by the Bolyai János Research Scholarship of the Hungarian Academy of Sciences.
Captions for tables and figures
Figure 1: Location of the bombing area and the sampling sites in Hungary
13
Figure 2: Sampling sites. a. ) pond in the T1 size category, densely covered by macrophytes; b. ) pond in the T10 category with dense vegetation around the edges; c. ) typical soda pond in the T10 category with extremely high conductivity; d. ) pond in the T100 category.
14
Figure 3: Results of the RDA analysis. The size of the symbols and the numbers refers to the species number in the given sample. Legend: circles: T1; squares: T10; diamonds: T100.
Figure 4: Decision tree of the threshold values for normal vs. extreme ponds. Normal ponds are marked with green nodes, while extreme nodes with blue colour. Percentages show the number of classified samples in the nodes.TP: Total phosphorus, Cond : conductivity.
15
Figure 5: The species-area relationship regarding all samples. The linear relation between the log- transformed species richness and the log-transformed area. The shaded area represents the standard error for each observation mean as predicted by the regression line.
16
Figure 6: The species-area relationship regarding normal and extreme samples. The linear relation between the log-transformed species richness and the log-transformed. Red dots and red line: normal ponds (species number= 1.1824x + 13.414; R² = 0.0098); blue triangles and blue line: extreme ponds (species number= 11.204x + 2.4462; R² = 0.8351).The shaded area represents the standard error for each observation mean as predicted by the regression line.
17
Figure 7: Results of the CoCA with the extreme ponds removed based on macroinvertebrate and macrophytes species. The squares indicate the dominant macrophyte types: blue: submerse; green:
floating; red: emergent. (abrreviations: Bolboschoenus maritimus - BolbMart; Beckmannia eruciformis - BeckEruc, Ceratophyllum submersum - CertSubm, Eleocharis palustris - EleoPals, Hydrocharis morsus-ranae - HydrMors, Lemna minor - LemnMinr, Lemna trisulca - LemnTris, Phragmites australis - PhrgAust, Potamogeton pectinatus - PotmPect, Salvinia natans - SalvNatn, Schoenoplectus lacustris SchoLacs, Spirogyra sp - SpirgSp, Typha angustifolia - TyphAngs, Typha latifolia - TyphLatf, Utricularia australis – UtrcAust
18
Table 1: Correlation of macrophyte diversity indices with the first two axes of the RDA analysis.
Statistic Axis 1 Axis 2 Axis 3 Axis 4
Eigenvalues 0.2015 0.0763 0.0456 0.0288
Explained variation (cumulative) 20.15 27.78 32.34 35.23 Pseudo-canonical correlation 0.9612 0.8591 0.7463 0.7929 Explained fitted variation (cumulative) 57.20 78.87 91.82 100.00
Table 2: Results of the RDA analysis, variances explained by the environmental factors.
Simple Term Effects Conditional Term Effects Correlation to Axes
Name Explains % pseudo-F P Explains % pseudo-F P CorE.1 CorE.2
pH 18.4 5.2 0.002 18.4 5.2 0.002 0.8995 0.2362
Conductivity
(μScm-1) 14.5 3.9 0.002 7.1 2.1 0.004 0.7567 -0.3272
Log Area 13.9 3.7 0.002 5.3 1.6 0.03 0.7169 0.4638
19
Phosphorus 5.4 1.3 0.15 4.5 1.4 0.1 -0.1609 -0.3539
Appendix
Appendix - Table 1: Results of the Co-correspondence analysis between macroinvertebrate and macrophyte community , Cross-correlation between CoCA axes and significance testing on the first and all axes. a. all ponds included in the analysis, b. extreme ponds removed from the analysis.
appendix - Table 2: Results of the Co-correspondence analysis between macroinvertebrate and macrophyte community, eigenvalues and explained variation a. all ponds included in the analysis, b.
extreme ponds removed from the analyis.
References
Askew, R. R., 1988. The dragonflies of Europe. Harley books.
Backus-Freer, J. & M. Pyron, 2015. Concordance among fish and macroinvertebrate assemblages in streams of Indiana, USA. Hydrobiologia, 758: 141-150.
Báldi, A., 2008. Habitat heterogeneity overrides the species–area relationship. Journal of Biogeography, 35: 675-681.
Bauernfeind, E. & U. H. Humpesch, 2001. Die Eintagsfliegen Zentraleuropas (Insecta:
Ephemeroptera): Bestimmung und Ökologie. Verlag des Naturhistorischen Museums.
20
Benchimol, M. & C. A. Peres, 2013. Anthropogenic modulators of species–area relationships in Neotropical primates: a continental‐ scale analysis of fragmented forest landscapes. Diversity and Distributions, 19: 1339-1352.
Bilton, D. T., J. R. Freeland, & B. Okamura, 2001. Dispersal in freshwater invertebrates. Annual review of ecology and systematics, 32: 159-181.
Boda, P., T. Bozóki, T. Vásárhelyi, G. Bakonyi & G. Várbíró 2015. Revised and annotated checklist of aquatic and semi-aquatic Heteroptera of Hungary with comments on biodiversity patterns.
ZooKeys, 501: 89-108.
Boix, D., J. Sala & R. Moreno-Amich, 2001. The faunal composition of Espolla pond (NE Iberian peninsula): the neglected biodiversity of temporary waters. Wetlands, 21: 577-592.
Bornette, G. & S. Puijalon, 2011. Response of aquatic plants to abiotic factors: a review. Aquatic Sciences 73: 1–14.
Breiman, L., Friedman, J., Stone, C. J., & Olshen, R. A., 1984. Classification and regression trees.
CRC press.
Brown, J. H. & M. V. Lomolino, 2000. Concluding remarks: historical perspective and the future of island biogeography theory. Global Ecology and Biogeography, 9: 87-92.
Cham, S., 2009. Field guide to the larvae and exuviae of British dragonflies. Vol. 2, Damselflies (Zygoptera). British Dragonfly Society.
Chapman, H. H. & P. C. Pratt, 1961. Methods of Analysis for Soils, Plants and Water Division of Agricultural Science, University of California, Davis, CA, USA.
Coleman, B. D., M. A. Mares, M. R. Willig & Y. H. Hsieh, 1982. Randomness, area, and species richness. Ecology, 63: 1121-1133.
Csabai, Z. 2000. Vízibogarak kishatározója I. (Coleoptera: Haliplidae, Hygrobiidae, Dytiscidae, Noteridae, Gyrinidae). Vízi Természet-& Környezetvédelem, 15. (In Hungarian.)
21
Csabai, Z., P. Boda, B. Bernáth, Gy. Kriska, & G. Horváth, 2006. A ‘polarisation sun‐ dial’dictates the optimal time of day for dispersal by flying aquatic insects. Freshwater Biology, 51: 1341-1350.
Csabai, Z., Z. Gidó & G. Szél, 2002. Vízibogarak kishatározója II. (Coleoptera: Georissidae, Spercheidae, Hydrochidae, Helophoridae, Hydrophilidae). Vízi Természet -& Környezetvédelem, 16.
(In Hungarian.)
De Meester, L., S. Declerck, R. Stoks, G. Louette, F. Van De Meutter, T. De Bie, E. Michels & L.
Brendonck, 2005. Ponds and pools as model systems in conservation biology, ecology and evolutionary biology. Aquatic Conservation: Marine and Freshwater Ecosystems, 15: 715-725.
Dunlop, J. E., N. Horrigan, G. McGregor, B. J. Kefford, S. Choy & R. Prasad, 2008. Effect of spatial variation on salinity tolerance of macroinvertebrates in Eastern Australia and implications for ecosystem protection trigger values. Environmental Pollution, 151: 621-630.
Eiseler, B., 2005. Bestimmungsschlüssel für die Eintagsfliegenlarven der deutschen Mittelgebirge und des Tieflandes. Dinkelscherben, Lauterbornia 53: 1-112.
Gerken, B. & K. Sternberg, 1999. Die Exuvien europaischer Libellen (Insecta, Odonata). Huxaria Druckerei.
Glöer, P. & C. Meier-Brook, 1998. Süßwassermollusken. Ein Bestimmungsschlüssel für die Bundesrepublik Deutschland. Deutscher Jugendbund für Naturbeobachtung, Hamburg.
Godunko, R. J., M. Kłonowska-Olejnik & T. Soldán, 2004. Ecdyonurus rizuni sp. nov.
(Ephemeroptera: Heptageniidae) from the Eastern Carpathians. Museum and Institute of Zoology, Polish Academy of Sciences, Annales Zoologici 54: 519-524.
Gong, Z. & P. Xie, 2001. Impact of eutrophication on biodiversity of the macrozoobenthos community in a Chinese shallow lake. Journal of Freshwater Ecology, 16: 171-178.
Grüner, H. E., 1966. Krebstiere oder Crustacea. V. Isopoda. Die Tierwelt Deutschlands.
22
Hammer, H., D. A. T. A. R. Harper & P. D. Ryan 2001. PAST: Paleontological Statistics software package for education and data analysis. Palaeontologia Electronica, 4.
Hanson, M. A., C. A. Buelt, K. D. Zimmer, B. R. Herwig, S. Bowe & K. Maurer, 2015. Co- correspondence among aquatic invertebrates, fish, and submerged aquatic plants in shallow lakes.
Freshwater Science, 34: 953-964.
Haybach, A., 1999. Contribution to larval taxonomy of Ecdyonurus venosus. Group in Germany.
Lauterbornia, 37: 113-150.
Herrmann, J., E. Degerman, A. Gerhardt, C, Johansson & I. Muniz, 1993. Acid-stress effect on stream biology. Ambio (Sweden).
Hill, J. K., K. C. Hamer, L. A. Lace & W. M. T. Banham, 1995. Effects of selective logging on tropical forest butterflies on Buru, Indonesia. Journal of Applied Ecology, 1:754-760.
Horrigan, N., J. E. Dunlop, B. J. Kefford & F. Zavahir, 2007. Acute toxicity largely reflects the salinity sensitivity of stream macroinvertebrates derived using field distributions. Marine and Freshwater Research, 58: 178-186.
Hubbell, S. P., 2001. The unified theory of biogeography and biodiversity. Princeton University Press.
Hurd, L. E. & W. F. Fagan, 1992. Cursorial spiders and succession: age or habitat structure?
Oecologia, 92: 215-221.
Karaman, G. S. & S. Pinkster, 1977. Freshwater gammarus species from Europe, North Africa and adjacent regions of Asia (Crustacea-Amphipoda). Commissie voor de artis bibliotheek.
Kefford, B. J., 1998. The relationship between electrical conductivity and selected macroinvertebrate communities in four river systems of south-west Victoria, Australia. International Journal of Salt Lake Research, 7: 153-170.
23
Kefford, B. J., D. Nugegoda, L. Metzeling & E. J. Fields, 2006. Validating species sensitivity distributions using salinity tolerance of riverine macroinvertebrates in the southern Murray–Darling Basin (Victoria, Australia). Canadian Journal of Fisheries and Aquatic Sciences, 63: 1865-1877.
Kerr, J. T. & L. Packer, 1997. Habitat heterogeneity as a determinant of mammal species richness in high-energy regions. Nature, 385: 252-254.
Koch, K., H. Freude, K. W. Harde, G. A. Lohse & W. Lucht, 1989. Die Käfer mitteleuropas. Goecke
& Evers; G. Fischer.
Kontschán, J. 2001. Proasellus pribenicensis Flasarova, 1977. (Crustacea: Isopoda, Asellota), a magyar faunára új víziászka a Cserehátból. (The first Hungarian record of Proasellus pribenicensis Flasarova, 1977.). Folia Entomologica Hungarica, 62: 319-320. In Hungarian
Kontschán, J., I. B. Muskó & D. Murányi, 2002. A felszíni vizekben elõforduló felemáslábú rákok (Crustacea: Amphipoda) rövid határozója & elõfordulásuk Magyarországon. (Identification and checklist of amphipods (Crustacea: Amphipoda) of the surface waters of Hungary). Folia Historico- Naturalia Musei Matraensis. 26: 151-157. In Hungarian
Lomolino, M. V. & M. D. Weiser, 2001. Towards a more general species-area relationship: diversity on all islands, great and small. Journal of Biogeography, 28: 431-445.
Lomolino, M. V., 2000. Ecology’s most general, yet protean pattern: The species‐ area relationship.
Journal of Biogeography, 27: 17-26.
Lukács, B. A., B. Tóthmérész, G. Borics, G. Várbíró, P. Juhász, B. Kiss . . . & T. Erős, T. 2015.
Macrophyte diversity of lakes in the Pannon Ecoregion (Hungary). Limnologica-Ecology and Management of Inland Waters, 53:74-83.
Molnár, Z., & A. Borhidi, 2003. Hungarian alkali vegetation: Origins, landscape history, syntaxonomy, conservation. Phytocoenologia, 33: 377-408.
24
Mulholland, P. J., C. T. Driscoll, J. W. Elwood, M. P. Osgood, A. V. Palumbo, A. D. Rosemond, . . .
& C. Schofield, 1992. Relationships between stream acidity and bacteria, macroinvertebrates, and fish:
a comparison of north temperate and south temperate mountain streams, USA. Hydrobiologia, 239: 7- 24.
Niesemann, H., 1997. Egel und Krebsegel Österreichs. Sonderheft der Ersten Voralberger Malakologischen Gesellschaft, Rankweil.
Oertli, B., D. A. Joye, E. Castella, R. Juge, D. Cambin, &J. B. Lachavanne 2002. Does size matter?
The relationship between pond area and biodiversity. Biological Conservation, 104: 59-70.
Oertli, B., R. Céréghino, A. Hull, & R. Miracle, 2009. Pond conservation: from science to practice.
Hydrobiologia, 634: 1-9.
Oksanen, J., F. G. Blanchet, R. Kindt, P. Legendre, P. R. Minchin, R. B. O’hara, . . . & M. J. Oksanen, 2013. Package ‘vegan’. Community ecology package, version 2.
Palmgren, P. 1930. Quantitative Untersuchungen ueber die Vogelfauna in den Waeldern Suedfinnlands: mit besonderer Beruecksichtigung Aalands. Acta Zoologica Fennica, 7: 173-5.
Parr, L. B., R. G. Perkins & C. F. Mason, 2002. Reduction in photosynthetic efficiency of Cladophora glomerata, induced by overlying canopies of Lemna spp. Water Research, 36: 1735-1742.
Pintér, L., A. Richnovszky & A. Szigethy, 1979. Distribution of the recent Mollusca of Hungary.
Soosiana, 7: 1-351.
Piscart, C., J. C. Moreteau & J. N. Beisel, 2005. Biodiversity and structure of macroinvertebrate communities along a small permanent salinity gradient (Meurthe River, France). Hydrobiologia, 551:
227-236.
Preston, F. W., 1960. Time and space and the variation of species. Ecology, 41: 611-627.
25
Ricklefs, R. E. & I. J. Lovette, 1999. The roles of island area per se and habitat diversity in the species–area relationships of four Lesser Antillean faunal groups. Journal of Animal Ecology, 68:
1142-1160.
Rosenzweig, M. L., 1995. Species diversity in space and time. Cambridge University Press.
Savage, A. A., 1989. Adults of the British aquatic Hemiptera Heteroptera: a key with ecological notes.
Freshwater Biological Association.
Sfenthourakis, S. & K. A. Triantis, 2009. Habitat diversity, ecological requirements of species and the Small Island Effect. Diversity and Distributions, 15: 131-140.
Shmida, A. V. I. & M. V. Wilson, 1985. Biological determinants of species diversity. Journal of biogeography, 1: 1-20.
Šmilauer, P. & J. Lepš, 2014. Multivariate analysis of ecological data using CANOCO 5. Cambridge University Press.
Stoner, A. W. & F. G. Lewis, 1985. The influence of quantitative and qualitative aspects of habitat complexity in tropical sea-grass meadows. Journal of Experimental Marine Biology and Ecology, 94:
19-40.
Svitok, M., M. Novikmec, P. Bitušík, B. Máša, J. Oboňa, M. Očadlík & E. Michalková, 2014. Benthic communities of low-order streams affected by acid mine drainages: A case study from central Europe.
Water, 6: 1312-1338.
Tachet, H., P. Richoux, M. Bournaud & P. Usseglio-Polatera, 2010. Invertébr& d’eau douce.
Systématique, Biologie, Écologie. Paris, France: CNRS Éditions (in French)
Ter Braak, C. J. F. & P. Šmilauer, 2012. Canoco reference manual and user's guide: software for ordination, version 5. 0. Microcomputer Power, Ithaca, USA.
26
Theel, H. J., E. D. Dibble & J. D. Madsen, 2008. Differential influence of a monotypic and diverse native aquatic plant bed on a macroinvertebrate assemblage; an experimental implication of exotic plant induced habitat. Hydrobiologia, 600: 77-87.
Therneau, T., B. Atkinson, B. Ripley & M. B. Ripley, 2017. Package ‘rpart’. Available online: cran.
ma. ic. ac. uk/web/packages/rpart/rpart. pdf (accessed on 20 April 2016).
Török, P., I. Kapocsi, & B. Deák, 2012. Conservation and management of alkali grassland biodiversity in Central-Europe. Grasslands: types, biodiversity and impacts, 1: 109-118.
Vadstrup, M. & T. V. Madsen, 1995. Growth limitation of submerged aquatic macrophytes by inorganic carbon. Freshwater Biology, 34: 411-419.
Van de Meutter, F., H. Trekels, A. J. Green & R. Stoks, 2010. Is salinity tolerance the key to success for the invasive water bug Trichocorixa verticalis? Hydrobiologia, 649: 231-238.
Warfe, D. M. & Barmuta, L. A. 2004. Habitat structural complexity mediates the foraging success of multiple predator species. Oecologia, 141: 171-178.
Warfe, D. M. & L. A Barmuta, 2006. Habitat structural complexity mediates food web dynamics in a freshwater macrophyte community. Oecologia, 150: 141-154.
Waringer, J. & W. Graf, 1997. Atlas der Österreichischen Köcherfliegenlarven: unter Einschluss der angrenzenden Gebiete. Facultas Universitatsverlag.
Wickham, H., 2011. ggplot2. Wiley Interdisciplinary Reviews: Computational Statistics, 3: 180-185.
Wollmann, K., 2000. Corixidae (Hemiptera, Heteroptera) in acidic mining lakes with pH≤ 3 in Lusatia, Germany. Hydrobiologia, 433: 181-183.
Wolters, J. W., R. C. Verdonschot, J. Schoelynck, P. F. Verdonschot & P. Meire, 2017. The role of macrophyte structural complexity and water flow velocity in determining the epiphytic macroinvertebrate community composition in a lowland stream. Hydrobiologia, 1-17.
27