1 This manuscript is textually identical with the published paper:
1
Borza P, Huber T, Leitner P, Remund N, Graf W (2018): How to coexist with the ’killer 2
shrimp’ Dikerogammarus villosus? Lessons from other invasive Ponto-Caspian peracarids.
3
Aquatic Conservation: Marine and Freshwater Ecosystems 28(6): 1441-1450.
4
The original publication is available at:
5
https://onlinelibrary.wiley.com/doi/10.1002/aqc.2985 6
7
How to coexist with the ’killer shrimp’ Dikerogammarus villosus? Lessons from other 8
invasive Ponto-Caspian peracarids 9
10
Péter Borza1,2, Thomas Huber3, Patrick Leitner3, Nadine Remund4, Wolfram Graf3 11
12
1GINOP Sustainable Ecosystems Group, MTA Centre for Ecological Research, Tihany, 13
Hungary 14
2Danube Research Institute, MTA Centre for Ecological Research, Budapest, Hungary 15
3Department of Water, Atmosphere & Environment, Institute for Hydrobiology & Water 16
Management, BOKU - University of Natural Resources and Applied Life Sciences, Vienna, 17
Austria 18
4UNA - Atelier für Naturschutz und Umweltfragen, Bern, Switzerland 19
20
Correspondence: Péter Borza, GINOP Sustainable Ecosystems Group, MTA Centre for 21
Ecological Research, Klebelsberg Kuno utca 3, H-8237 Tihany, Hungary. E-mail:
22
borza.peter@okologia.mta.hu 23
24
Abstract 25
2 26
1. Studying the interactions among coevolved invaders might help us to understand, 27
predict, and perhaps even mitigate their impact on the native biota. We investigated 28
the factors of spatial niche differentiation among invasive Ponto-Caspian peracarids 29
with the aim of revealing how coevolved species can coexist with the ’killer shrimp’
30
Dikerogammarus villosus, an invasive gammarid replacing non-Ponto-Caspian species 31
throughout Europe.
32
2. Multi-habitat samples from the 3rd Joint Danube Survey were analyzed by partitioning 33
the variation in species density data between environmental and spatial explanatory 34
variable sets. Relevant predictors were identified by forward selection and their role 35
was interpreted based on the RDA triplot. The effect of substrate types was further 36
analyzed in certain species using generalized linear models.
37
3. Our analysis revealed characteristic differences in habitat preference (i.e. spatial niche 38
differentiation) among the species allowing coexistence with D. villosus at different 39
spatial scales. The relatively small and lean body of Chaetogammarus ischnus and 40
Jaera sarsi might allow the avoidance of interference with large Dikerogammarus 41
specimens by using narrow interstices among pebbles and stones (microhabitat-scale 42
differentiation). The remaining Ponto-Caspian species included in the analysis showed 43
affinity to substrate types (Obesogammarus obesus) or current velocity intervals (D.
44
bispinosus) different from those preferred by D. villosus (mesohabitat-scale 45
differentiation), presumably in connection with feeding preferences in some cases (D.
46
haemobaphes, Trichogammarus trichiatus).
47
4. Our results provide a framework for a preliminary risk assessment concerning the still 48
high range expansion potential of D. villosus; i.e. the identification of the most 49
vulnerable species in the presently not invaded but potentially colonizable regions of 50
3 the world based on their habitat preference and morphology. The lessons learned from 51
Ponto-Caspian peracarids can be applied to the whole macroinvertebrate fauna, since 52
the same principles (i.e. the avoidance of interference) can be expected to determine 53
their coexistence with D. villosus.
54 55
Keywords: alien species, benthos, competition, environmental impact assessment, 56
invertebrates, river 57
58
1 Introduction 59
60
The majority of non-indigenous species in any given region originate in a few climatically 61
matching areas strongly connected to the recipient area by anthropogenic transport 62
mechanisms (Hulme, 2009), implying that invader-invader interactions are often determined 63
by coevolution in the native range. Accordingly, coevolved interactions among invaders are a 64
major determinant of invasion impact – in many cases for the worse. Invasive species often 65
promote the establishment of further colonists originating in the same region through 66
facilitative interactions (’invasional meltdown’; Simberloff & Von Holle, 1999) and even if 67
the interaction is essentially competitive (i.e. if the species belong to the same guild), invaders 68
with shared evolutionary history can be expected to show adaptations which allow their stable 69
coexistence (Chase & Leibold, 2003). On the other hand, studying these interactions might 70
help us understand, predict, and perhaps even mitigate the impact of the invaders on the native 71
biota.
72
The recent range expansion of several endemic Ponto-Caspian faunal elements provides a 73
perfect example for the invasion success of coevolved species (Gallardo & Aldridge, 2015;
74
Ricciardi, 2001). Facilitation can be observed among different functional groups, e.g.
75
4 dreissenid mussels provide food and shelter for gammarids (Gergs & Rothhaupt, 2008; Kobak 76
& Żytkowicz, 2007; Stewart, Miner, & Lowe, 1998), and both groups contribute to the food 77
supply of gobies (Borza, Erős, & Oertel, 2009; Grabowska & Grabowski, 2005; Lederer, 78
Massart, & Janssen, 2006). Although species belonging to the same guild compete for the 79
shared resources, sometimes even resulting in turnovers, e.g. between the two invasive 80
Dreissena species (Marescaux et al., 2015; Ricciardi & Whoriskey, 2004), their different 81
tolerances to certain factors allow their long-term coexistence in sufficiently heterogeneous 82
environments (Jones & Ricciardi, 2005; Karatayev et al., 2014; Peyer, McCarthy, & Lee, 83
2009).
84
The gammarid amphipod Dikerogammarus villosus (Sowinsky, 1894) is one of the most 85
successful Ponto-Caspian invaders with considerable impact on the biota. Several different 86
macroinvertebrate groups are negatively affected by the appearance of the species (Gergs, 87
Koester, Schulz, & Schulz, 2014; Van Riel et al., 2006); however, the impact is the most 88
dramatic on ecologically similar but competitively weaker gammarids and isopods, which are 89
often driven to local extinction (Dick & Platvoet, 2000). Laboratory experiments suggested 90
that the voracious predatory feeding of the species might be responsible for the declines;
91
however, field evidence is equivocal in this question (Bacela-Spychalska & Van der Velde, 92
2013; Hellmann et al., 2015; Koester, Bayer, & Gergs, 2016; Koester & Gergs, 2014; Van 93
Riel et al., 2006). As D. villosus is capable of utilizing several different food sources 94
(Platvoet, Van der Velde, Dick, & Li, 2009), the role of predation in its diet might be context- 95
dependent (Hellmann et al., 2015). Therefore, the primary mechanism of species exclusions 96
might be interference competition, where D. villosus forces the weaker competitors to leave 97
their shelter, thereby exposing them to increased predation by fish (Beggel, Brandner, 98
Cerwenka, & Geist, 2016; De Gelder et al., 2016; Kobak, Rachalewski, & Bącela-Spychalska, 99
2016; Van Riel, Healy, Van der Velde, & Bij de Vaate, 2007).
100
5 The species locally eliminated by D. villosus are all native to Europe (e.g, Gammarus spp,, 101
Asellus aquaticus (Linnaeus, 1758); Borza et al., 2015; Dick & Platvoet, 2000) or North- 102
American invaders in Europe (e.g. Gammarus tigrinus Sexton, 1939; Dick & Platvoet, 2000;
103
Leuven et al., 2009); nevertheless, some species were able to persist in the invaded waters by 104
switching habitats (Hesselschwerdt, Necker, & Wantzen, 2008; Platvoet, Dick, MacNeil, Van 105
Riel, & Van der Velde, 2009). On the contrary, Ponto-Caspian peracarids can usually coexist 106
with D. villosus within the same waterbody despite the population declines in some cases, 107
which can be ascribed to the extraordinarily high densities before the appearance of the 108
stronger competitor/predator (i.e. niche extension or enemy release; Borza, Huber, Leitner, 109
Remund, & Graf, 2017a; Van Riel et al., 2006). As D. villosus could displace all studied 110
species from its preferred habitat (i.e. crevices among stones; Devin, Piscart, Beisel, &
111
Moreteau, 2003; Kobak, Jermacz, & Dzierżyńska-Białończyk, 2015) in aquarium experiments 112
(Kobak et al., 2016; Van Riel et al., 2007), those capable of coexisting with it can be expected 113
to show spatial niche differentiation. Differences in habitat use are obvious in some cases, e.g.
114
several Ponto-Caspian amphipods are psammo-pelophilous (Borza, Huber, Leitner, Remund, 115
& Graf, 2017b) and mysids are epibenthic or semi-pelagic; however, the factors of niche 116
differentiation among lithophilous Ponto-Caspian amphipods are only partially known (Borza 117
et al., 2017a).
118
According to all indications, D. villosus has not reached the borders of its potential range; its 119
further expansion can be reasonably expected. The species has recently established in the 120
British Isles, where climatic factors allow its continued spread even presently (Gallardo &
121
Aldridge, 2013); however, climate change might push the potential distributional limit of the 122
species even farther north (as well as elsewhere in Europe). The species also has the potential 123
to expand its range in the Mediterranean and in the Alpine region, where the transport of 124
recreational ships has already allowed it to colonize relatively small, isolated water bodies 125
6 (Bacela-Spychalska, Grabowski, Rewicz, Konopacka, & Wattier, 2013; Rewicz et al., 2017;
126
Tricarico et al., 2010). Apparently, ballast water treatment measures have proved successful at 127
halting the influx of Ponto-Caspian species into North America; nevertheless, the appearance 128
of D. villosus in the Great Lakes is still considered as a realistic threat (Pagnucco et al., 2015).
129
As D. villosus might get into contact with several additional species in the potentially 130
colonizable waters, it is important to understand how it is possible to coexist with this invader.
131
Accordingly, our goal in the present study was to reveal the mechanisms of spatial niche 132
differentiation allowing invasive Ponto-Caspian peracarids to coexist with D. villosus. We 133
interpret the results taking the marked morphological differences among the species 134
(Supplementary Information; Figure S1, Table S1-S2) presumably affecting their habitat use 135
into account (Koehl, 1996). We summarize our conclusions as well as previous results on the 136
coexistence mechanisms in a systematic framework, providing a conceptual basis for a 137
preliminary risk assessment related to the potential further range expansion of D. villosus.
138 139
2 Methods 140
141
2.1 Sample collection and processing 142
143
The macroinvertebrate samples analyzed in the present study were taken during the 3rd Joint 144
Danube Survey (13 August-26 September 2013) at 55 sites of the river (Figure 1) between 145
Ulm (river km 2581) and the Delta (river km 18, Kiliya branch) by the ‘multi-habitat’
146
approach based on the AQEM protocol (Hering, Moog, Sandin, & Verdonschot, 2004). At 147
each site, all available habitat types (four to seven per site) were sampled (altogether 251).
148
Five pooled units covering 25 x 25 cm bottom area were collected for each habitat in the 149
littoral zone by hand net (aperture: 25 x 25 cm, mesh size: 500 μm). All samples were 150
7 preserved in 4% formaldehyde solution in the field, and stored in 70% ethanol after sorting.
151
Sorting was facilitated by fractioning the material on a set of sieves (mesh sizes: 0.5, 2, 5, 10, 152
20 mm). In some cases, 2 to 64-fold subsampling of the smallest one or two fractions was 153
necessary due to the extremely high number of juvenile specimens in the samples.
154 155
2.2 Data analysis 156
157
Only free-living, benthic Ponto-Caspian invasive peracarid species were included in the 158
analysis; six gammarids (Chaetogammarus (formerly Echinogammarus) ischnus (Stebbing, 159
1899), Dikerogammarus bispinosus Martynov, 1925, D. haemobaphes (Eichwald, 1841), D.
160
villosus, Obesogammarus obesus (G.O. Sars, 1894), and Trichogammarus (formerly 161
Echinogammarus) trichiatus (Martynov, 1932)), and the isopod Jaera sarsi Valkanov, 1936.
162
The niche differentiation among the three invasive Dikerogammarus species was analyzed in 163
detail by Borza et al. (2017a) based on the same survey. Nevertheless, D. bispinosus and D.
164
haemobaphes were included in the present study to allow the comparison of their habitat 165
preferences with that of the other species. Mysids were excluded, since their habitat use is 166
markedly different from D. villosus (epibenthic or semi-pelagic). In addition, they reach high 167
abundance mainly in semi-enclosed inlets and slow-flowing sidearms, so they were found 168
only sporadically during the survey (Borza et al., 2015). The filter feeding, tube-dwelling 169
corophiids were excluded, too, since the data suggested that their abundance is primarily 170
determined by the quality and quantity of suspended matter, not habitat characteristics (Borza, 171
Huber, Leitner, Remund, & Graf, 2018). Nevertheless, we share our remarks on the possible 172
mechanisms of their co-existence with D. villosus in the Discussion.
173
Spatial niche differentiation among the species was tested by variance partitioning between 174
environmental and spatial explanatory variables based on redundancy analysis (RDA), using 175
8 the ‘varpart’ function in the ‘vegan’ package (Oksanen et al., 2017) in R 3.2.5 (R Core Team, 176
2016). Ln(x+1) and Hellinger-transformed (Legendre & Gallagher, 2001) count data 177
(individuals per sample) were used in the analysis, but individuals per squaremeter (ind./m2) 178
values are shown in the results and in figures for comparability reasons. Substrate types 179
(Table 1) and several physicochemical parameters (Table 2) were used as environmental 180
explanatory variables. The spatial structure of the study was modelled using the asymmetric 181
eigenvector map (AEM) method (Blanchet, Legendre, & Borcard, 2008a; Blanchet, Legendre, 182
Maranger, Monti, & Pepin, 2011) allowing the consideration of directional spatial processes, 183
induced by water flow in the present case. Two sites (eight samples) were excluded in the two 184
minor arms of the Danube delta (Sulina and Sf. Gheorghe) allowing the one-dimensional 185
representation of the study design. The studied species were not present in 24 samples, and 41 186
additional samples were omitted due to missing values in the explanatory variables, hence 186 187
samples from 47 sites were involved in the analysis. Since the locations of the samples within 188
the sites were not recorded, the values of the generated spatial variables (AEM 189
eigenfunctions) were replicated for all samples within each site. The eigenfunctions both with 190
positive and negative Moran’s I values (modelling positive and negative spatial 191
autocorrelation, respectively) were used in the analysis, which was possible due to the fact 192
that we only had 46 (number of sites minus one) AEM eigenfunctions for 186 samples.
193
Forward selection was performed (Blanchet, Legendre, & Borcard, 2008b) on the 194
environmental as well as the spatial explanatory variable sets using the ‘ordiR2step’ function 195
in the ‘vegan’ package. In each step of the process, the gain in explained variance (adjusted 196
R2) is tested for all variables one-by-one, and the variable with the highest gain is added to the 197
model until the gain is significantly higher than zero (P < 0.05). The two resulting variable 198
sets were included in a variance partitioning (‘varpart’ function in the ‘vegan’ package) and 199
variance portions were tested by ANOVA with 9999 permutations. The differentiation among 200
9 the species and the importance of the environmental variables are interpreted based on the 201
triplot of the model including both environmental and spatial variables.
202
To provide an insight into the structure of spatial autocorrelation (SA henceforth) across 203
multiple spatial scales, Mantel correlograms (Borcard & Legendre, 2012) were constructed 204
using the ‘mantel.correlog’ function in the ‘vegan’ package about (1) the response variables 205
representing both environmentally explainable SA (‘induced spatial dependence’) and 206
environmentally not explainable (‘true’) SA (Legendre & Legendre, 2012), (2) the residuals 207
of the environmental model (representing ‘true’ SA and unexplained induced spatial 208
dependence), and (3) the residuals of the environmental and spatial model (expected to be 209
zero for all spatial scales, if the spatial structure is properly represented in the model). The 210
first distance class in the correlograms represents within-site distances, whereas the 211
subsequent classes were delimited according to the Sturges equation (13 classes with equal 212
widths of 146 river km; the last seven are not shown). P-values of the Mantel correlation 213
coefficients were calculated with Holm-correction.
214
The effect of substrate types was further analysed in a univariate context using generalized 215
linear models (GLM) on count data of C. ischnus, J. sarsi, and O. obesus (T. trichiatus was 216
excluded from this analysis due to its rarity in the material, and Dikerogammarus species 217
were excluded since factors other than substrate type have strong influence on their habitat 218
preferences; Borza et al. 2017a). The negative binomial family with log link function was 219
used (‘glm.nb’ function in the ‘MASS’ package; Venables & Ripley, 2002) since it provided a 220
better fit than Poisson and quasi-Poisson models based on the distribution of the deviance 221
residuals (Zuur, Ieno, Walker, Saveliev, & Smith, 2009). Pairwise comparisons among the 222
parameter estimates of substrate types were made using the ‘glht’ function in the ‘multcomp’
223
package (Hothorn, Bretz, & Westfall, 2008) in with Tukey correction. As J. sarsi did not 224
10 occur at all on psammopelal, this substrate type was not included in the model and it was 225
substituted with zeros in the pairwise comparisons.
226 227
3 Results 228
229
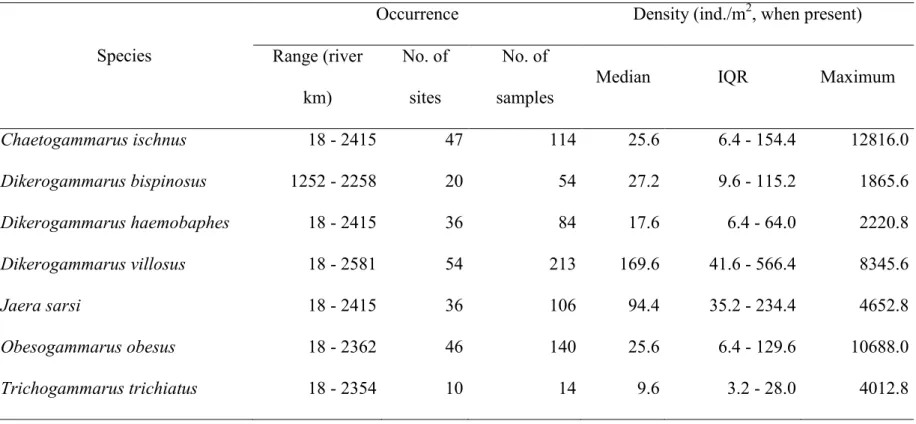
All target species were present in almost the entire studied section of the Danube, except for 230
D. bispinosus (Table 3; Borza et al., 2017a). D. villosus proved to be the most widespread and 231
– on average – most abundant during the survey, followed by C. ischnus and O. obesus, which 232
in turn reached a maximal density even higher than D. villosus (Table 3). J. sarsi was still 233
more abundant than the two remaining Dikerogammarus species, while T. trichiatus was 234
rather rare (Table 3).
235
The forward selection procedure on the environmental variables selected substrate types, total 236
suspended solids (TSS), dissolved oxygen concentration, total nitrogen concentration, current 237
velocity, and total phosphorus concentration (Table 4), explaining 25.75% of the total 238
variation (Table 5). The forward selection on the spatial variables selected 19 AEM 239
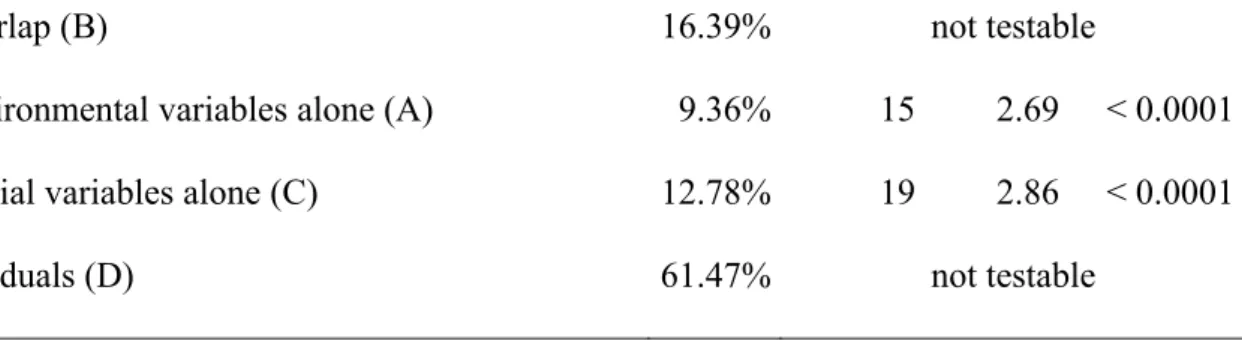
eigenvectors explaining 29.17%; nevertheless, the overlap between the two variable sets was 240
considerable (together they accounted for 38.53 %; Table 5).
241
The Mantel correlogram of the response variables indicated significant positive SA in the 242
smallest three distance classes (0-292 river km), significant negative SA at intermediate 243
distances (292-876 river km), whereas in the largest distance classes SA was not significant 244
(Figure 2). The inclusion of environmental predictors in the model decreased SA 245
considerably; however, it remained significantly positive between 0 and 146 river km 246
distances (Figure 2). SA was not significant among the residuals of the model including 247
environmental and spatial predictor variables in any of the distance classes (Figure 2).
248
11 All seven constrained axes of the RDA explained a significant proportion of the variance 249
(Table 6); nevertheless, the first three axes (cumulative proportion explained: 40.10 %) 250
provide a sufficient basis for the interpretation of the results (Figure 3). Current velocity and 251
TSS – the most important factors of niche differentiation among the three Dikerogammarus 252
species (Borza et al., 2017a) – were considerably correlated with all three canonical axes;
253
therefore, the separation of the three Dikerogammarus species in the present analysis was 254
observable in three dimensions. D. villosus separated from D. haemobaphes and D. bispinosus 255
along the first and second axes (Figure 3a), whereas the latter two species differentiated 256
primarily along the third axis (Figure 3b). The position of C. ischnus and J. sarsi was close to 257
D. haemobaphes on the first and second axes (Figure 3a), reflecting their preference for 258
gravel (especially micro- and mesolithal). However, the two species separated considerably 259
along the third axis (Figure 3b), owing to the higher affinity of J. sarsi to ripraps. O. obesus 260
differentiated markedly from all the other species along the second axis (Figure 3), reflecting 261
its association with akal and argyllal. Due to its rarity, the position of T. trichiatus was close 262
to the origin of the ordination space (Figure 3). Its only massive occurrence (> 4 000 ind./m2) 263
was recorded on xylal (Figure 4).
264
The GLMs confirmed the results of the RDA regarding the substrate preference of the three 265
species included in this analysis. C. ischnus and J. sarsi showed a marked affinity to different 266
sizes of gravel and xylal, while the latter also preferred riprap (Figures 4, 5a-b, Tables S3, 267
S4). O. obesus preferred argyllal and smaller sizes of gravel (akal and microlithal; Figures 4, 268
5c, Table S5). The relatively few significant comparisons with akal and macrolithal are in part 269
attributable to the low number of samples with these substrate types, reflecting their rarity in 270
the studied river section.
271 272
4 Discussion 273
12 274
Our analysis revealed characteristic differences in habitat preference among the species, 275
indicating spatial niche differentiation primarily determined by substrate types. The remaining 276
five significant variables accounted for only minor portions of the variance. The effect of 277
current velocity and TSS is attributable mainly to their importance in the niche differentiation 278
among the three Dikerogammarus species (Borza et al., 2017a). The role of total phosphorus 279
concentration was similar to TSS due to their relatively strong correlation (Spearman's rank 280
correlation: 0.364), whereas total nitrogen and dissolved oxigen concentration did not show 281
clear association with any of the species, so their effect is individually not interpretable.
282
The preference of C. ischnus for gravel proved to be an effective way to avoid D. villosus;
283
however, it resulted in a strong overlap with D. haemobaphes, a species capable of similarly 284
aggressive predation as its notorious relative (Bacela-Spychalska & Van der Velde, 2013).
285
Size-dependent microhabitat choice is a widely reported phenomenon among gammarids 286
(Devin et al., 2003; Hacker & Steneck, 1990; Jermacz, Dzierżyńska, Poznańska, & Kobak, 287
2015; Platvoet, Dick, et al., 2009); therefore, we assume that the relatively small-sized and 288
strongly flattened C. ischnus (Figure S1) can utilize the deep, narrow interstices among coarse 289
gravel. As only smaller specimens of the more robust Dikerogammarus species (Figure S1) 290
can enter the crevices of a given width, C. ischnus can avoid direct interference with larger, 291
potentially dangerous individuals. Accordingly, the mesohabitat-preference shown by our 292
results might in fact reflect differences in microhabitat use, since interstices of the preferred 293
width might be most abundant in micro- and mesolithal.
294
We assume that the same mechanism might explain the similar substrate-preference of J.
295
sarsi, a species even smaller and more flattened than C. ischnus. The fact that it was even 296
more abundant on ripraps than C. ischnus might indicate that its co-existence with D. villosus 297
is even less problematic.
298
13 Morphological and behavioural adaptations might account for the habitat preference of O.
299
obesus, as well. This species can burrow itself into fine sediments (P. Borza, pers. obs.). It can 300
form holes in clay which might serve as shelter, explaining the high observed density of the 301
species on this substrate type. In sand, however, the animal gets entirely buried under the 302
particles, which might be an effective predator escape mechanism, but not a sustainable 303
lifestyle. Nevertheless, other factors – such as food availability or substrate stability – also 304
might be attributable for the low density of O. obesus on sand. The peculiar body shape of the 305
species might have another advantage; when bent, the narrow anterior and posterior tips along 306
with the wide central body part form a wedge, allowing the animal to fit into the relatively 307
shallow and wide gaps among the particles of fine gravel. The ability to utilize this substrate 308
type is an effective way to avoid large Dikerogammarus specimens (Devin et al., 2003), and it 309
also might account for the higher invasion potential of the species as compared to psammo- 310
pelophilous Ponto-Caspian amphipods (Borza et al., 2017b).
311
Trichogammarus trichiatus was relatively rare in our material; however, since its density 312
varied within a wide range, we felt that it would be useful to publish our data. Its inclusion in 313
the analysis did not change the overall results, since the Hellinger-transformation gives low 314
weight to rare species (Legendre & Gallagher, 2001). Information on the habitat preference of 315
T. trichiatus is scarce in the literature apart from invasion reports noting its occurrence on 316
gravel as well as riprap (e.g. Borza, 2009); however, the data of Müller & Eggers (2006) 317
suggest its affinity to plants. Our results support this; the massive occurrence of the species on 318
woody debris suggests a differentiation from D. villosus at the mesohabitat scale. As D.
319
villosus is rather ineffective at detritus decomposition according to most studies (Jourdan et 320
al., 2016; MacNeil, Dick, Platvoet, & Briffa, 2010; Piscart, Mermillod-Blondin, Maazouzi, 321
Merigoux, & Marmonier, 2011; however, Truhlar, Dodd, & Aldridge, 2014 came to a 322
different conclusion), the affinity of T.trichiatus to organic materials might indicate a 323
14 difference in their feeding preferences. Nevertheless, further data are needed to test our
324
observation on the substrate choice of the species, as well as its potential connection to 325
feeding.
326
In summary, co-existence with D. villosus can be achieved at different spatial scales (Kneitel 327
& Chase, 2004). Species considerably smaller and/or flatter than D. villosus (e.g. C. ischnus 328
and J. sarsi) might be able to persist in the same mesohabitat by avoiding it at the 329
microhabitat scale. We assume that this mechanism plays a role in the case of corophiids, as 330
well, coupled with the protection of the tube, which might keep D. villosus away at least when 331
the animals form dense colonies among/under stones.
332
Most Ponto-Caspian gammarids show a substrate preference different from D. villosus, thus 333
avoiding it at the mesohabitat scale. Environmental factors allowing niche differentiation 334
include current velocity (D. haemobaphes and especially D. bispinosus; Borza et al., 2017a), 335
and sediment grain size (O. obesus and all psammo-pelophilous species; Borza et al., 2017b).
336
Differences in feeding preferences also might lead to stable coexistence if the availability of 337
food sources is spatially heterogeneous, leading to spatial differentiation between the 338
competitors. This mechanism might play a role in the coexistence of D. haemobaphes with D.
339
villosus in relation to suspended matter (Borza et al., 2017a), and possibly also in the case of 340
T.trichiatus, showing affinity to organic habitats.
341
Not only Ponto-Caspian gammarids are able to partition habitats with D. villosus, as 342
demonstrated by the example of G. tigrinus, which – contrarily to its decline in rivers – was 343
able to coexist with the stronger competitor by switching to sandy habitats in Lake IJselmeer 344
(Platvoet, Dick, et al., 2009). Similarly, G. roeselii was able to persist in Lake Constance in 345
macrophyte stands after the invasion of D. villosus (Hesselschwerdt et al., 2008). Most non- 346
Ponto-Caspian peracarids apparently cannot persist in waters where D. villosus is present;
347
however, they still inhabit smaller rivers and streams of the invaded regions, implying that 348
15 they can coexist with it in the same catchment (i.e. macrohabitat scale). Nevertheless, there is 349
no guarantee that all species presently not confronted with D. villosus will be able to do so.
350
Although the mechanisms of coexistence suggested by our results and summarized above 351
cannot be regarded as a full list of possibilities for coexistence with D. villosus, they provide a 352
framework for a preliminary risk assessment in the presently not invaded but potentially 353
colonizable regions of the world. Morphological and habitat preference data of native species 354
could be compiled and used for identifying the most vulnerable ones (i.e. species with body 355
length/width similar to D. villosus and a strict preference for stony substrates and lentic 356
conditions), allowing the elaboration of specific management plans. The lessons learned from 357
Ponto-Caspian peracarids could be applied to other macroinvertebrate groups as well, since 358
the same principles (i.e. the avoidance of physical contact) can be expected to determine their 359
coexistence with D. villosus.
360 361
Acknowledgements 362
363
Joint Danube Survey 3 was organized by the International Commission for the Protection of 364
the Danube River (ICPDR). We would like to thank everyone involved in the organization, 365
field work, and evaluation of the survey for their effort. This work was supported by the 366
MARS project (Managing Aquatic ecosystems and water Resources under multiple Stress) 367
funded by the European Union under the 7th Framework Programme, grant agreement no:
368
603378, and the GINOP 2.3.2-15-2016-00019 grant. Péter Borza was supported by the 369
Scholarship of the Scholarship Foundation of the Republic of Austria for Post-docs from 370
October 2013 until March 2014 (funding organization: OeAD-GmbH on behalf of and 371
financed by the Scholarship Foundation of the Republic of Austria). We would like to thank 372
two anonymous referees for their useful comments on an earlier version of the manuscript.
373
16 374
References 375
376
Bacela-Spychalska, K., Grabowski, M., Rewicz, T., Konopacka, A., & Wattier, R. (2013).
377
The “killer shrimp” Dikerogammarus villosus (Crustacea, Amphipoda) invading 378
Alpine lakes: Overland transport by recreational boats and scuba-diving gear as 379
potential entry vectors? Aquatic Conservation: Marine and Freshwater Ecosystems, 380
23, 606–618.
381
Bacela-Spychalska, K., & Van der Velde, G. (2013). There is more than one “killer shrimp”:
382
Trophic positions and predatory abilities of invasive amphipods of Ponto-Caspian 383
origin. Freshwater Biology, 58, 730–741.
384
Beggel, S., Brandner, J., Cerwenka, A. F., & Geist, J. (2016). Synergistic impacts by an 385
invasive amphipod and an invasive fish explain native gammarid extinction. BMC 386
Ecology, 16, 32.
387
Blanchet, F. G., Legendre, P., & Borcard, D. (2008a). Modelling directional spatial processes 388
in ecological data. Ecological Modelling, 215, 325–336.
389
Blanchet, F. G., Legendre, P., & Borcard, D. (2008b). Forward selection of explanatory 390
variables. Ecology, 89, 2623–2632.
391
Blanchet, F. G., Legendre, P., Maranger, R., Monti, D., & Pepin, P. (2011). Modelling the 392
effect of directional spatial ecological processes at different scales. Oecologia, 166, 393
357–368.
394
Borcard, D., & Legendre, P. (2012). Is the Mantel correlogram powerful enough to be useful 395
in ecological analysis? A simulation study. Ecology, 93, 1473–1481.
396
17 Borza, P. (2009). First record of the Ponto-Caspian amphipod Echinogammarus trichiatus 397
(Martynov, 1932) (= Chaetogammarus trichiatus) (Crustacea: Amphipoda) for the 398
Middle-Danube (Slovakia and Hungary). Aquatic Invasions, 4, 693–696.
399
Borza, P., Csányi, B., Huber, T., Leitner, P., Paunović, M., Remund, N., … Graf, W. (2015).
400
Longitudinal distributional patterns of Peracarida (Crustacea, Malacostraca) in the 401
River Danube. Fundamental and Applied Limnology, 187, 113–126.
402
Borza, P., Erős, T., & Oertel, N. (2009). Food resource partitioning between two invasive 403
gobiid species (Pisces, Gobiidae) in the littoral zone of the River Danube, Hungary.
404
International Review of Hydrobiology, 94, 609–621.
405
Borza, P., Huber, T., Leitner, P., Remund, N., & Graf, W. (2017a). Current velocity shapes 406
co-existence patterns among invasive Dikerogammarus species. Freshwater Biology, 407
62, 317–328.
408
Borza, P., Huber, T., Leitner, P., Remund, N., & Graf, W. (2017b). Success factors and future 409
prospects of Ponto–Caspian peracarid (Crustacea: Malacostraca) invasions: Is “the 410
worst over”? Biological Invasions, 19, 1517–1532.
411
Borza, P., Huber, T., Leitner, P., Remund, N., & Graf, W. (2018). Niche differentiation 412
among invasive Ponto-Caspian Chelicorophium species (Crustacea, Amphipoda, 413
Corophiidae) by food particle size. Aquatic Ecology, DOI: 10.1007/s10452-018-9653- 414
8.
415
Chase, J. M., & Leibold, M. A. (2003). Ecological niches: Linking classical and 416
contemporary approaches. Chicago and London: University of Chicago Press.
417
Csardi, G., & Nepusz, T. (2006). The igraph software package for complex network research.
418
InterJournal, Complex Systems, 1695.
419
18 De Gelder, S., Van der Velde, G., Platvoet, D., Leung, N., Dorenbosch, M., Hendriks, H. W.
420
M., & Leuven, R. (2016). Competition for shelter sites: Testing a possible mechanism 421
for gammarid species displacements. Basic and Applied Ecology, 17, 455–462.
422
Devin, S., Piscart, C., Beisel, J. N., & Moreteau, J. C. (2003). Ecological traits of the 423
amphipod invader Dikerogammarus villosus on a mesohabitat scale. Archiv Für 424
Hydrobiologie, 158, 43–56.
425
Dick, J. T., & Platvoet, D. (2000). Invading predatory crustacean Dikerogammarus villosus 426
eliminates both native and exotic species. Proceedings of the Royal Society of London.
427
Series B: Biological Sciences, 267, 977–983.
428
Gallardo, B., & Aldridge, D. C. (2013). Priority setting for invasive species management:
429
Risk assessment of Ponto-Caspian invasive species into Great Britain. Ecological 430
Applications, 23, 352–364.
431
Gallardo, B., & Aldridge, D. C. (2015). Is Great Britain heading for a Ponto–Caspian 432
invasional meltdown? Journal of Applied Ecology, 52, 41–49.
433
Gergs, R., Koester, M., Schulz, R. S., & Schulz, R. (2014). Potential alteration of cross- 434
ecosystem resource subsidies by an invasive aquatic macroinvertebrate: Implications 435
for the terrestrial food web. Freshwater Biology, 59, 2645–2655.
436
Gergs, R., & Rothhaupt, K.-O. (2008). Effects of zebra mussels on a native amphipod and the 437
invasive Dikerogammarus villosus: The influence of biodeposition and structural 438
complexity. Journal of the North American Benthological Society, 27, 541–548.
439
Grabowska, J., & Grabowski, M. (2005). Diel-feeding activity in early summer of racer goby 440
Neogobius gymnotrachelus (Gobiidae): A new invader in the Baltic basin. Journal of 441
Applied Ichthyology, 21, 282–286.
442
Hacker, S. D., & Steneck, R. S. (1990). Habitat Architecture and the Abundance and Body- 443
Size-Dependent Habitat Selection of a Phytal Amphipod. Ecology, 71, 2269–2285.
444
19 Hellmann, C., Worischka, S., Mehler, E., Becker, J., Gergs, R., & Winkelmann, C. (2015).
445
The trophic function of Dikerogammarus villosus (Sowinsky, 1894) in invaded rivers:
446
A case study in the Elbe and Rhine. Aquatic Invasions, 10, 385–397.
447
Hering, D., Moog, O., Sandin, L., & Verdonschot, P. F. (2004). Overview and application of 448
the AQEM assessment system. Hydrobiologia, 516, 1–20.
449
Hesselschwerdt, J., Necker, J., & Wantzen, K. M. (2008). Gammarids in Lake Constance:
450
Habitat segregation between the invasive Dikerogammarus villosus and the indigenous 451
Gammarus roeselii. Fundamental and Applied Limnology/Archiv Für Hydrobiologie, 452
173, 177–186.
453
Hothorn, T., Bretz, F., & Westfall, P. (2008). Simultaneous inference in general parametric 454
models. Biometrical Journal, 50, 346–363.
455
Hulme, P. E. (2009). Trade, transport and trouble: Managing invasive species pathways in an 456
era of globalization. Journal of Applied Ecology, 46, 10–18.
457
Jermacz, Ł., Dzierżyńska, A., Poznańska, M., & Kobak, J. (2015). Experimental evaluation of 458
preferences of an invasive Ponto-Caspian gammarid Pontogammarus robustoides 459
(Amphipoda, Gammaroidea) for mineral and plant substrata. Hydrobiologia, 746, 460
209–221.
461
Jones, L. A., & Ricciardi, A. (2005). Influence of physicochemical factors on the distribution 462
and biomass of invasive mussels (Dreissena polymorpha and Dreissena bugensis) in 463
the St. Lawrence River. Canadian Journal of Fisheries and Aquatic Sciences, 62, 464
1953–1962.
465
Jourdan, J., Westerwald, B., Kiechle, A., Chen, W., Streit, B., Klaus, S., … Plath, M. (2016).
466
Pronounced species turnover, but no functional equivalence in leaf consumption of 467
invasive amphipods in the river Rhine. Biological Invasions, 18, 763–774.
468
20 Karatayev, A. Y., Burlakova, L. E., Pennuto, C., Ciborowski, J., Karatayev, V. A., Juette, P., 469
& Clapsadl, M. (2014). Twenty five years of changes in Dreissena spp. populations in 470
Lake Erie. Journal of Great Lakes Research, 40, 550–559.
471
Kneitel, J. M., & Chase, J. M. (2004). Trade-offs in community ecology: Linking spatial 472
scales and species coexistence. Ecology Letters, 7, 69–80.
473
Kobak, J., Jermacz, Ł., & Dzierżyńska-Białończyk, A. (2015). Substratum preferences of the 474
invasive killer shrimp Dikerogammarus villosus. Journal of Zoology, 297, 66–76.
475
Kobak, J., Rachalewski, M., & Bącela-Spychalska, K. (2016). Conquerors or exiles? Impact 476
of interference competition among invasive Ponto-Caspian gammarideans on their 477
dispersal rates. Biological Invasions, 18, 1953–1965.
478
Kobak, J., & Żytkowicz, J. (2007). Preferences of invasive Ponto-Caspian and native 479
European gammarids for zebra mussel (Dreissena polymorpha, Bivalvia) shell habitat.
480
Hydrobiologia, 589, 43–54.
481
Koehl, M. A. R. (1996). When does morphology matter? Annual Review of Ecology and 482
Systematics, 27, 501–542.
483
Koester, M., Bayer, B., & Gergs, R. (2016). Is Dikerogammarus villosus (Crustacea, 484
Gammaridae) a “killer shrimp”in the River Rhine system? Hydrobiologia, 768, 299–
485
313.
486
Koester, M., & Gergs, R. (2014). No evidence for intraguild predation of Dikerogammarus 487
villosus (Sowinsky, 1894) at an invasion front in the Untere Lorze, Switzerland.
488
Aquatic Invasions, 9, 489–497.
489
Lederer, A., Massart, J., & Janssen, J. (2006). Impact of round gobies (Neogobius 490
melanostomus) on dreissenids (Dreissena polymorpha and Dreissena bugensis) and 491
the associated macroinvertebrate community across an invasion front. Journal of 492
Great Lakes Research, 32, 1–10.
493
21 Legendre, P., & Gallagher, E. D. (2001). Ecologically meaningful transformations for
494
ordination of species data. Oecologia, 129, 271–280.
495
Legendre, P., & Legendre, L. F. (2012). Numerical ecology. 3rd English edition. (Vol. 24).
496
Amsterdam: Elsevier.
497
Leuven, R. S., Van der Velde, G., Baijens, I., Snijders, J., Van der Zwart, C., Lenders, H. R., 498
& Bij de Vaate, A. (2009). The river Rhine: A global highway for dispersal of aquatic 499
invasive species. Biological Invasions, 11, 1989–2008.
500
MacNeil, C., Dick, J. T., Platvoet, D., & Briffa, M. (2010). Direct and indirect effects of 501
species displacements: An invading freshwater amphipod can disrupt leaf-litter 502
processing and shredder efficiency. Journal of the North American Benthological 503
Society, 30, 38–48.
504
Marescaux, J., Boets, P., Lorquet, J., Sablon, R., Van Doninck, K., & Beisel, J.-N. (2015).
505
Sympatric Dreissena species in the Meuse River : Towards a dominance shift from 506
zebra to quagga mussels. Aquatic Invasions, 10, 287–298.
507
Müller, R., & Eggers, T. O. (2006). Erste Nachweise von Echinogammarus trichiatus 508
(Martynov, 1932) in Brandenburg und Berlin (Crustacea: Amphipoda). Lauterbornia, 509
58, 123–126.
510
Oksanen, J., Blanchet, F. G., Kindt, R., Legendre, P., Minchin, P. R., O’Hara, R. B., … 511
Wagner, H. (2017). vegan: Community Ecology Package. R package version 2.4-3.
512
http://CRAN.R-project.org/package=vegan.
513
Pagnucco, K. S., Maynard, G. A., Fera, S. A., Yan, N. D., Nalepa, T. F., & Ricciardi, A.
514
(2015). The future of species invasions in the Great Lakes-St. Lawrence River basin.
515
Journal of Great Lakes Research, 41, 96–107.
516
22 Peyer, S. M., McCarthy, A. J., & Lee, C. E. (2009). Zebra mussels anchor byssal threads 517
faster and tighter than quagga mussels in flow. Journal of Experimental Biology, 212, 518
2027–2036.
519
Piscart, C., Mermillod-Blondin, F., Maazouzi, C., Merigoux, S., & Marmonier, P. (2011).
520
Potential impact of invasive amphipods on leaf litter recycling in aquatic ecosystems.
521
Biological Invasions, 13, 2861–2868.
522
Platvoet, D., Dick, J. T., MacNeil, C., van Riel, M. C., & van der Velde, G. (2009). Invader–
523
invader interactions in relation to environmental heterogeneity leads to zonation of 524
two invasive amphipods, Dikerogammarus villosus (Sowinsky) and Gammarus 525
tigrinus Sexton: amphipod pilot species project (AMPIS) report 6. Biological 526
Invasions, 11, 2085–2093.
527
Platvoet, D., Van Der Velde, G., Dick, J. T., & Li, S. (2009). Flexible omnivory in 528
Dikerogammarus villosus (Sowinsky, 1894)(Amphipoda)—Amphipod Pilot Species 529
Project (AMPIS) Report 5. Crustaceana, 82, 703–720.
530
R Core Team. (2016). R: A language and environment for statistical computing. R Foundation 531
for Statistical Computing, Vienna, Austria. URL http://www.R-project.org/.
532
Rewicz, T., Wattier, R., Rigaud, T., Grabowski, M., Mamos, T., & Bącela-Spychalska, K.
533
(2017). The killer shrimp, Dikerogammarus villosus, invading European Alpine 534
Lakes: A single main source but independent founder events with an overall loss of 535
genetic diversity. Freshwater Biology, 62, 1036–1051.
536
Ricciardi, A. (2001). Facilitative interactions among aquatic invaders: Is an“ invasional 537
meltdown” occurring in the Great Lakes? Canadian Journal of Fisheries and Aquatic 538
Sciences, 58, 2513–2525.
539
23 Ricciardi, A., & Whoriskey, F. G. (2004). Exotic species replacement: Shifting dominance of 540
dreissenid mussels in the Soulanges Canal, upper St. Lawrence River, Canada. Journal 541
of the North American Benthological Society, 23, 507–514.
542
Simberloff, D., & Von Holle, B. (1999). Positive interactions of nonindigenous species:
543
Invasional meltdown? Biological Invasions, 1, 21–32.
544
Stewart, T. W., Miner, J. G., & Lowe, R. L. (1998). Macroinvertebrate communities on hard 545
substrates in western Lake Erie: structuring effects of Dreissena. Journal of Great 546
Lakes Research, 24, 868–879.
547
Tricarico, E., Mazza, G., Orioli, G., Rossano, C., Scapini, F., & Gherardi, F. (2010). The 548
killer shrimp, Dikerogammarus villosus (Sowinsky, 1894), is spreading in Italy.
549
Aquatic Invasions, 5, 211–214.
550
Truhlar, A. M., Dodd, J. A., & Aldridge, D. C. (2014). Differential leaf-litter processing by 551
native (Gammarus pulex) and invasive (Dikerogammarus villosus) freshwater 552
crustaceans under environmental extremes. Aquatic Conservation: Marine and 553
Freshwater Ecosystems, 24, 56–65.
554
Van Riel, M. C., Healy, E. P., Van der Velde, G., & Bij de Vaate, A. (2007). Interference 555
competition among native and invader amphipods. Acta Oecologica, 31, 282–289.
556
Van Riel, M. C., Van der Velde, G., Rajagopal, S., Marguillier, S., Dehairs, F., & Bij de 557
Vaate, A. (2006). Trophic relationships in the Rhine food web during invasion and 558
after establishment of the Ponto-Caspian invader Dikerogammarus villosus.
559
Hydrobiologia, 565, 39–58.
560
Venables, W. N., & Ripley, B. D. (2002). Modern Applied Statistics with S. Fourth Edition.
561
New York: Springer.
562
24 Zuur, A. F., Ieno, E. N., Walker, N. J., Saveliev, A. A., & Smith, G. M. (2009). Mixed effects 563
models and extensions in ecology with R. New York: Springer Science and Business 564
Media.
565 566 567
25 Tables
568 569
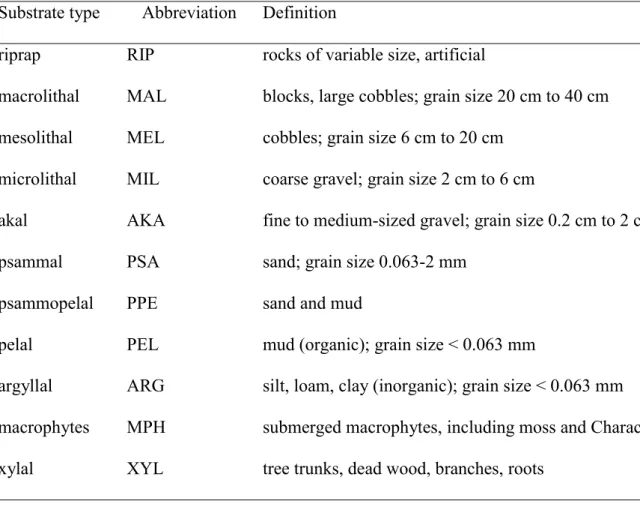
TABLE 1 Definitions of substrate types used in the study.
570 571
Substrate type Abbreviation Definition
riprap RIP rocks of variable size, artificial
macrolithal MAL blocks, large cobbles; grain size 20 cm to 40 cm mesolithal MEL cobbles; grain size 6 cm to 20 cm
microlithal MIL coarse gravel; grain size 2 cm to 6 cm
akal AKA fine to medium-sized gravel; grain size 0.2 cm to 2 cm
psammal PSA sand; grain size 0.063-2 mm
psammopelal PPE sand and mud
pelal PEL mud (organic); grain size < 0.063 mm
argyllal ARG silt, loam, clay (inorganic); grain size < 0.063 mm macrophytes MPH submerged macrophytes, including moss and Characeae xylal XYL tree trunks, dead wood, branches, roots
26 TABLE 2 Physicochemical parameters used as environmental explanatory variables in the study. The parameters were measured a: for all
samples (averaged over the five sampling units), b: at two points per site near the river banks, or c: at one point per site in the middle of the channel.
Parameter Method [standard] Measurement Range
Current velocity
Marsh-McBirney Flo-Mate™ Model 2000 portable
electromagnetic flow meter approx. 5 cm above the bottom a 0-0.37 m/s
Depth measuring stick a 0.1-1.2 m
Chlorophyll-a concentration spectrophotometry [DIN 38412] b 0.10-18.77 μg/L
Conductivity YSI EXO2 portable multiparameter sonde from motor-boat b 9.29-497.90 μS/cm Dissolved O2 concentration (DO) YSI EXO2 portable multiparameter sonde from motor-boat b 5.89-10.42 mg/L
pH YSI EXO2 portable multiparameter sonde from motor-boat b 7.77-8.43
Dissolved organic carbon concentration combustion catalytic oxidation/NDIR [EN 1484:2002] b 1.59-7.63 mg/L
Total nitrogen concentration (TN) spectrophotometry [EN ISO 11905] b 0.52-2.95 mg/L
Total phosphorus concentration (TP) spectrophotometry [EN ISO 6878] b 0.02-0.11 mg/L
Total suspended solids (TSS) gravimetry [EN 872] c 2.5-50.0 mg/L
27 TABLE 3 Range, occurrence, and density of the species during the survey (IQR: interquartile range).
Species
Occurrence Density (ind./m2, when present) Range (river
km)
No. of sites
No. of samples
Median IQR Maximum
Chaetogammarus ischnus 18 - 2415 47 114 25.6 6.4 - 154.4 12816.0
Dikerogammarus bispinosus 1252 - 2258 20 54 27.2 9.6 - 115.2 1865.6
Dikerogammarus haemobaphes 18 - 2415 36 84 17.6 6.4 - 64.0 2220.8
Dikerogammarus villosus 18 - 2581 54 213 169.6 41.6 - 566.4 8345.6
Jaera sarsi 18 - 2415 36 106 94.4 35.2 - 234.4 4652.8
Obesogammarus obesus 18 - 2362 46 140 25.6 6.4 - 129.6 10688.0
Trichogammarus trichiatus 18 - 2354 10 14 9.6 3.2 - 28.0 4012.8
TABLE 4 Consecutive steps of the forward selection procedure on the environmental variables. The seventh step is only shown for comparability; the seventh variable (pH) was not included in the model since the P-value exceeded 0.05.
28 Forward selection
step Added variable
Cumulative var.
explained df F P
Step 1 Substrate types 17.10% 10 4.82 < 0.0001
Step 2 Total suspended solids 20.19% 1 7.78 < 0.0001
Step 3 Dissolved O2 conc. 22.09% 1 5.24 0.0004
Step 4 Total N conc. 23.99% 1 5.32 0.0004
Step 5 Current velocity 24.90% 1 3.09 0.0143
Step 6 Total P conc. 25.75% 1 2.96 0.0161
(Step 7) pH 26.06% 1 1.71 0.1280
TABLE 5 The result of the variance partitioning (A + B + C + D = 1).
Variance fraction % df F P
Environmental and spatial variables (A+B+C) 38.53% 34 4.41 < 0.0001 Environmental variables (A+B) 25.75% 15 5.28 < 0.0001
Spatial variables (B+C) 29.17% 19 5.01 < 0.0001
29
Overlap (B) 16.39% not testable
Environmental variables alone (A) 9.36% 15 2.69 < 0.0001
Spatial variables alone (C) 12.78% 19 2.86 < 0.0001
Residuals (D) 61.47% not testable
TABLE 6 Variance explained by the canonical axes (not comparable with the results of the variance partitioning since adjusted R2-values are not avaliable for axes).
Canonical axis df Variance % F P RDA1 1 18.67% 66.24 < 0.0001 RDA2 1 13.86% 49.18 < 0.0001
RDA3 1 7.57% 26.84 < 0.0001
RDA4 1 4.31% 15.28 < 0.0001
RDA5 1 2.67% 9.47 < 0.0001
RDA6 1 1.86% 6.61 < 0.0001
RDA7 1 0.89% 3.16 0.0127
30
Residual 178 50.17%
31 Figure legends
FIGURE 1 Macroinvertebrate sampling sites during the 3rd Joint Danube Survey. The dark shaded area corresponds to the River Danube basin. Codes of the riparian countries: DE:
Germany, AT: Austria, SK: Slovakia, HU: Hungary, HR: Croatia, RS: Serbia, RO: Romania, BG: Bulgaria, MD: Moldova, UA: Ukraine.
FIGURE 2 Mantel correlograms of the response variables (squares/solid line), the residuals of the environmental model (circles/dashed line), and the residuals of the environmental and spatial model (triangles/dotted line). The distance class at 0 river km corresponds to within- site distances. Solid symbols indicate significant correlations (*: P < 0.05, **: P < 0.01, ***:
P < 0.001). Numbers on the top of the graph indicate the number of pairs involved in the calculation of correlations for each distance class. Symbols are connected only to visualize the trends.
FIGURE 3 Triplot showing the results of the RDA including six environmental and the 19 spatial explanatory variables (‘WA’ scores, species scaling). A: RDA1 vs. RDA2, B: RDA3 vs. RDA2. Empty circles represent samples. Ci: Chaetogammarus ischnus, Db:
Dikerogammarus bispinosus, Dh: Dikerogammarus haemobaphes, Dv: Dikerogammarus villosus, Js: Jaera sarsi, Oo: Obesogammarus obesus, Tt: Trichogammarus trichiatus. Arrows represent continuous environmental variables (cur: current velocity, diO: dissolved oxygen concentration, toN: total nitrogen concentration, toP: total phosphorus concentration, tss: total suspended solids). Substrate type abbreviations as in Table 1. AEM eigenfunctions are not shown for the sake of perspicuity.
32 FIGURE 4 Density of the species on the different substrate types (log(x)+1-transformed).
Abbreviations as in Table 1.
FIGURE 5 Network representations of the pairwise comparisons of the parameter estimates of substrate types in the GLMs (created using the ‘igraph’ package; Csardi & Nepusz, 2006).
A: C. ischnus, B: J. sarsi, C: O. obesus. Nodes represent substrate types (abbreviations as in Table 1), arrows represent significant differences (P < 0.05), pointing at the larger value.
Numerical results are shown in Tables S3-5.
Figures FIGURE 1
33 FIGURE 2
FIGURE 3
34 FIGURE 4
35 FIGURE 5
36
Supporting Information
How to coexist with the ’killer shrimp’ Dikerogammarus villosus?
Lessons from other invasive Ponto-Caspian peracarids Péter Borza, Thomas Huber, Patrick Leitner, Nadine Remund, Wolfram Graf
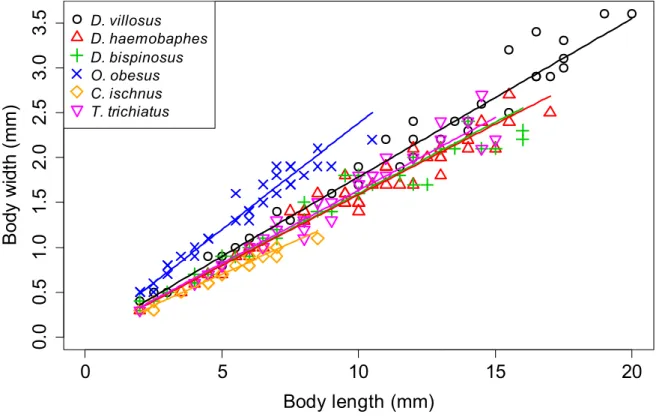
Figure S1 Body length-body width relationships in the studied gammarid species; given only as an illustration of their characteristic morphological differences. The measurements were made by ocular micrometer on specimens collected in several different waters in Hungary (collection of the Danube Research Institute, Budapest, Hungary). The largest specimens measured here do not represent the maximal sizes reported in the literature, but approximate it. While the majority of the included gammarids attain body sizes > 15 mm and differ little in their body proportions, O. obesus and C. ischus grow considerably smaller and deviate from the standard body shape in opposing directions. Note: the characteristic body shape of O.
obesus and C. ischus is also reflected in their scientific names (obesus: fat, plump; ischnus:
thin, lean). The dorsoventrally flattened isopod Jaera sarsi attains 2-3 mm body length and
~0.5 mm body height. The line segments represent the fitted linear models (see Table S1 and S2 for details).
0 5 10 15 20
0.00.51.01.52.02.53.03.5
Body length (mm)
Body width (mm)
D. villosus D. haemobaphes D. bispinosus O. obesus C. ischnus T. trichiatus
37 Table S1 Number of specimens, body length range, and model parameters of the species included in the analysis. A linear model without intercept was fitted on ln-ln transformed data (power function, necessary since standard deviation increased with body length) including all species in R 3.2.5 (R Core Team, 2016). As the species-body length interactions could be neglected, the model contains one parameter for ln-transformed body length (estimated as 0.992 ± 0.012, indicating an approximately linear relationship), and one parameter for each species (included in the table). Adjusted R2 = 0.982.
Species No. of
specimens
Body length range (mm)
Model parameter esimate ± SE Chaetogammarus ischnus 23 2.0-8.5 -1.952 ± 0.025 Dikerogammarus bispinosus 36 2.0-16.0 -1.812 ± 0.027 Dikerogammarus haemobaphes 42 2.0-17.0 -1.822 ± 0.029 Dikerogammarus villosus 38 2.0-20.0 -1.704 ± 0.029 Obesogammarus obesus 32 2.0-10.5 -1.414 ± 0.024 Trichogammarus trichiatus 31 2.0-15.0 -1.791 ± 0.029
Table S2 Pairwise comparisons of the species parameters of the model, calculated by the
‘glht’ function in the ‘multcomp’ package (Hothorn et al., 2008) with Tukey correction. Ci:
Chaetogammarus ischnus, Db: Dikerogammarus bispinosus, Dh: Dikerogammarus haemobaphes, Dv: Dikerogammarus villosus, Oo: Obesogammarus obesus, Tt:
Trichogammarus trichiatus.
Null hypothesis Estimate Std. error t P
Db - Ci = 0 0.140 0.023 6.169 < 0.001
Dh - Ci = 0 0.131 0.023 5.743 < 0.001
Dv - Ci = 0 0.249 0.023 10.641 < 0.001
Oo - Ci = 0 0.538 0.023 23.766 < 0.001
Tt - Ci = 0 0.161 0.024 6.811 < 0.001
Dh - Db = 0 -0.009 0.019 -0.495 0.996
Dv - Db = 0 0.108 0.019 5.567 < 0.001
Oo - Db = 0 0.398 0.021 19.367 < 0.001
Tt - Db = 0 0.021 0.020 1.024 0.908
Dv – Dh = 0 0.118 0.019 6.347 < 0.001
Oo - Dh = 0 0.407 0.020 19.888 < 0.001
Tt - Dh = 0 0.030 0.020 1.535 0.639
Oo - Dv = 0 0.290 0.021 13.748 < 0.001
Tt - Dv = 0 -0.087 0.020 -4.35 < 0.001
Tt - Oo = 0 -0.377 0.021 17.547 < 0.001