1 This manuscript is textually identical with the published paper:
1
Borza P, Huber T, Leitner P, Remund N, Graf W (2018): Niche differentiation among invasive Ponto- 2
Caspian Chelicorophium species (Crustacea, Amphipoda, Corophiidae) by food particle size. Aquatic 3
Ecology 52(2): 179-190. DOI: 10.1007/s10452-018-9653-8 4
The original publication is available at:
5
http://link.springer.com/article/10.1007/s10452-018-9653-8 6
7
Niche differentiation among invasive Ponto-Caspian Chelicorophium species (Crustacea, Amphipoda, 8
Corophiidae) by food particle size 9
10
Péter Borza1,2*, Thomas Huber3, Patrick Leitner3, Nadine Remund4, Wolfram Graf3 11
12
1GINOP Sustainable Ecosystems Group, MTA Centre for Ecological Research, Klebelsberg Kuno utca 13
3, H-8237 Tihany, Hungary 14
2Danube Research Institute, MTA Centre for Ecological Research, Karolina út 29-31, H-1113 15
Budapest, Hungary 16
3Department of Water, Atmosphere & Environment, Institute for Hydrobiology & Water Management, 17
BOKU - University of Natural Resources and Applied Life Sciences, Gregor Mendel Strasse 33, A- 18
1180 Vienna, Austria 19
4Info fauna – CSCF, Passage Maximilien-de-Meuron 6, CH-2000 Neuchâtel, Switzerland 20
* E-mail: borza.peter@okologia.mta.hu, tel: +361-279-3100/306 21
22
Acknowledgements 23
24
Joint Danube Survey 3 was organized by the International Commission for the Protection of the 25
Danube River (ICPDR). We would like to thank everyone involved in the organization, field work, 26
and evaluation of the survey for their effort, and Zsuzsanna Trábert for her assistance during the 27
microscopy. This work was supported by the MARS project (Managing Aquatic ecosystems and water 28
2 Resources under multiple Stress) funded by the European Union under the 7th Framework Programme, 29
grant agreement no: 603378, and the Economic Development and Innovation Operational Programme 30
(GINOP) 2.3.2-15-2016-00019 grant. Péter Borza was supported by the Scholarship of the Scholarship 31
Foundation of the Republic of Austria for Post-docs from October 2013 until March 2014 (funding 32
organization: Österreichischer Austauschdienst GmbH on behalf of and financed by the Scholarship 33
Foundation of the Republic of Austria).
34 35
Abstract 36
37
After Chelicorophium curvispinum, two other Ponto-Caspian tube-dwelling, filter feeding amphipod 38
species (C. robustum and C. sowinskyi) have colonized several catchments in Central and Western 39
Europe in recent decades. To reveal the mechanism of niche differentiation among them, we measured 40
the mesh sizes of their filtering apparatus and analyzed multi-habitat sampling data from the River 41
Danube using RDA-based variance partitioning between environmental and spatial explanatory 42
variables. Morphometric data showed clear differentiation among the species by filter mesh size (C.
43
curvispinum > C. robustum > C. sowinskyi). Field data also indicated the relevance of suspended 44
matter; however, the mere quantity of suspended solids included in the analysis could not explain the 45
abundance patterns effectively. Current velocity, substrate types, and total nitrogen content also had a 46
non-negligible effect; however, their role in the niche differentiation of the species is not evident. In 47
summary, differences in their filter mesh sizes indicate a niche differentiation by food particle size 48
among the invasive Chelicorophium species, allowing their stable coexistence given sufficient size 49
variability in their food source. Consequently, the two recent invaders increase the effectiveness of 50
resource utilization, resulting in a more intensive benthic-pelagic coupling in the colonized 51
ecosystems.
52 53
Keywords 54
55
benthic-pelagic coupling, filter feeding, invasion impact, River Danube, suspended matter 56
3 57
Introduction 58
59
Suspension feeding organisms play a key role in aquatic ecosystems by linking the pelagic and benthic 60
compartments of the food web (Atkinson et al. 2013; Zhang et al. 2016; Griffiths et al. 2017).
61
Accordingly, the establishment of a filter feeding invader can induce profound changes in the 62
functioning of both running and still waters (Sousa et al. 2014), well exemplified by the invasion 63
impact of the Ponto-Caspian dreissenid mussels, implying reduced plankton biomass, increased water 64
clarity favoring benthic algae and macrophytes, cyanobacterial blooms, increased benthic invertebrate 65
biomass, and consequent changes in fish assemblages (Higgins and Vander Zanden 2010).
66
The tube-dwelling euryhaline amphipods of the Ponto-Caspian Chelicorophium genus are also 67
suspension feeders, receiving attention mainly on account of their successful range expansion in 68
several Central and Western European catchments since the early 20th century. Chelicorophium 69
curvispinum (G.O. Sars, 1895), the first species of the genus to arrive in Western Europe (Bij de Vaate 70
et al. 2002) had a dramatic impact on the colonized waters, especially in the eutrophic River Rhine.
71
Here, the species reached extreme high densities in the 1980-90s (Van den Brink et al. 1993), and 72
formed a thick layer of muddy tubes on hard substrates which suffocated adult Dreissena mussels and 73
prevented the settlement of their larvae, resulting in the decline of the population (Van der Velde et al.
74
1994). At the same time, the species became an important food source for fish (Kelleher et al. 1998).
75
Although its abundance had decreased in the Rhine by the 2000s, presumably due to increased 76
predation pressure after the invasion of Dikerogammarus villosus (Sowinsky, 1894) (Van Riel et al.
77
2006), the species continues to be a key member of benthic macroinvertebrate assemblages in most 78
invaded waters (Noordhuis et al. 2009; Hellmann et al. 2015).
79
Recently, two additional representatives of the genus extended their ranges in Central and Western 80
Europe using the Danube-Rhine system. Chelicorophium robustum (G.O. Sars, 1895) – formerly 81
present in the Danube only downstream of the Serbian river section – was recorded in the River Main 82
in 2000 (Bernerth et al. 2005). It colonized the Upper and Middle Danube later by downstream drift 83
(Borza et al. 2015), and recently it was found in the Rhine (Bernauer and Jansen 2006; Altermatt et al.
84
4 2014) as well as in several connected French waterways (Labat et al. 2011). The third species,
85
Chelicorophium sowinskyi (Martynov, 1924) was found in the Middle Danube already in the 1910s 86
(Borza 2011), and recent records confirmed its presence in Austria, Germany, France, and 87
Switzerland, as well (Bernerth and Dorow 2010; Borza et al. 2010; Forcellini 2012; Altermatt et al.
88
2014).
89
Despite their key functional role in aquatic ecosystems, the ecology of the invasive Chelicorophium 90
species has received little scientific attention so far. Consequently, the mechanism of niche 91
differentiation among the three species – informative of how the two recent invaders modify the 92
impact of C. curvispinum – has not been revealed. Benthic filter feeding species usually compete for 93
food or space (Svensson and Marshall 2015). In the former case, niche differentiation is achieved 94
through partitioning of food sources by particle size (e.g. Lesser et al. 1992; Kang et al. 2009), while 95
in the latter case the species show spatial separation along certain environmental factors, such as 96
substrate properties, current velocity, or water depth (e.g. Brönmark and Malmqvist 1982; Jones and 97
Ricciardi 2005). The two factors cannot be separated in all instances; e.g. hydropsychid caddisflies 98
with larger filter mesh sizes tend to occur in microhabitats with stronger currents (Wallace et al. 1977).
99
In the present study we aimed to reveal the mechanism of niche differentiation among the invasive 100
Chelicorophium species by focusing on the two most likely factors. First, we examined whether 101
differences can be observed in the mesh sizes of the filtering apparatus of the three species, suggesting 102
niche differentiation by food particle size. Second, we tested whether certain environmental variables 103
indicate spatial niche differentiation.
104 105
Material and methods 106
107
Morphometric data 108
109
We measured the filter mesh size of the invasive Chelicorophium species on microscopic dissections 110
from specimens collected in the Lower Danube, where all three species occur natively (see ‘Field data’
111
for details on the sampling). Since abundant materials of all three species – allowing the representation 112
5 of their full body size spectrum in both genders – were not available from the same site, we included 113
specimens from a site where the three species were present in similar density (river km 104, Sf.
114
Gheorghe arm of the delta), and supplemented the material from sites where the species were abundant 115
(river km 375 for C. curvispinum and C. robustum, and river km 532 for C. sowinskyi; Table 1).
116
The filter of corophiids is formed by two rows of plumose setae on the anterior margin of the merus of 117
the second gnathopod, where the mesh size is determined by the distance between bristles (Riisgård 118
and Larsen 2010: 275, fig. 25-26). To get a clear view on the medially oriented bristles of the distal 119
(apical) row of setae, we carefully removed the medial (subapical) row of setae using a sharp pin 120
under stereomicroscope. We then mounted the detached limbs on a slide and took digital photographs 121
under light microscope with 100-fold magnification. Since the length of bristles appeared to increase 122
toward the end of the setae and the distances between them increased accordingly, we took pictures of 123
the relatively short and densely arranged basal bristles, the distances of which were assumed to 124
provide a good approximation the filtered particle sizes (the long distal bristles can lean in the current, 125
so the actual distances between them might be smaller). To diminish measurement error, we measured 126
the distance between five bristles, which might imply a slight underestimation of the within-individual 127
variation of filter mesh sizes (presented here as the distance between the centers of two neighboring 128
bristles in μm). We made ten independent (i.e. non-overlapping) measurements on each specimen 129
using the tpsdig 2.22 digital picture analysis software (Rohlf 2015).
130 131
Field data 132
133
The field samples analyzed in the present study were collected during the Joint Danube Survey 3 (13 134
August–26 September 2013) at 55 sites of the river between Ulm (river km 2,581) and the Delta (river 135
km 18, Kiliya branch; Fig. 1) by the ’multi-habitat’ approach based on, but not strictly following the 136
AQEM protocol (Hering et al. 2004). At each site, 4-7 samples (altogether 251) consisting of five 137
pooled units covering 25 x 25 cm bottom area were collected in the littoral zone by hand net (aperture:
138
25 x 25 cm, mesh size: 500 μm), representing all available habitat types (Table 2). All samples were 139
preserved in 4% formaldehyde solution in the field, and stored in 70% ethanol after sorting. Sorting 140
6 was facilitated by fractioning the material on a set of sieves (mesh sizes: 0.5, 2, 5, 10, and 20 mm). In 141
some cases, two to 64-fold subsampling of the smallest one or two fractions was necessary due to the 142
extremely high number of juvenile animals in the samples. Chelicorophium specimens (altogether 143
11,451 individuals) could be identified to species level above ~2 mm body length (9,282 ind.);
144
unidentifiable juveniles were omitted. Depth (range: 0.1-1.2 m) and current velocity (0-0.37 m/s;
145
measured at approx. 5 cm from the bottom using Marsh-McBirney Flo-Mate™ Portable Velocity Flow 146
Meter Model 2000) were recorded for each subsample and averaged separately for each site.
147
Conductivity (9.29-566.00 μS/cm), pH (7.89-8.43), dissolved O2 (5.89-10.42 mg/l), dissolved organic 148
carbon (1.59-7.63 mg/l), total nitrogen (0.52-3.37 mg/l), total phosphorus (0.02-0.11 mg/l), and 149
chlorophyll-a concentration (0.10-18.77 μg/l) were measured at two points per site near the river 150
banks, whereas the concentration suspended matter (‘total suspended solids’, TSS hereafter; 2.5-50.0 151
mg/l) was recorded at one point per site during the survey.
152 153
Statistical analysis 154
155
We modelled filter mesh sizes in two steps. First, for descriptive purposes, we fitted linear mixed- 156
effects models on each species separately, including standard body length (measured between the tip 157
of the rostrum and the tip of the telson), gender, and sampling site as fixed effects, and individuals as a 158
random effect using the ‘nlme’ package (Pinheiro et al. 2016) in R 3.2.5 (R Core Team 2016).
159
Following the recommendations of Zuur et al. (2009), we assessed the fit of the models including all 160
explanatory variables and their interactions using diagnostic figures. We then fitted variance functions, 161
if considerable heteroscedasticity was detected (the choice of the function was based on AIC and BIC 162
scores; the simpler model was preferred in cases of contradiction between the two scores), and after 163
that we omitted non-significant fixed effects step-by-step based on the t-statistic (juveniles were 164
included only if ‘gender’ was omitted). We characterized the optimal models by the parameters as well 165
as the marginal R2 (fixed effects; 𝑅𝐺𝐿𝑀𝑀(𝑚)2 ) and conditional R2 (fixed and random effects; 𝑅𝐺𝐿𝑀𝑀(𝑐)2 ) 166
as defined by Nakagawa and Schielzeth (2013), calculated by the ‘sem.model.fits’ function in the 167
7
’piecewiseSEM’ package (Lefcheck 2016). We interpret among-individual variance (=random effects) 168
as 𝑅𝐺𝐿𝑀𝑀(𝑐)2 − 𝑅𝐺𝐿𝑀𝑀(𝑚)2 , and within-individual (=residual) variance as 1 − 𝑅𝐺𝐿𝑀𝑀(𝑐)2 . 169
Second, to test for interspecific differences, we fitted a linear mixed-effects model on the three 170
species, following the procedure as described for the single-species models. We did not include 171
variables which had proved non-significant in the single-species models..
172
We tested for spatial niche differentiation by variance partitioning between environmental and spatial 173
explanatory variables based on redundancy analysis (RDA), using the ’varpart’ function in the ’vegan’
174
package (Oksanen et al. 2017). We used ln(x+1) and Hellinger-transformed (Legendre and Gallagher 175
2001) count data (individuals per sample) in the analysis, but we show ind./m2 values in the results and 176
in figures for the sake of comparability. We modelled the spatial structure of the study using the 177
asymmetric eigenvector map (AEM) method (Blanchet et al. 2008a; Blanchet et al. 2011) allowing the 178
consideration of directional spatial processes, induced by the currents in our case. Since the locations 179
of the samples within sites were not recorded, we considered only sites, using river km distances (𝑑𝑖𝑗) 180
weighted as 1/𝑑𝑖𝑗 (conforming to Borza et al. 2017a), and replicated the values of the generated 181
spatial variables (AEM eigenfunctions) for all samples within each site. We excluded two sites (8 182
samples) in the two minor arms of the Danube delta (Sulina and Sf. Gheorghe) allowing the one- 183
dimensional representation of the study design including 152 samples from 46 sites (64 samples did 184
not contain Chelicorophium species, and 27 additional samples were omitted due to missing values).
185
We used the eigenfunctions both with positive and negative Moran’s I values (modelling positive and 186
negative spatial autocorrelation, respectively) in the analysis, which was possible due to the fact that 187
we only had 45 (number of sites minus one) AEM eigenfunctions for 152 samples. We performed 188
forward selection (Blanchet et al. 2008b) on the environmental variables with two different adding 189
limits (P = 0.05 and 0.01; using the ‘ordiR2step’ function in the ‘vegan’ package) to provide more 190
insight into their importance, but we used only the wider set of variables (P = 0.05) in variance 191
partitioning. For this, we selected spatial variables with P = 0.05 adding limit, as well, and tested 192
variance partitions of interest by ANOVA with 9999 permutations. We present the effect of the 193
environmental variables based on their biplot scores in the model including both environmental and 194
8 spatial variables. We mapped the environmentally explainable fraction of variance (including the 195
overlap) as well as the only spatially explainable part (without the overlap) by plotting the fitted site 196
scores (= linear constraints; ‘LC’ scores) of the first canonical axis in the corresponding RDA models 197
against river km after Legendre and Legendre (2012).
198 199
Results 200
201
Morphometric data 202
203
The largest mesh sizes were observed in C. curvispinum (6.33-18.35 μm; Fig. 2). The inclusion of 204
body length as a fixed variance weight was supported (Table S1), whereas the effects of ‘gender’, 205
‘sampling site’, and all interaction terms could be neglected (Table S2). Among-individual variance 206
was high and within-individual variation was also considerable, which resulted in a relatively weak 207
but statistically significant body length-dependency (Table 3).
208
The filter mesh size of C. robustum ranged between 4.68 and 13.02 μm, increasing asymptotically 209
with body length (Fig. 2). However, non-linear models did not provide a good fit due to the relatively 210
short saturation interval; therefore, we divided the dataset into two approximately linear parts by 211
maximizing the difference between the slopes of the two segments, which allowed comparability with 212
the other two species. Below 5.5 mm, mesh sizes showed a clear linear increase with body length 213
despite considerable among- and within-individual variation (Table 3), whereas the effects of ‘gender’, 214
‘sampling site’ and the interaction terms were not significant(Table S2). The inclusion of variance 215
functions in the model was not supported (Table S1). Above 5.5 mm, the effect of body length on 216
filter mesh size was not significant (P = 0.152). ‘Gender’ and ‘sampling site’ were not included in the 217
model due to the strongly unbalanced design (only females attained sizes larger than ~ 6 mm, and 218
large specimens were rare at river km 104), and the usage of variance functions was not necessary, 219
either (Table S1). Since fixed effects were not included in the model and among-individual variability 220
was moderate, most of the variation was attributable to within-individual differences (Table 3).
221
9 The filter mesh size of C. sowinskyi was the smallest among the three species, ranging between 2.64 222
and 6.87 μm (Fig. 2). The usage of body length as a fixed weight was supported (Table S1), as 223
variance increased considerably with the size of the animals. Filter mesh size showed a clear linear 224
increase with body length, and the interaction between body length and gender also proved significant 225
(0.28, SE = 0.05; P<0.001), reflecting the fact that males attained smaller body lengths but had a mesh 226
size range similar to females (the effects of ‘sampling site’ and the interaction terms could be 227
neglected; Table S2). However, for the sake of comparability with the other species, we included only 228
body length in the model shown in Table 3, indicating considerable among-individual, but relatively 229
low within-individual variation.
230
To allow a meaningful interspecific comparison of filter mesh sizes in spite of the considerable effect 231
of body length, we excluded specimens of C. robustum larger than 5.5 mm from the model involving 232
all three species. As the effects of ‘gender’, ‘sampling site’ and the interaction terms proved 233
insignificant in the single-species models (the body length-gender interaction was significant but 234
negligible compared to interspecific differences in C. sowinskyi) , they were not included in the initial 235
model. The usage of a stratified variance structure was supported (Table S1; parameters. C.
236
curvispinum: 1.20; C. robustum: 1; C. sowinskyi: 0.38). Body length showed negligible interactions 237
among the species (P = 0.805 for C. curvispinum, P = 0.842 for C. sowinskyi), so interspecific 238
differences in filter mesh size could be interpreted as the differences among the intercepts of the fitted 239
lines (fixed effects), which were estimated 2.86 μm (SE = 0.37; P < 0.001) between C. curvispinum 240
and C. robustum, and 3.52 μm (SE = 0.40; P < 0.001) between C. robustum and C. sowinskyi (Fig. 2).
241 242
Field data 243
244
Three Chelicorophium species were recorded during the survey of which C. curvispinum was the most 245
common, occurring at 51 sites (169 samples) between river km 2,415 and 18 (Fig. 1) with a maximum 246
density of 5,280 ind./m2 (median: 42, interquartile range: 10-208; zeros not included). C. sowinskyi 247
was found between river km 2,415 and 18 during the survey (38 sites, 106 samples); however, it was 248
missing between river km 1,630 and 1,199 (Fig. 1). It reached extreme high densities (54,835 and 249
10 43,904 ind./m2) in two samples taken below the mouth of the River Jantra (river km 532), whereas in 250
other parts of the river its density did not exceed 5,050 ind./m2 (median: 37, interquartile range: 10- 251
112 including the two extreme values). C. robustum was recorded at 37 sites (89 samples) between 252
river km 2,415 and 26 with a notable gap between river km 1,367 and 1,159 (Fig. 1). The highest 253
density of the species was 5,523 ind./m2 (median: 16, interquartile range: 3-64).
254
The forward selection procedure with P = 0.05 adding limit selected TSS, substrate type, current 255
velocity, and total nitrogen concentration of the environmental variables which altogether explained 256
22.7% (df = 13, F = 4.40, P < 0.001) of the total variation, whereas the nineteen selected AEM 257
eigenfunctions accounted for 43.1% (df = 19, F = 7.01, P < 0.001). The overlap between the two 258
variance portions was considerable (16.0%; not testable), hence 6.7% (df = 13, F = 2.35, P < 0.001) 259
and 27.1% (df = 19, F = 4.91, P < 0.001) could be explained exclusively by environmental and spatial 260
variables, respectively. The two variable sets together accounted for 49.7% (df = 32, F = 5.67, P <
261
0.001) of the total variation. With P = 0.01 adding limit, the only selected environmental variable was 262
TSS, explaining 13.3% alone (df = 1, F = 24.14, P < 0.001).
263
The Mantel correlogram (Fig. 3) revealed significant positive spatial autocorrelation in the response 264
variables at fine spatial scales (within sites and in the 0-156 river km distance class), which 265
transitioned into significant negative correlation at intermediate distances (156-779 river km). In the 266
largest distance class (934-1,090 river km) autocorrelation was positive again. The selected 267
environmental variables accounted for most of the autocorrelation; the residuals of the environmental 268
RDA model were significantly correlated only within sites. The inclusion of spatial variables 269
successfully eliminated spatial autocorrelation in all distance classes.
270
The first canonical axis of the RDA (R2 = 0.409, df = 1, F = 152.7, P < 0.001) separated C.
271
curvispinum from C. sowinskyi, placing C. robustum in an intermediate position (Fig. 4). On the 272
second axis (R2 = 0.181, df = 1, F = 67.6, P < 0.001), however, C. robustum differentiated markedly 273
from the other two species. TSS showed the strongest correlation with the first axis among the 274
environmental variables (biplot scores: RDA1: -0.530, RDA2: 0.359), accounting mainly for the 275
separation of C. curvispinum from the other two species. Total nitrogen concentration pointed almost 276
exactly in the same direction as TSS; however, its effect was considerably weaker (RDA1: -0.157, 277
11 RDA2: 0.099). Current velocity (RDA1: -0.188, RDA2: -0.366) was associated mainly with C.
278
robustum, whereas the centroids of substrate types concentrated around the origin of the ordination 279
plane, indicating a relatively weak differentiation among the species in this regard.
280
The environmentally explainable variance fraction concentrated between river km 1,300 and 1,159 as 281
a result of a peak in TSS coinciding with the absence of C. sowinskyi and C. robustum (Fig. 5a). The 282
only spatially explainable part of the variance showed a complex distribution along the river with 283
notable peaks in the Iron Gates section and in the vicinity of the delta (Fig. 5b).
284 285
Discussion 286
287
Our measurements revealed considerable differences in the filter mesh sizes among the invasive 288
Chelicorophium species.. The relationship between filter mesh size and particle capture efficiency is 289
not evident; particles smaller than the mesh size might be retained, especially when the material of the 290
filter is sticky (Shimeta and Jumars 1991). Nevertheless, clearance rate dropped steeply for particles 291
smaller than the mesh size in Corophium volutator (Pallas, 1766) (Møller and Riisgård 2006) in 292
accordance with the particle size distribution of gut contents (Fenchel et al. 1975), suggesting that the 293
primary filtering mechanism in corophiids is sieving (i.e. the mechanical retention of particles larger 294
than mesh size of the filter; Shimeta and Jumars 1991). On the other hand, hydraulic resistance 295
increases with smaller mesh sizes (Cheer and Koehl 1987), implying that less water can be filtered 296
with the same effort; therefore, filters are not efficient at capturing particles considerably larger than 297
the mesh size. Consequently, there is a particle size range for each species where their capture rate is 298
higher than that of the others. Within this range, the species can tolerate a lower resource density than 299
the others, translating into competitive advantage (Chase and Leibold 2003). Nevertheless, a 300
sufficiently wide size distribution of the food particles might allow the coexistence of the species even 301
locally, and spatial heterogeneity in resource availability also might promote their coexistence at the 302
regional scale (Chase and Leibold 2003).
303
Accordingly,the interspecific differences in the filter mesh sizes among the invasive Chelicorophium 304
species revealed in our study indicate niche differentiation by food particle size. Since spatial 305
12 differences were not detected over several hundred river km distances, our results can be considered as 306
representative for the Lower Danube. Nevertheless, we expect that a similar pattern will be found 307
wherever the three species coexist, and considerable differences will be observed only in situations 308
where some of the species are missing, implying release from competitive pressure on the others.
309
Our study identified sources of variation in filter mesh size within the species, as well. The body 310
length dependency of the character was marked in all three species, most likely reflecting ontogenetic 311
changes. However, since repeated measurements on cohorts were not made in our study, alternative 312
explanations (i.e. differences among cohorts) cannot be excluded with full certainty.
Slight
313differences could be observed between genders, too, especially in C. sowinskyi. However,
314these are not likely to have ecological relevance; they might merely reflect the considerable
315sexual dimorphism in body proportions (i.e. males attain smaller standard lengths but have
316larger antennae). The ratio of unexplained variance in the models was also considerable,
317especially among and within the individuals of C. curvispinum, calling for further analyses.
318
Field data indicated the relevance
of suspended matter in the niche differentiation among invasive 319Ponto-Caspian Chelicorophium species; the majority of the environmentally explained variance was 320
attributable to this factor. Nevertheless, since only the overall quantity of suspended matter could be 321
included in the analysis, its role is not trivial. As the morphological differences suggest, considerable 322
explanatory power could be expected only from detailed data on the qualitative composition and size 323
distribution of suspended particles. The effect of TSS was attributable mainly to the coincidence of 324
peak values with the absence of C. robustum and C. sowinskyi in the Serbian river section (Fig. 5a).
325
Since the downstream spread of C. robustum was still in progress at the time of the survey, its absence 326
might not necessarily be the result of environmental factors. On the other hand, unfavorable suspended 327
matter composition in this river section (combined with current velocity and sediment composition;
328
Borza et al. 2015) could explain why the upstream distributional limit of the species used to be here 329
for a long time. Recently, the species has been found at some additional sites in this river section (river 330
km 1,334; Žganec et al., unpublished data); however, it is still early to draw conclusions in this 331
question.
332
13 The distributional gap of C. sowinskyi was not related to any of the environmental factors included in 333
the analysis. However, former data show the eutrophic character of the river section downstream of 334
Budapest (Dokulil and Donabaum 2014), which might provide a historical explanation. The central 335
sewage treatment plant of the city began to operate only in 2010, so the species might not have had the 336
time to respond to the changed conditions at the time of the survey. Its record downstream of the city 337
might be an indication of its incipient spread (Borza et al. 2015).
338
High suspended matter load, however, does not necessarily lead to C. curvispinum dominance; the 339
extreme high density of C. sowinskyi downstream of the River Jantra mouth might be related to the 340
high TSS values in this tributary (125 mg/l during the survey). Unfortunately, TSS was measured at 341
only one point per site in the middle of the channel during the survey, so the connection is not 342
reflected in the data. Nevertheless, the peak densities recorded during the survey are still well below 343
the values recorded in the eutrophic River Rhine shortly after the invasion of C. curvispinum (up 344
to 750,000 ind./m2; Van den Brink et al. 1993). The generally low density values of Chelicorophium 345
species and their strong response to the extra suspended matter load of tributaries suggest strong food 346
limitation in most parts of the Danube at the present time.
347
The explanatory power of the remaining variables was rather low; therefore, our field data do not 348
provide firm evidence for their importance in the niche differentiation of invasive Chelicorophium 349
species. The weak effect of total nitrogen concentration could not be separated from that of TSS, and 350
current velocity as well as substrate types also might be related to food availability, so they might not 351
necessarily represent independent niche axes. On the contrary, we assume that the larger body size of 352
C. robustum might be relevant to the coexistence of the species. In this case, various factors might be 353
potentially involved, including microhabitat use, generation time, predation risk, or interference 354
competition. Nevertheless, these can be expected only to modulate, not to overcome the differentiation 355
by food particle size.
356
In summary, differences in their filter mesh sizes allow a stable coexistence among the three invasive 357
Chelicorophium species, where their abundance is primarily determined by the quantity, quality, and 358
size distribution of suspended matter. Consequently, the joint impact of the three species – as 359
compared to C. curvispinum alone – is a more effective resource utilization, resulting in a stronger 360
14 benthic-pelagic coupling. Inferring from their smaller filter mesh sizes, the impact of the two recent 361
invaders can be expected to be most pronounced if suspended matter is dominated by relatively small 362
(< ~10 μm) food particles. It would be useful to compare invasive and presently non-invasive 363
Chelicorophium species, which could provide insight into the factors of invasion success and allow a 364
more accurate assessment of future invasion risks within the genus (Borza et al. 2017b). Similarly, to 365
obtain a more complete overview about the utilization of suspended matter in the ecosystems 366
concerned, it would be important to study all co-occurring filter feeding species jointly.
367 368
References 369
370
Altermatt F, Alther R, Fišer C, Jokela J, Konec M, Küry D, Mächler E, Stucki P, Westram AM (2014) 371
Diversity and distribution of freshwater amphipod species in Switzerland (Crustacea:
372
Amphipoda). PloS One 9:e110328 373
Atkinson CL, Vaughn CC, Forshay KJ, Cooper JT (2013) Aggregated filter-feeding consumers alter 374
nutrient limitation: consequences for ecosystem and community dynamics. Ecology 94:1359–
375
1369 376
Bernauer D, Jansen W (2006) Recent invasions of alien macroinvertebrates and loss of native species 377
in the upper Rhine River, Germany. Aquat Invasions 1:55–71 378
Bernerth H, Dorow S (2010) Chelicorophium sowinskyi (Crustacea, Amphipoda) ist aus der Donau in 379
den Main vorgedrungen - Anmerkungen zur Verbreitung und Morphologie der Art.
380
Lauterbornia 70:53–71 381
Bernerth H, Tobias W, Stein S (2005) Faunenwandel im Main zwischen 1997 und 2002 am Beispiel 382
des Makrozoobenthos. In: Faunistisch-ökologische Untersuchungen des Forschungsinstitutes 383
Senckenberg im hessischen Main. Hessisches Landesamt für Umwelt und Geologie, 384
Wiesbaden, pp 15–87 385
15 Bij de Vaate A, Jażdżewski K, Ketelaars HAM, Gollasch S, Van der Velde G (2002) Geographical 386
patterns in range extension of Ponto-Caspian macroinvertebrate species in Europe. Can J Fish 387
Aquat Sci 59:1159–1174 388
Blanchet FG, Legendre P, Borcard D (2008a) Modelling directional spatial processes in ecological 389
data. Ecol Model 215:325–336 390
Blanchet FG, Legendre P, Borcard D (2008b) Forward selection of explanatory variables. Ecology 391
89:2623–2632 392
Blanchet FG, Legendre P, Maranger R, Monti D, Pepin P (2011) Modelling the effect of directional 393
spatial ecological processes at different scales. Oecologia 166:357–368 394
Borza P (2011) Revision of invasion history, distributional patterns, and new records of Corophiidae 395
(Crustacea: Amphipoda) in Hungary. Acta Zool Acad Sci Hung 57:75–84 396
Borza P, Csányi B, Huber T, Leitner P, Paunović M, Remund N, Szekeres J, Graf W (2015) 397
Longitudinal distributional patterns of Peracarida (Crustacea, Malacostraca) in the River 398
Danube. Fundam Appl Limnol 187:113–126 399
Borza P, Csányi B, Paunović M (2010) Corophiids (Amphipoda, Corophioidea) of the River Danube 400
The Results of a Longitudinal Survey. Crustaceana 83:839–849 401
Borza P, Huber T, Leitner P, Remund N, Graf W (2017a) Current velocity shapes co-existence 402
patterns among invasive Dikerogammarus species. Freshw Biol 62:317–328 403
Borza P, Huber T, Leitner P, Remund N, Graf W (2017b) Success factors and future prospects of 404
Ponto–Caspian peracarid (Crustacea: Malacostraca) invasions: Is “the worst over”? Biol 405
Invasions 19:1517–1532 406
Brönmark C, Malmqvist B (1982) Resource partitioning between unionid mussels in a Swedish lake 407
outlet. Ecography 5:389–395 408
16 Chase JM, Leibold MA (2003) Ecological niches: linking classical and contemporary approaches.
409
University of Chicago Press, Chicago and London 410
Cheer AYL, Koehl MAR (1987) Paddles and rakes: fluid flow through bristled appendages of small 411
organisms. J Theor Biol 129:17–39 412
Dokulil MT, Donabaum U (2014) Phytoplankton of the Danube river: Composition and long-term 413
dynamics. Acta Zool Bulg Suppl 7:147–152 414
Fenchel T, Kofoed LH, Lappalainen A (1975) Particle size-selection of two deposit feeders: the 415
amphipod Corophium volutator and the prosobranch Hydrobia ulvae. Mar Biol 30:119–128 416
Forcellini M (2012) First record of the Ponto-Caspian invasive crustacean Chelicorophium sowinskyi 417
(Martinov, 1924) (Amphipoda, Corophiidae) in the French Rhône River. Crustaceana 418
85:1781–1785 419
Griffiths JR, Kadin M, Nascimento FJA, Tamelander T, Törnroos A, Bonaglia S, Bonsdorff E, 420
Brüchert V, Gårdmark A, Järnström M, Kotta J, Lindegren M, Nordström MC, Norkko A, 421
Olsson J, Weigel B, Žydelis R, Blenckner T, Niiranen S, Winder M (2017) The importance of 422
benthic-pelagic coupling for marine ecosystem functioning in a changing world. Glob Change 423
Biol 23: 2179–2196 424
Hellmann C, Worischka S, Mehler E, Becker J, Gergs R, Winkelmann C (2015) The trophic function 425
of Dikerogammarus villosus (Sowinsky, 1894) in invaded rivers: a case study in the Elbe and 426
Rhine. Aquat Invasions 10:385–397 427
Hering D, Moog O, Sandin L, Verdonschot PF (2004) Overview and application of the AQEM 428
assessment system. Hydrobiologia 516:1–20 429
Higgins SN, Vander Zanden MJ (2010) What a difference a species makes: a meta–analysis of 430
dreissenid mussel impacts on freshwater ecosystems. Ecol Monogr 80:179–196 431
17 Jones LA, Ricciardi A (2005) Influence of physicochemical factors on the distribution and biomass of 432
invasive mussels (Dreissena polymorpha and Dreissena bugensis) in the St. Lawrence River.
433
Can J Fish Aquat Sci 62:1953–1962 434
Kang C-K, Choy EJ, Hur Y-B, Myeong J-I (2009) Isotopic evidence of particle size-dependent food 435
partitioning in cocultured sea squirt Halocynthia roretzi and Pacific oyster Crassostrea gigas.
436
Aquat Biol 6:289–302 437
Kelleher B, Bergers PJM, Van den Brink FWB, Giller PS, Van der Velde G, Bij de Vaate A (1998) 438
Effects of exotic amphipod invasions on fish diet in the Lower Rhine. Arch Für Hydrobiol 439
143:363–382 440
Labat F, Piscart C, Fontan B (2011) First records, pathways and distributions of four new Ponto- 441
Caspian amphipods in France. Limnologica 41:290–295 442
Lefcheck JS (2016) piecewiseSEM: Piecewise structural equation modelling in r for ecology, 443
evolution, and systematics. Methods Ecol Evol 573–579 444
Legendre P, Gallagher ED (2001) Ecologically meaningful transformations for ordination of species 445
data. Oecologia 129:271–280 446
Legendre P, Legendre LF (2012) Numerical ecology. 3rd English edition. Elsevier, Amsterdam 447
Lesser MP, Shumway SE, Cucci T, Smith J (1992) Impact of fouling organisms on mussel rope 448
culture: interspecific competition for food among suspension-feeding invertebrates. J Exp Mar 449
Biol Ecol 165:91–102 450
Møller LF, Riisgård HU (2006) Filter feeding in the burrowing amphipod Corophium volutator. Mar 451
Ecol Prog Ser 322:213–224 452
Nakagawa S, Schielzeth H (2013) A general and simple method for obtaining R2 from generalized 453
linear mixed-effects models. Methods Ecol Evol 4:133–142 454
18 Noordhuis R, van Schie J, Jaarsma N (2009) Colonization patterns and impacts of the invasive
455
amphipods Chelicorophium curvispinum and Dikerogammarus villosus in the IJsselmeer area, 456
The Netherlands. Biol Invasions 11:2067–2084 457
Oksanen J, Blanchet FG, Kindt R, Legendre P, Minchin PR, O’Hara RB, Simpson GL, Solymos P, 458
Stevens MHH, Wagner H (2017) vegan: Community Ecology Package. R package version 459
2.4-3. http://CRAN.R-project.org/package=vegan 460
Pinheiro J, Bates D, DebRoy S, Sarkar D, R Core Team (2016) nlme: Linear and Nonlinear Mixed 461
Effects Models. R package version 3.1-125, http://CRAN.R-project.org/package=nlme.
462
R Core Team (2016) R: A language and environment for statistical computing. R Foundation for 463
Statistical Computing, Vienna, Austria. URL http://www.R-project.org/
464
Riisgård HU, Larsen PS (2010) Particle capture mechanisms in suspension-feeding invertebrates. Mar 465
Ecol Prog Ser 418:255–293 466
Rohlf FJ (2015) tpsDig, Digitize Landmarks and Outlines, version 2.22. Department of Ecology and 467
Evolution, State University of New York, Stony Brook.
468
Shimeta J, Jumars PA (1991) Physical mechanisms and rates of particle capture by suspension- 469
feeders. Oceanogr Mar Biol - Annu Rev 29:l–257 470
Sousa R, Novais A, Costa R, Strayer DL (2014) Invasive bivalves in fresh waters: impacts from 471
individuals to ecosystems and possible control strategies. Hydrobiologia 735:233–251 472
Svensson JR, Marshall DJ (2015) Limiting resources in sessile systems: food enhances diversity and 473
growth of suspension feeders despite available space. Ecology 96:819–827 474
Van den Brink FWB, Van der Velde G, Bij de Vaate A (1993) Ecological aspects, explosive range 475
extension and impact of a mass invader, Corophium curvispinum Sars, 1895 (Crustacea:
476
Amphipoda), in the Lower Rhine (The Netherlands). Oecologia 93:224–232 477
19 Van der Velde G, Paffen BGP, Van den Brink FWB, Bij de Vaate A, Jenner HA (1994) Decline of 478
zebra mussel populations in the Rhine. Naturwissenschaften 81:32–34 479
Van Riel MC, Van der Velde G, Rajagopal S, Marguillier S, Dehairs F, Bij de Vaate A (2006) Trophic 480
relationships in the Rhine food web during invasion and after establishment of the Ponto- 481
Caspian invader Dikerogammarus villosus. Hydrobiologia 565:39–58 482
Wallace JB, Webster JR, Woodall WR (1977) The role of filter feeders in flowing waters. Arch Für 483
Hydrobiol 79:506–532 484
Zhang X, Liu Z, Jeppesen E, Taylor WD, Rudstam LG (2016) Effects of benthic-feeding common 485
carp and filter-feeding silver carp on benthic-pelagic coupling: implications for shallow lake 486
management. Ecol Eng 88:256–264 487
Zuur AF, Ieno EN, Walker NJ, Saveliev AA, Smith GM (2009) Mixed effects models and extensions 488
in ecology with R, Springer Science and Business Media. New York 489
490
20 Tables
491 492
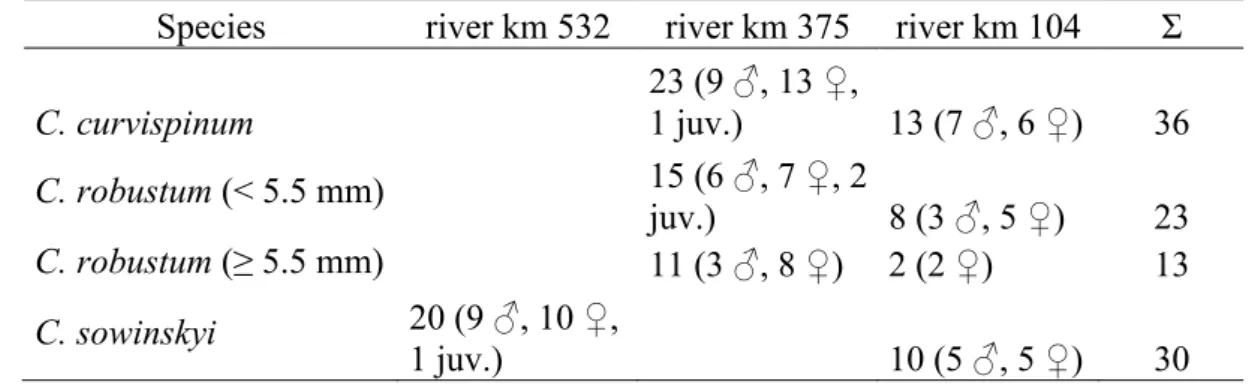
Table 1 Number of specimens involved in the morphometric measurements. C. robustum was divided 493
into two size classes due to the non-linear body length dependence of its filter mesh size (see text) 494
Species river km 532 river km 375 river km 104 Σ
C. curvispinum23 (9 ♂, 13 ♀,
1 juv.) 13 (7 ♂, 6 ♀) 36
C. robustum (< 5.5 mm)15 (6 ♂, 7 ♀, 2
juv.) 8 (3 ♂, 5 ♀) 23
C. robustum (≥ 5.5 mm)
11 (3 ♂, 8 ♀) 2 (2 ♀) 13
C. sowinskyi20 (9 ♂, 10 ♀,
1 juv.) 10 (5 ♂, 5 ♀) 30
495
Table 2 Definitions of substrate types used in the study 496
497
Substrate type Definition
riprap rocks of variable size, artificial
macrolithal blocks, large cobbles; grain size 20 cm to 40 cm mesolithal cobbles; grain size 6 cm to 20 cm
microlithal coarse gravel; grain size 2 cm to 6 cm
akal fine to medium-sized gravel; grain size 0.2 cm to 2 cm psammal sand; grain size 0.063-2 mm
psammopelal sand and mud
pelal mud (organic); grain size < 0.063 mm
argyllal silt, loam, clay (inorganic); grain size < 0.063 mm macrophytes submerged macrophytes, including moss and Characeae xylal tree trunks, dead wood, branches, roots
498
21 Table 3 Parameters and variance components of the single-species linear mixed-effects models
499 500
Species Intercept (μm) Slope (body length)
Body length-dependency (= fixed effects)
Among-individual variation (= random
effects)
Within- individual variation (=
residual)
C. curvispinum
7.51 (SE = 1.42; P <
0.001)
1.02 (SE = 0.40; P = 0.015) 0.15 0.80 0.05
C. robustum (< 5.5 mm)
5.02 (SE = 0.64; P <
0.001)
0.92 (SE = 0.16; P < 0.001) 0.41 0.27 0.32
C. robustum (
≥
5.5 mm)9.90 (SE = 0.08; P <
0.001)
not significant - 0.11 0.89
C. sowinskyi
1.77 (SE = 0.45; P <
0.001)
0.83 (SE = 0.14; P < 0.001) 0.52 0.44 0.04
22 Figure captions
501 502
Fig. 1 Occurrences of Chelicorophium species in the River Danube during Joint Danube Survey 3 503
(multi-habitat samples only). White squares: C. curvispinum, grey circles: C. sowinskyi, black 504
triangles: C. robustum. The dark shaded area corresponds to the River Danube basin. Codes of the 505
riparian countries: DE: Germany, AT: Austria, SK: Slovakia, HU: Hungary, HR: Croatia, RS: Serbia, 506
RO: Romania, BG: Bulgaria, MD: Moldova, UA: Ukraine 507
508
Fig. 2 Filter mesh sizes of Chelicorophium species as a function of body length. Lines represent the 509
fitted values of the single-species linear mixed-effects models 510
511
Fig. 3 Mantel correlograms of the response variables, the residuals of the environmental model (E), 512
and the residuals of the environmental and spatial model (E + S). The distance class at 0 river km 513
corresponds to within-site distances. Solid symbols indicate significant correlations (*: P < 0.05, **: P 514
< 0.01, ***: P < 0.001). Numbers on the top of the graph indicate the number of pairs involved in the 515
calculation of correlations for each distance class. Symbols are connected only to visualize the trends 516
517
Fig. 4 Triplot showing the results of the RDA including both environmental and spatial explanatory 518
variables (‘WA’ scores, species scaling). Cc: C. curvispinum, Cs: C. sowinskyi, Cr: C. robustum.
519
Substrate types: AKA: akal, ARG: argyllal, MAL: macrolithal, MEL: mesolithal, MIL: microlithal, 520
MPH: macrophytes, PEL: pelal, PPE: psammopelal, PSA: psammal, RIP: rip-rap, XYL: xylal. Arrows 521
represent continuous environmental variables (cur: current velocity, tss: total suspended solids, toN:
522
total nitrogen). AEM eigenfunctions are not shown for the sake of perspicuity 523
524
Fig. 5 The distribution of the environmentally (a) and the only spatially (b) explainable part of 525
variance (i.e. the fitted site scores of the first canonical axis in the corresponding RDA models) along 526
the investigated river section. Solid lines represent smoothed splines (function ‘smooth.spline’ in R) 527
23 with a smoothing parameter of 0.5. Total suspended solid (TSS) values are shown in (a) for
528
comparison 529
Figures 530
Fig. 1 531
532
Fig. 2 533
24 534
Fig. 3 535
536
25 Fig. 4
537
538
Fig. 5 539
26 540