1
This manuscript is contextually identical with the following published paper:
1
Kupsch, Denis ; Vendras, Elleni ; Ocampo-Ariza, Carolina ; Batáry, Péter ; Motombi, 2
Francis Njie ; Bobo, Kadiri Serge ; Waltert, Matthias (2019) High critical forest habitat 3
thresholds of native bird communities in Afrotropical agroforestry landscapes. - 4
BIOLOGICAL CONSERVATION 230 pp. 20-28.
5
The original published PDF available in this website:
6
https://www.sciencedirect.com/science/article/abs/pii/S0006320718310929?via%3Dihub 7
8 9 10
High critical forest habitat thresholds of native bird communities in Afrotropical 11
agroforestry landscapes 12
13
Abstract 14
Our knowledge on the nature of forest species responses to deforestation remains ambiguous.
15
Moreover, most previous research took place in fragmented landscapes or did not take into 16
account the diversity of ecological features among the studied species. Understanding the 17
relationship between forest cover and functional guilds inside a bird community may serve as 18
a valuable tool to assess how much forest is necessary to conserve significant portions of 19
forest species. We sampled birds (198 species, 6 883 encounters) along a full gradient of 20
deforestation across 4 000 km² of forest-dominated landscapes in Southwest Cameroon. We 21
applied multivariate adaptive regression splines to model α-, β- and γ-richness of various bird 22
guilds in relation to forest cover. Overall, β- and γ-richness remained constant above 42%
23
forest cover. However, total α-richness as well as all richness partitions of Guinea-Congo 24
biome-restricted, large-bodied arboreal foliage gleaning, tree nesting, and frugivorous species 25
declined when forest cover was below 74%. Moreover, ant-followers and terrestrial 26
insectivores showed their highest diversity at zero deforestation. In contrast, open-land, 27
granivorous, opportunistic insectivorous and widespread species strongly increased below 28
42% forest cover. High β-diversity at intermediate deforestation conditions indicate that the 29
sharp decline of original forest bird diversity may only be compensated by habitat and 30
2
foraging generalists, which benefit from high habitat heterogeneity. Our study implies that 31
Afrotropical forest bird diversity decreases non-linearly with forest loss. Critical habitat 32
thresholds above 70% are much higher than previously reported and highlight the need for 33
conservation measures of large intact forest remnants.
34
35
Keywords: African bird diversity; bird guilds; deforestation; diversity partitioning; forest 36
cover; multivariate adaptive regression splines 37
1. Introduction 38
39
For more than two decades, there has been a debate on how much forest is needed to maintain 40
diversity in a landscape context. In his pioneering review on the effects of woodland cover on 41
bird and mammal species, Andrén (1994) argued for a minimum of 10% to 30% forest cover 42
needed to preserve a substantial portion of original species diversity. In the following years, 43
numerous field studies on various taxa have found support for a critical threshold hypothesis.
44
Whereas several bird (e.g. Cushman and McGarigal, 2003; Radford et al., 2005), invertebrate 45
(e.g. Bergman et al., 2004), and multi-taxa studies (Banks-Leite et al., 2014; Ochoa-Quintero 46
et al., 2015) are in line with Andrén’s proposed threshold range, others suggest a minimum 47
forest cover level of 40% to 50% for amphibians (e.g. Gibbs, 1998), invertebrates (Schmidt 48
and Roland, 2006), birds (e.g. Martensen et al., 2012; Morante-Filho et al., 2015), and 49
mammals (Reunanen et al., 2004). Moreover, some authors have failed to find evidence of 50
non-linear relations between forest cover and species richness or occurrence in birds (e.g.
51
Villard et al., 1999) as well as lizards and birds (Lindenmayer et al., 2005). Besides an 52
undeniable effect of landscape configuration (Fahrig, 2003; Villard et al., 1999), these 53
contradicting results suggest that species’ responses to deforestation are determined by their 54
3
ecological characteristics (Andrén, 1994; Luck and Daily, 2003; Maas et al., 2009). Although 55
many of the before-mentioned studies focused on birds, our knowledge on the response 56
patterns of functional guilds of complete bird communities remains limited. Respective 57
studies are needed to predict ecological consequences related to land-use change and 58
deforestation (Lewis, 2009), which can influence conservation management efforts in forested 59
landscapes (Metzger and Décamps, 1997).
60
Conversion of forests to simplified land-use systems usually leads to changes in bird species 61
composition with altered proportions of functional groups and less specialized bird 62
communities (Harvey and Villalobos, 2007; Maas et al., 2009; Şekercioğlu, 2012). Some 63
groups have been found to persist at high levels of species richness or even increase at 64
intermediate disturbance or forest cover levels, i.e. as nectarivores or frugivores. This is 65
presumably due to high primary productivity and food availability in systems such as 66
agroforests (Gomes et al., 2008; Waltert et al., 2005). Large-bodied and insectivorous species 67
tend to decrease with increasing deforestation rates and get replaced by small-sized and 68
granivorous or omnivorous species that become highly abundant in open agricultural areas 69
(Newbold et al., 2012; Senior et al., 2013).
70
Until today, very little is known about the effects of deforestation and land-use intensification 71
on functional bird diversity in the Guineo-Congolian forest belt. Our study area lies within the 72
heart of the Gulf of Guinea forest, which represents the largest continuous forest block in the 73
biodiversity hotspot West African forests (Oates et al., 2004). In this region, land-use change 74
from a growing human population and from industrial oil palm expansion is imminent (Linder 75
and Palkovitz, 2016). In this study, we aimed to identify potential critical habitat thresholds 76
for various guilds. We applied multivariate adaptive regression splines on bird data collected 77
along a deforestation gradient from 0% to 100% at a local scale. The diversity measures used 78
are based on diversity partitioning (alpha, beta, and gamma richness) as well as a series of 79
4
diversity indices with increasing community weights. We hypothesized that relationships 80
between diversity in bird guilds and forest cover are non-linear. We further hypothesized that 81
critical habitat thresholds would be guild-specific and appear at intermediate deforestation 82
levels for habitat, feeding and foraging generalists and at lower deforestation levels for more 83
specialized forest bird species.
84 85
2. Material and methods 86
87
2.1. Study area 88
The study was conducted inside the Korup region in the Ndian Division of Southwest 89
Cameroon (4°54'N to 5°23'N and 8°44'E to 9°7'E). The altitude varies between 50 and 800 m 90
a.s.l. The average yearly rainfall is 5 272 mm and the average daily temperature ranges from a 91
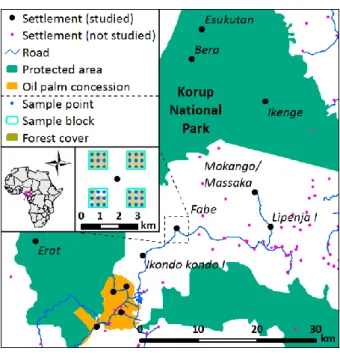
minimum of 22.7 to a maximum of 30.6 °C (Chuyong et al., 2004). The study area (Fig. 1) is 92
part of the largest continuous rainforest block in Western Africa, the Cross-Sanaga-Bioko 93
coastal forests, located within the Gulf of Guinea Biodiversity Hotspot (Oates et al., 2004).
94
The area is sparsely populated, with small villages and agroforests both inside and around the 95
Korup National Park (KNP). For birds, Rodewald et al. (1994) listed 390 species in Korup 96
National Park and its surroundings, of which twelve were considered as endemic montane 97
forest species for the Cross-Sanaga region.One of the few intensified land-use systems in the 98
region, an oil palm plantation estate of PAMOL Plantations Plc., is located at the southern end 99
of KNP, separated from the park by the Mana River. This plantation (5 804 ha) was set up 100
with oil palms (Elaeis guineensis) in 1928.
101
2.2. Bird sampling 102
5
We systematically sampled bird communities around twelve villages, equitably distributed in 103
three different landscapes, namely 1) inside evergreen rainforest in KNP, 2) in the 104
agroforestry landscapes outside the park and 3) in PAMOL. We used the center of each 105
settlement to define the mid point of a grid consisting of nine 1 km × 1 km blocks (Fig. 1). Of 106
these nine blocks, the four extreme corner blocks were sampled, resulting in 48 sampled 107
blocks in twelve sample sites. Since we know from own bird surveys in the region (e.g.
108
Waltert et al., 2005) that nine repeats are sufficient to saturate species accumulation curves 109
and derive reliable richness estimates (Colwell, 2016), we placed nine sample points within 110
each sample block, spaced 333 m each (Fig. 1). Hence, we also complied with the 111
recommended minimum distance between sample points to avoid multiple counting (250 m;
112
Ralph et al., 1995). Therefore, we surveyed a total of 432 sample points across the whole 113
study area.
114
We began bird point count sampling (Ralph et al., 1995) in June and July 2013, and finalized 115
the survey from May to June 2014. In both years, the survey team consisted of one expert 116
ornithologist (FNM) and one assistant (mainly EV and DK). At each sample point we once 117
recorded all seen or heard bird species for a period of ten minutes in the morning (6-11 h) or 118
afternoon (15-18 h). Bird species identification followed Borrow and Demey (2001). To 119
reduce disturbance caused by noises and movements of the survey team, we opened paths to 120
the sample points at least one day before data collection and waited for at least two minutes 121
after the arrival at each point before starting the sample protocol. Only presence-absence data 122
were taken and flyovers, i.e. birds not interacting with the surveyed area, were discarded 123
before analyses.
124 125
2.3. Data analysis 126
6
Following Fotso et al. (2001), Fry et al. (2004), and Waltert et al. (2005), we classified the 127
recorded bird species by feeding guild (carnivorous, frugivorous, granivorous, insectivorous, 128
nectarivorous, and omnivorous), foraging guild (arboreal foliage gleaner, sallyier foliage 129
gleaner, bark gleaner, sallyier, terrestrial and opportunistic miscellaneous insectivore), habitat 130
preference (forest specialists, generalists, and open-land species), nest site affiliation (ground, 131
bush, shrub, and tree breeders), and range size (Guineo-Congolian biome-restricted and non- 132
biome-restricted species). Additionally, we categorized large canopy frugivores (turacos, 133
parrots, and hornbills), ant-followers, which track the raids of army or driver ants of the genus 134
Dorylus to prey on animals flashed by the ants (including occasional ant-followers; Peters and 135
Okalo, 2009; Willis, 1985), and size classes of arboreal foliage gleaners (small, medium, and 136
large) 137
We combined satellite imagery interpretation and ground-truthing to assess forest cover. For 138
this, we searched the NASA archive for the most recent LANDSAT images prior to the field 139
survey in 2013. Since from 2003 on, all images contain stripes, several cloud-free scenes per 140
year were needed to cover the entire study area. Barely cloud contaminated LANDSAT 141
ETM+ images (30 m pixel size) were found for January 2013/December 2012 and November 142
2012/December 2012 for the southern/central and most northern part of our study area, 143
respectively. We created forest cover maps for each sample grid and print them for ground 144
truthing, which we performed with locals from the closest settlements. At every sample site 145
we spent at least four days walking a minimum of 5 km pathways through each 1 km² 146
sampling block to increase the accuracy of forest cover estimates and detect most recent 147
changes due to farm opening. We used GPS devices for field work and processed all maps in 148
ESRI ArcGIS 10.3.
149
We did not estimate detection probably, since neither a distance sampling nor an occupancy 150
modelling approach was followed. Previous work in the region showed that>90% of bird 151
7
observations were of acoustic nature so that results are highly likely unbiased by habitat 152
except from the smaller canopy dwelling nectarivores who seemingly are underrecorded in 153
high forest compared to secondary habitats (Waltert et al., 2005). However, we standardized 154
observer and sampling efforts (see also Methods 2.2) to limit sources of heterogeneity.
155
Therefore, our count statistics were referred to as indices (Yoccoz et al., 2001) and focused 156
our analysis and discussion solely on relative diversity changes. We used two different 157
approaches to dissect the structure of bird communities. First, since previous research pointed 158
out that beta diversity is more consistent between taxa and, therefore, provides a higher 159
indicator value than alpha (or gamma) diversity (Kessler et al., 2009; Schulze et al., 2004), we 160
analyzed the response of within-microhabitat (at sampling points; referring to alpha richness, 161
α), between-microhabitat (beta, β) and within-sampling block (1 km²; gamma, γ) species 162
richness. We followed the additive partitioning method (equation 1; Veech, 2002), which 163
allows straightforward comparison of species assemblage partitions.
164
Eq. (1) 𝛾 = 𝛼 + 𝛽 165
Since alpha is calculated as mean species richness per sample point (Veech, 2002), it also 166
serves as an equivalent to the relative abundance of the sample block and can, therefore, be 167
interpreted as the niche breadth of a focus guild or group. In adddition, richness estimates for 168
γ-richness were done using the classical formula of the first-order Jackknife estimator in 169
EstimateS 9.1 (Colwell, 2016).
170
Second, to assess the effect of community weights and their implication on diversity values 171
within analysed bird groups, we used Shannon (equation 2) and Rényi’s entropy (equation 3) 172
to calculate a series of diversity indices from order one to four (Tóthmérész, 1995):
173
Eq. (2) 𝑥𝑠ℎ = − ∑𝑆𝑖=1𝑝𝑖𝑙𝑛𝑝𝑖 174
Eq. (3) 𝑥𝑟𝑒 = (−𝑙𝑛 ∑𝑆𝑖=1𝑝𝑖𝑞)/(1 − 𝑞) 175
8
where p is the frequency of species i, derived from its relative abundance, and q is the order of 176
the diversity index value x.
177
Since we compared responses of different diversity measures, we converted the indice values 178
into effective numbers (D) of species following Jost (2006; equation 4).
179
Eq. (4) 𝐷 = exp(𝑥) 180
We examined the change of bird diversity along the gradient of forest cover using 181
multivariate adaptive regression splines (MARS) based on linear models (Friedman, 1991) 182
through the earth package in R version 3.4.1 (Milborrow, 2016; R Core Team, 2017). We 183
allowed a maximum number of six terms before pruning. We used cross-validation (with 30 184
cross-validations and five cross-validation folds) as well as classical backward pruning and 185
selected the better fitting model by comparison of the generalized R² value.
186
Finally, we analyzed the response of all recorded bird species to forest cover using 187
redundancy analysis (RDA) through the vegan package in R (Oksanen et al., 2016). The 188
species matrix was constrained using forest cover and Hellinger transformed prior to the 189
analyses, which allows a RDA with species data tables that contain many zeros (Legendre and 190
Gallagher, 2001). F-values and p-values were obtained by permutation tests based on 999 191
permutations.
192
We tested for spatial autocorrelation in model residuals using a spatial correlogram and global 193
Morans’I test for spatial autocorrelation in the ade4 (Dray et al., 2007) and ncf packages 194
(Bjørnstad and Cai, 2018) for R. These packages assesses p-values using randomization.
195
Neither Moran’s I test (ITotal community = -0.101, p = 0.999) nor the correlogram (Fig. S1) of the 196
total community model on observed γ-diversity indicated spatial autocorrelation. At the level 197
of bird guilds and groups, we focused our discussion on the non-autocorrelated models (two 198
out of thirty models showed spatial autocorrelation; Table S1).
199
9 200
3. Results 201
202
We recorded a total of 6,883 bird encounters and 198 bird species along 432 sampling points 203
(Table S2). They belonged to 43 families, with Pycnonotidae (22 species) being the most 204
species-rich family in the study area followed by Sylviidae (13) and Ploceidae (11). All 205
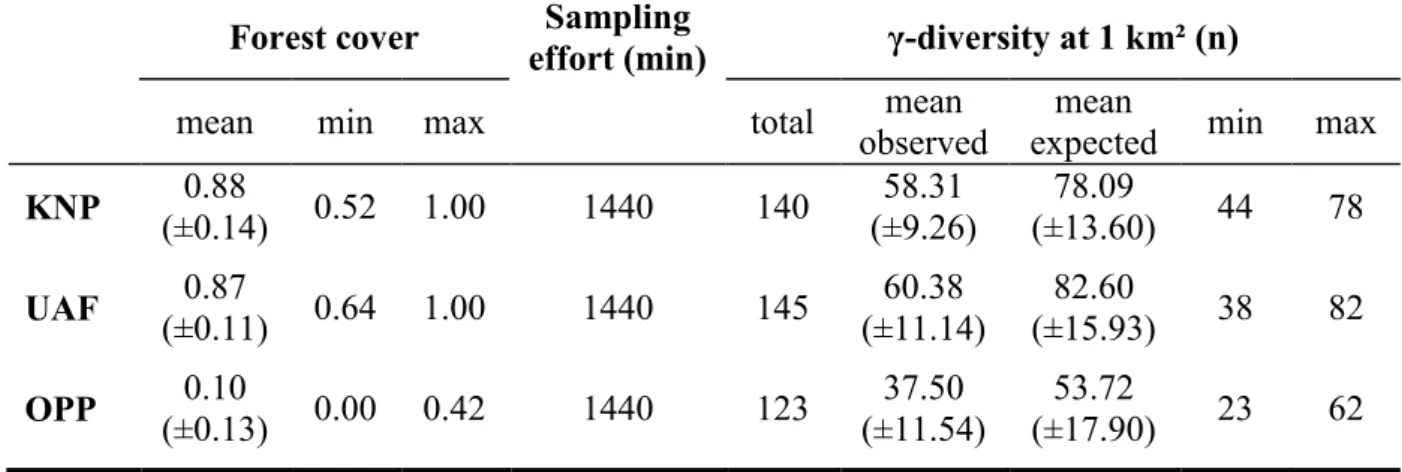
encountered birds could be identified to species level. At sampleblock level (1 km²), we 206
recorded slightly more species in agroforestry matrices outside the national park than inside, 207
whereas species richness in the oil palm plantation was the lowest (Table 1).
208
209
3.1. Bird guild responses to forest cover 210
With the exception of some groups (ground and bush nest builders, carnivorous and 211
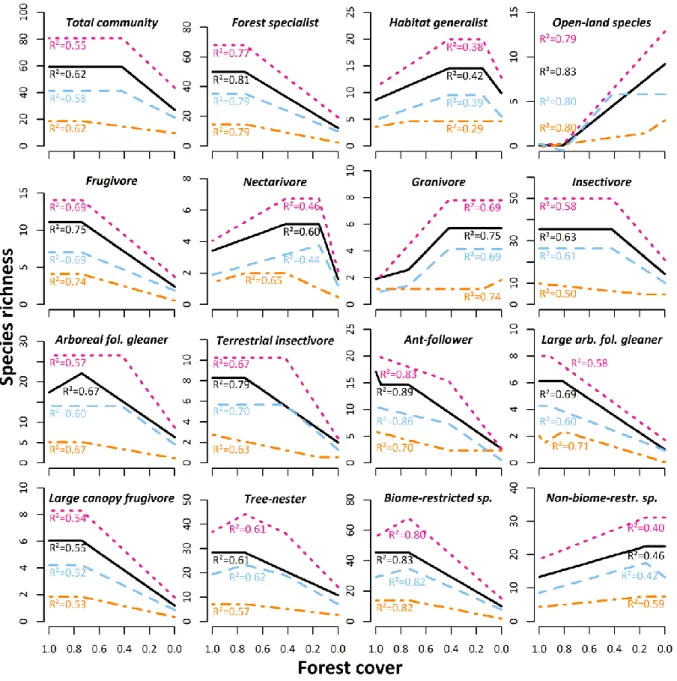
omnivorous feeders, sallier foragers, and bark gleaners), our MARS models obtained high R² 212
values above 0.30 (Fig. 2, 3). Observed and estimated total gamma richness of the total 213
community reached their maxima at 42% of forest cover, remaining stable above. Whereas 214
beta richness, which accounted for almost 70% of the observed species richness across the 215
gradient of forest cover, showed the same pattern, alpha richness only peaked at 74% of forest 216
cover (Fig. 2).
217
Only few bird guilds showed similar responses to that of the entire community (insectivorous 218
feeders, sallier-foliage gleaners, and medium-sized arboreal foliage gleaners). Frugivorous, 219
forest specialists, biome-restricted, and large canopy bird richness indicators, however, 220
reached their maximum at 74% of forest cover. Alpha and gamma richness of large-sized 221
arboreal foliage gleaners increased until 81% of forest cover, whereas its beta component and 222
10
the estimated gamma richness peaked at 92%. The highly specialized group of ant-following 223
birds did not show any threshold response to forest cover. This guild showed the highest 224
values for all diversity components at 100% forest cover. For terrestrial insectivorous, tree- 225
nesting, and arboreal foliage gleaning birds the alpha richness peaked at high forest cover 226
rates, whereas their beta components already formed brinks at 42%. However, the observed 227
gamma richness of these groups also peaked at 74% of forest cover (Fig. 2).
228
At intermediate forest cover, habitat generalists, nectarivores and shrub-nesters showed 229
highest beta and gamma richness at intermediate forest cover rates of 15% to 42%. However, 230
the alpha richness in nectarivorous and shrub-nesting birds peaked at higher forest cover rates, 231
whereas it remained nearly unchanged across the entire gradient in granivores (Fig. 2).
232
Among the different feeding guilds, only granivores were found in high species numbers at 233
low forest cover. Their beta and gamma richness was highest between 0% and 42% forest 234
cover and lower above, whereas their alpha diversity remained low across the entire gradient 235
with a small peak at 0% forest cover (Fig. 2). The response of open-habitat specialists was 236
even more pronounced: all species richness components dropped down to zero at 81% and 237
were highest at 0% forest cover. Only beta richness remained stable at a high level below 42%
238
forest cover. The group of non-biome-restricted species showed a threshold at 15% forest 239
cover, above which all diversity components decreased. The response of miscellaneous 240
insectivorous foragers was more complex. Whereas within- and beta richness decreased 241
across the gradient with thresholds at 42% and 74% of forest cover, observed and estimated 242
gamma richness were lowest at 74% and highest between 0% and 42% of forest cover (Fig.
243
S2).
244 245
3.2. Effects of community weights 246
11
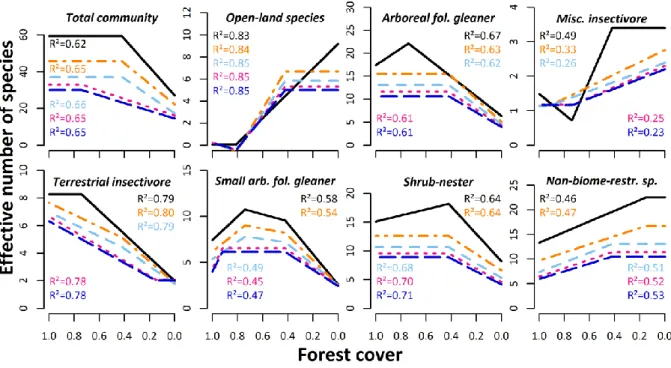
The general pattern of most guild responses to forest did not differ when adding weight to 247
frequent species (Fig. 3 and Fig. S3). Generally, effective numbers decreased with increasing 248
order of the diversity index and, therefore, increases and declines appeared to be less steep.
249
For some groups, such as insectivorous, biome-restricted and non-biome-restricted species, 250
we observed dissimilarities of more than 50% in effective numbers across the gradient 251
between order zero (species richness) and Rényi’s fourth-order entropy. In contrast, some 252
groups did not differ greatly, such as nectarivorous, terrestrial insectivorous, and medium- 253
sized arboreal foliage gleaners. Effective numbers of forest specialist, frugivorous, large 254
canopy, and ant-following species only decreased strongly in highly forested blocks when 255
adding community weights, but remained on a generally low level in open areas (Fig. 3).
256
However, in some groups the thresholds at which species numbers remain stable changed 257
with higher orders of diversity indices. This was the case for the total bird community, the 258
arboreal foliage gleaners and the non-biome-restricted species, where the threshold shifted 259
from lower (15% and 42%) to higher forest cover rates (42% and 74%). When adding 260
community weights, habitat generalists reached a single peak at 42% forest cover and 261
decreased below, while open-land species remained stable below the same threshold instead 262
of showing an increase of species numbers. The more weight we added to frequent species, 263
the more pronounced became the decline and increase of miscellaneous and terrestrial 264
insectivorous bird guilds, respectively, along the gradient of forest cover. Shrub-breeding 265
species numbers peaked at intermediate forest cover in first order but not second to fourth 266
order diversity indices.
267
268
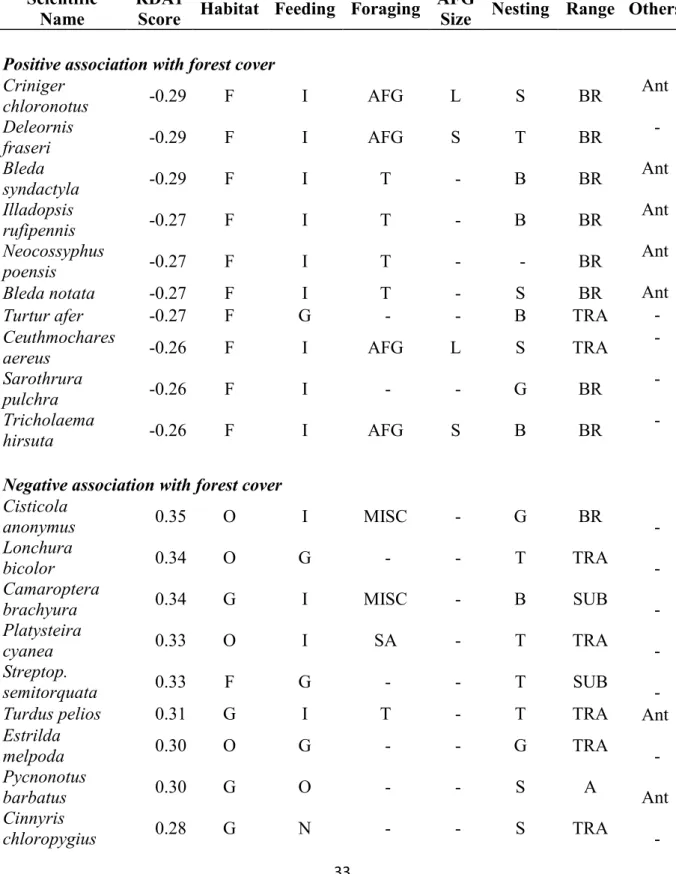
3.3. Species-specific responses to forest cover 269
12
Forest cover explained a significant part of the variance in bird species composition 270
(proportion of constrained inertia = 31.54%; Pseudo-F1,46 = 21.19, p = 0.001) within the 271
redundancy analyses. Bird communities related to high forest cover were dominated by 272
biome-restricted species, which are mainly either arborial foliage gleaners or terrestrial 273
insectivores (Table 2, Fig. S4-S11). We also observed a significant share of ant-following 274
birds in highly forested areas with only a few common species, such as African thrush 275
(Turdus pelios) and common bulbul (Pycnonotus barbatus), remaining in open areas.
276
Widespread, open-land, granivorous, and miscellaneous insectivorous species were mainly 277
negatively associated with forest cover. Species that showed a weak response to forest cover 278
were mainly insectivores with various foraging strategies (Table 2).
279 280
4. Discussion 281
282
4.1. Differential responses to changes in forest cover 283
Our results support previous findings of low species numbers in bird assemblages of highly 284
deforested landscapes (e.g. Andrén, 1994; Martensen et al., 2012; Waltert et al., 2005). Above 285
42% forest cover, overall gamma richness remained stable, but species composition changed 286
strongly along the gradient of forest cover.
287
The response pattern to deforestation of insectivore gamma richness was congruent with that 288
of the entire bird community, though showing a more pronounced decline below 42% forest 289
coverage. Low tree, bush, and liana density and diversity under intensified land-use have 290
presumably reduced bark and foliage gleaners’ richness; instead, opportunistic miscellaneous 291
insectivores were more prominent. Though small- and medium-sized foliage gleaners also 292
showed diversity declines below 74% remaining forest cover, large foliage gleaner were 293
13
affected the most, already decreasing at 81%. This might be attributed to greater energy 294
requirements that might not be met due to bottom-up effects of reduced or changed resource 295
availability (Senior et al., 2013). Among the group of insectivorous birds, terrestrial foragers 296
were most sensitive to deforestation. While beta richness started declining below 74% forest 297
cover, alpha species diversity as well as diversity indices under community weight even 298
indicate a steady decline without any threshold. Warmer microclimate due to lower canopy 299
cover as well as lacking leaf litter might change the ground arthropod fauna and, therefore, 300
negatively affect the foraging opportunities of terrestrial insectivores (Waltert et al., 2005).
301
Ant-following birds also showed a severe and steady decline in alpha, beta as well as gamma 302
richness along the entire gradient of deforestation. Only few of the recorded 26 ant-following 303
bird species are omnivorous (Andropadus latirostris, Baeopogon indicator, Pycnonotus 304
barbatus, Thescelocichla leucopleura), whereas most are highly specialized and depend on 305
the occurrence of army ant raids. Those specialists are believed to be among the first to 306
disappear in altered tropical rainforest environments (Peters et al., 2008). Various studies 307
documented the higher-order effects of fragmented forests associated with the rapid loss of 308
specialized ant-following birds (e.g. Peters and Okalo, 2009; Turner, 1996). In small forest 309
fragments in Western Kenya, the decline of highly specialized ant-followers was associated 310
with changes in army ant composition. Although overall army ant abundances remained 311
stable, the forest-dependent army ant species, Dorylus wilverthii, declined along with forest 312
fragment size, whereas Dorylus molestus increased (Peters and Okalo, 2009). The latter is a 313
generalist found in various habitats from forest to dry bushland (Gotwald, 1995). However, its 314
diurnal activity strongly depends on humidity, ceasing when conditions are too dry (Willis, 315
1985), which has in turn a negative effect on the foraging success of ant-following birds.
316
Although the ecological mechanisms behind the decline of ant-followers under deforestation 317
14
regimes in West Africa are not yet studied, Peters and Okalo’s (2009) findings underline the 318
importance of high forest cover for the conservation of this highly sensitive bird guild.
319
Thirteen granivorous bird species were recorded throughout the study area with increasing 320
richness from forested to open areas. Whereas the granivorous blue-headed wood dove 321
(Turtur brehmeri) seemed to be a characteristic species for natural forests, six other species 322
were recorded exclusively in deforested areas. In line with previous studies (Clough et al., 323
2009; Şekercioğlu, 2012; Waltert et al., 2005), diversity in granivores was highest at low 324
forest coverage attributed to higher food availability due to the increased abundance and 325
diversity of herbs and grasses under open conditions (Waltert et al., 2005).
326
Also, nectar-feeding birds seem to thrive with some deforestation. In previous studies, 327
nectarivores often showed highest species richness in moderately human-modified landscapes 328
(e.g. Schulze et al., 2004; Şekercioğlu, 2012), but low diversity in highly deforested and 329
homogeneous land-use systems, such as oil palm plantations (Clough et al., 2009; Tscharntke 330
et al., 2008). In addition, higher species richness in nectarivores was found not to be related to 331
their abundance, which seems to decrease more pronouncedly with increasing habitat 332
modification (Newbold et al., 2013; Waltert et al., 2004). This is in line with our results, 333
which show highest gamma richness between 15-42%, whereas relative abundance was 334
highest above 42%. On the one hand, hump-shaped richness patterns of nectarivores might be 335
explained by higher productivity and greater food resources in agroforestry matrices 336
(Şekercioğlu, 2012; Tscharntke et al., 2008). On the other hand, it might also be attributed to 337
sampling limitations: canopy nectarivores are very difficult to detect in natural forests due to 338
small sizes and thin vocalizations. Presence-absence data of nectarivores might therefore be 339
biased towards human-modified landscapes and conclusions on conservation management 340
implications should be drawn with caution (Waltert et al., 2005).
341
15
In accordance with previous studies (e.g. Gomes et al., 2008; Martensen et al., 2012), 342
diversity values of frugivorous birds showed a pronounced response to deforestation, with a 343
sharp decrease below 74% of forest cover. Compared to forests, structurally diverse 344
agroforestry systems may retain a similiar frugivore species richness and up to 75% of 345
frugivore abundance (Harvey and Villalobos, 2007). However, the composition of frugivorous 346
assemblages also depends on floristic characteristics (Luck and Daily, 2003) as well as on the 347
proximity of natural rainforest (Moran and Catterall, 2014). Presumably due to low resource 348
availability, frugivores may not sustain in highly deforested areas (Senior et al., 2013). This 349
particularly accounts for large canopy frugivores, which are known to depend on large forest 350
remnants (Galetti et al., 2013). Apart from the semi-granivorous grey parrot (Psittacus 351
erithacus), which used to regularly feed on oil palm nuts in plantation areas, this group was 352
nearly absent in sample blocks with less than 42% of remaining forest cover. Yet, large 353
canopy frugivores are of special conservation concern, since they are important long-distance 354
dispersers of large seeds, while being prone to poaching (Galetti et al., 2013).
355
Ground-nesting birds seem to benefit marginally from the open nature of industrial 356
agricultural systems, which might be due to the limited presence of mammal predators 357
(unpubl. data, DK). Bush-breeders, on the other hand, show an opposite, albeit weak, 358
response, with slightly higher alpha and gamma richness above 42% and 74% of forest cover, 359
respectively. Presumably due to more heterogeneous and abundant nesting sites, some 360
infrequent shrub-breeding species profited from half-open habitats, whereas tree-nesting bird 361
richness naturally depends on high forest cover. Also the proportion of species with unknown 362
breeding ecology was higher in forested areas, which reflects the need for more research on 363
the ecology of forest-dependent birds.
364
The most distinct differences we observed between forested and open areas were in regard to 365
biogeographic distribution of the recorded bird species. Whereas Guineo-Congolian biome- 366
16
restricted species clearly dominated the bird assemblages in highly forested blocks, their alpha 367
and gamma richness strongly declined below 74% forest cover. On the contrary, widespread 368
species, such as Senegal coucal (Centropus senegalensis), barn swallow (Hirundo rustica) or 369
black kite (Milvus migrans), showed highest richness in deforested landscapes below 15%
370
forest cover. In addition, also within the non-biome-restricted species group, we found 371
differential responses to forest cover related to distribution; whereas beta and gamma richness 372
of species bound to the African tropics dropped below 15% forest cover. The rest of the group 373
(cosmopolitans and species distributed in Africa, sub-Saharan Africa as well as the Old 374
World) showed highest abundance and diversity in fully deforested blocks (Fig. S3). This 375
highlights that landscapes under high land-use intensity and environmental homogenization 376
are not only prone to biotic simplification (Maas et al., 2009), but also to alienation of species 377
assemblages, even if closely borded by natural habitat.
378
For some studied bird groups we could not detect clear response patterns: Whereas omnivores 379
might have indeed the ability to adapt to habitat changes due to feeding plasticity, the graphs 380
of aerial feeders and carnivores are presumably artifacts. Due to their prolonged foraging 381
flights, they are more likely to be recorded in open sampling conditions, independently from 382
their abundance or richness.
383
4.2. Bird species composition at intermediate deforestation 384
According to the intermediate disturbance hypothesis, which predicts maximum local species 385
richness at intermediate disturbance levels (Gomes et al., 2008; Horn, 1975), we expected to 386
find highest diversity values in areas with intermediate forest coverage. However, we only 387
observed this pattern in a few bird guilds, such as the small-sized arboreal foliage gleaners 388
and the shrub-nesting species, for which gamma richness peaked around 42% to 74% of forest 389
cover. In addition, in many groups the proportion of beta richness tended to be higher at 390
intermediate levels of forest cover as e.g. in arboreal foliage gleaners, terrestrial insectivores 391
17
and biome-restricted species, indicating higher species turnover rates due to greater habitat 392
heterogeneity, even if the landscape is human-modified (Andrén, 1994, Tscharndtke et al., 393
2012). Presumably, for the same reason alpha and gamma richness of most guilds including 394
the total bird community already showed a threshold at 42% of forest cover, albeit not 395
forming any peak at this level. It seems instead that the landscape mosaic at intermediate 396
forest cover provides a wider range of different habitat types, whereas highly forested areas 397
maintain the capacity to harbor a large species pool due to manifold niche diversification 398
(Martensen et al., 2012). Species richness in forest specialists remained high above a level of 399
74% but dropped by one third already at 42% of forest cover. This loss could only be 400
compensated by an increase of generalists and open-land specialists, which benefit from non- 401
forest habitat structures. Another contribution to constantly high total species richness at 402
intermediate forest levels could be caused by an edge effect. As the study took place within 403
the large continuous forest block in and around KNP, most sample blocks of intermediate 404
forest cover were located in the immediate vicinity of (near-)primary forest. Spill-over of 405
birds and/or their prey from the surrounding mature forest might have contributed to the high 406
species richness in the agroforestry matrices (Lucey and Hill, 2012; Pardini et al., 2010).
407
408
4.3. Critical forest thresholds in tropical bird conservation 409
Although several studies already documented changes in bird diversity along a gradient of 410
habitat modification (e.g. Maas et al., 2009; Şekercioğlu, 2012) or forest cover (e.g.
411
Martensen et al., 2012; Radford et al., 2005) in various settings, our study is the first to 412
illustrate how the rate of forest cover affects functional bird diversity in an African forest- 413
dominated landscape. In general, the response pattern to deforestation found for gamma 414
richness is in line with previous references of minimum habitat requirements of 40-50% cover 415
to preserve bird diversity (Banks-Leite et al., 2014; Martensen et al., 2012; Morante-Filho et 416
18
al., 2015; Ochoa-Quintero et al., 2015), though still higher than the 10-30% initially proposed 417
by Andrén (1994). However, it might be misleading to solely base conservation management 418
strategies on diversity values of the overall bird community, since that might mask important 419
changes in species composition, and might therefore not address conservation needs of 420
ecological bird groups of particular conservation concern (Batáry et al., 2011; Maas et al., 421
2009; Morante-Filho et al., 2015). If a fully forested sampling block would be cleared down 422
to a minimum habitat threshold of about 40% as indicated by the response of the bird 423
community as a whole, the bird assemblage would lose more than 30% of the frugivorous, 424
large canopy, and biome-restricted species as well as 40% of the terrestrial insectivores, large 425
foliage gleaners and ant-followers. In addition, granivorous, opportunistic miscellaneous 426
insectivorous, and wide-spread species would immigrate, leading to richness increases of 427
more than 250%, 150% and 200%, respectively. Such a dramatic deviation from a natural bird 428
species composition might have profound and cascading effects on ecosystem processes and 429
services (Banks-Leite et al., 2014). For instance, highly specialized native insectivores may 430
hardly be replaceable by other more generalist taxa in regard to natural pest-control 431
(Şekercioğlu et al., 2004). Also, the decline of nectarivores and frugivores, including large 432
canopy species, which serve as important pollinators and (long-distance) seed dispersers 433
(Luck and Daily, 2003; Moran and Catterall, 2014; Şekercioğlu, 2012), may have severe 434
impacts on the reproduction of some plants species and, therefore, on the floral species 435
richness and composition (Clough et al., 2009; Galetti et al., 2013). Consequently, in order to 436
maintain a bird community functionally similar to the original one, the preservation of a 437
minimum of 70% of forest cover may be needed. Such a critical habitat threshold reflects 438
those of the most specialized forest bird groups and allows for higher-order diversity indices 439
of the overall bird community. Additionally, this would also preserve a substantial proportion 440
of the highly sensitive groups of terrestrial insectivores and ant-followers.
441
19
Besides bird species richness alone may already serve as a comparable good indicator for 442
overall species richness (Gardner et al., 2008), we have a good knowledge on the ecology of 443
this species groups, including niches used. Therefore, bird guild analyses may help to explain 444
functional diversity of an ecological system and diversity changes in bird guilds should be 445
seriously taken into account for conservation efforts. We provide the first analysis of bird 446
diversity responses to forest cover loss based on data from continuous mature forest, which is 447
only interrupted by loosely scattered settlements and their associated productive land. Such 448
productive land can already hold forest cover rates above 70% (see also Table 1) because it 449
consists of a heterogeneous matrix of primary and secondary forests as well as 450
compartmentalized farmland with shade trees. On the one hand, the Korup region can, 451
therefore, serve as a model to illustrate responses of an original Afrotropical forest bird 452
assemblage to changes in forest cover. On the other hand, these circumstances form the basis 453
to align forest conservation with sustainable development efforts in the West African forest 454
region. While sustaining the well-established network of protected areas (Harvey and 455
Villalobos, 2007; Marsden et al., 2006), conservation and development schemes are well- 456
advised to strengthen smallholder farming (Uezo et al. 2008) instead of industrial plantation 457
agriculture to meet nutritional and economic needs (Linder and Palkovitz 2016).
458 459
Acknowlegdements 460
We thank Awor Daniel, Motale Trevor, Betobe Nelson, Ngoe Blessed and Nganga Lionel for 461
essential field assistance, Carina Laudemann for technical assistance, and the Korup 462
Rainforest Conservation Society (KRCS) for logistic support. Research and fieldwork 463
permissions were provided by the Ministries of Research and Scientific Innovation 464
(MINRESI) as well as Forestry and Wildlife (MINFOF), the village councils, Korup National 465
Park administration and the management of PAMOL Plantations Plc.
466
20 467
Role of the funding sources 468
The authors of this study were financially supported by the Heinrich-Böll Foundation 469
(P103707), the Volkswagen Foundation (I/86136), the German Research Foundation (DFG 470
BA 4438/1-2) and the Economic Development and Innovation Operational Programme of 471
Hungary (GINOP–2.3.2–15–2016–00019). The funding sources had no role in the study 472
design; in the collection, analysis and interpretation of data; in the writing of the report; or in 473
the decision to submit the article for publication.
474
Conflict of interests 475
The authors declare no financial or other conflict of interests.
476
21 References
477
Andrén, H., 1994. Effects of habitat fragmentation on birds and mammals in landscapes with 478
different proportions of suitable habitat: a review. Oikos 71, 355-366.
479
Banks-Leite, C., Pardini, R., Tambosi, L.R., Pearse, W.D., Bueno, A.A., Bruscagin, R.T., 480
Condez, T.H., Dixo, M., Igari, A.T., Martensen, A.C., Metzger, J.P., 2014. Using ecological 481
thresholds to evaluate the costs and benefits of set-asides in a biodiversity hotspot. Science 482
345, 1041-1045.
483
Batáry, P., Fischer, J., Báldi, A., Crist, T.O., Tscharntke, T., 2011. Does habitat heterogeneity 484
increase farmland biodiversity? Frontiers in Ecology and the Environment 9, 152–153.
485
Bergman, K.-O., Askling, J., Ekberg, O., Ignell, H., Wahlman, H., Milberg, P., 2004.
486
Landscape effects on butterfly assemblages in an agricultural region. Ecography 27, 619-628.
487
Bjørnstad, O.N., Cai, J., 2018. ncf: Spatial Covariance Functions. version 1.2-5. https://cran.r- 488
project.org/web/packages/ncf (assessed 09.07.2018).
489
Bobo, K.S., Waltert, M., Fermon, H., Njokagbor, J., Mühlenberg, M., 2006. From Forest to 490
Farmland: Butterfly Diversity and Habitat Associations Along a Gradient of Forest 491
Conversion in Southwestern Cameroon. J. Insect Conserv. 10, 29–42.
492
Borrow, N., Demey, R., 2001. The birds of Western Africa. Christopher Helm, London, UK.
493
Chuyong, G.B., Condit, R., Kenfack, D., Losos, E.C., Moses, S.N., Songwe, N.C., Thomas, 494
D.W., 2004. Korup Forest Dynamics Plot, Cameroon, in: Losos, E.C., Leigh Jr., E.G. (Eds.), 495
Tropical forest diversity and dynamism: Findings from a large-scale plot network. University 496
of Chicago Press, Illinois, pp. 506–516.
497
22
Clough, Y., Dwi Putra, D., Pitopang, R., Tscharntke, T., 2009. Local and landscape factors 498
determine functional bird diversity in Indonesian cacao agroforestry. Biol. Conserv. 142, 499
1032–1041.
500
Colwell, R.K., 2016. EstimateS: Statistical estimation of species richness and shared species 501
from samples. Version 9.1. http://purl.oclc.org/estimates (assessed 02.02.2017).
502
Cushman, S.A., McGarigal, K., 2003. Landscape-level patterns of avian diversity in the 503
Oregon coast range. Ecol. Monogr. 73, 259-281.
504
Dray, S. and Dufour, A.B., 2007. The ade4 package: implementing the duality diagram for 505
ecologists. J. Stat. Softw. 22, 1-20.
506
Fahrig, L., 2003. Effects of Habitat Fragmentation on Biodiversity. Annu. Rev. Ecol. Evol.
507
Syst. 34, 487-515.
508
Fotso, R., Dowsett-Lemaire, F., Dowsett, R.J., Club, C.O., Scholte, P., Languy, M., Bowden, 509
C., 2001. Cameroon, in Fishpool, L.D.C, Evans, M.I. (Eds.), Important Bird Areas in Africa 510
and associated islands: Priority sites for conservation. Pisces Publications and BirdLife 511
International, Cambridge, pp. 133–160.
512
Friedman, J.H., 1991. Multivariate adaptive regression splines. Ann. Stat. 19, 1-67.
513
Fry, C., Keith, S., Newman, K., Urban, E., 2004. The Birds of Africa. London Academic 514
Press, London, UK.
515
Galetti, M., Guevara, R., Côrtes, M.C., Fadini, R., Von Matter, S., Leite, A.B., Labecca, F., 516
Ribeiro, T., Carvalho, C.S., Collevatti, R.G., Pires, M.M., Guimarães Jr., P.R., Brancation, 517
P.H., Ribeiro, M.C., Jordano, P., 2013. Functional Extinction of Birds Drives Rapid 518
Evolutionary Changes in Seed Size. Science 340, 1086-1089.
519
23
Gardner, T.A., Barlow, J., Araujo, I.S., Avila-Pires, T.C.S. et al., 2008. The cost-effectiveness 520
of biodiversity surveys in tropical forests. Ecol Lett 11, 139-150.
521
Gibbs, J.P., 1998. Distribution of woodland amphibians along a forest fragmentation gradient.
522
Landsc. Ecol. 13, 263-268.
523
Gomes, L.G., Oostra, V., Nijman, V., Cleef, A.M., Kappelle, M., 2008. Tolerance of 524
frugivorous birds to habitat disturbance in a tropical cloud forest. Biol. Conserv. 141, 860–
525
871.
526
Gotwald, W.H.J., 1995. Army ants: the biology of social predation. Cornell University Press, 527
New York.
528
Harvey, C.A., Villalobos, J.A.G., 2007. Agroforestry systems conserve species-rich but 529
modified assemblages of tropical birds and bats. Biodiv. Conserv. 16, 2257–2292.
530
Horn, H.S., 1975. Ecology and evolution of communities, in Cody, M.L., Diamond, J.M.
531
(Eds.) Belknap Press, Cambridge, MA, pp. 196-211.
532
Jost, L. 2006. Entropy and diversity. Oikos 113, 363-375.
533
Kessler, M., Abrahamczyk, S., Bos, M., Buchori, D., Putra, D.D., Gradstein, S.R., Höhn, P., 534
Kluge, J., Orend, F., Pitopang, R., Saleh, S., Schulze, C.H., Sporn, S.G., Steffan-Dewenter, I., 535
Tjitrosoedirdjo, S.S., Tscharntke, T., 2009. Alpha and beta diversity of plants and animals 536
along a tropical land-use gradient. Ecol. Appl. 19, 2142–2156.
537
Legendre, P., Gallagher, E.D., 2001. Ecologically meaningful transformations for ordination 538
of species data. Oecologia 129, 271–280.
539
Lewis, O.T., 2009. Biodiversity change and ecosystem function in tropical forests. Basic 540
Appl. Ecol. 10, 97–102.
541
24
Lindenmayer, D.B., Fischer J., Cunningham R.B., 2005. Native vegetation cover thresholds 542
associated with species responses. Biol. Conserv. 124, 311-316.
543
Linder, J.M., Palkovitz, R.E., 2016. The Threat of Industrial Oil Palm Expansion to Primates 544
and Their Habitats, in Waller, M.T. (Ed.), Ethnoprimatology: primate conservation in the 21st 545
century. Springer, Berlin, Germany, pp. 21-45.
546
Lucey, J.M., Hill, J.K., 2012. Spillover of insects from rain forest into adjacent oil palm 547
plantations. Biotropica 44, 368–377.
548
Luck, G.W., Daily, G.C., 2003. Tropical countryside bird assemblages: richness, composition, 549
and foraging differ by landscape context. Ecol. Appl. 13, 235-247.
550
Maas, B., Putra, D.D., Waltert, M., Clough, Y., Tscharntke, T., Schulze, C.H., 2009. Six years 551
of habitat modification in a tropical rainforest margin of Indonesia do not affect bird diversity 552
but endemic forest species. Biol. conserv. 142, 2665–2671.
553
Marsden, S.J., Symes, C.T., Mack, A.L. 2006. The response of a New Guinean avifauna to 554
conversion of forest to small-scale agriculture. Ibis 148, 629-640.
555
Martensen, A.C., Ribeiro, M.C., Banks-Leite, C., Prado, P.I., Metzger, J.P. 2012.
556
Associations of forest cover, fragment area, and connectivity with Neotropical understorey 557
bird species richness and abundance. Conserv. Biol. 26, 1100-1111.
558
Metzger, J.-P., Décamps, H., 1997. The structural connectivity threshold: an hypothesis in 559
conservation biology at the landscape scale. Acta Oecol. 18, 1-12.
560
Milborrow, S., 2017. earth: Multivariate Adaptive Regression Splines. Derived from 561
mda:mars by Trevor Hastie and Rob Tibshirani. Uses Alan Miller's Fortran utilities with 562
Thomas Lumley's leaps wrapper. version 4.5.1. http://CRAN.R-project.org/package=earth/
563
(assessed 02.08.2017).
564
25
Moran, C., Catterall, C.P., 2014. Responses of Seed-Dispersing Birds to Amount of 565
Rainforest in Landscape around Fragments. Conserv. Biol. 28, 551:560.
566
Morante-Filho, J.C., Faria, D., Mariano-Neto, E., Rhodes, J., 2015. Birds in anthropogenic 567
landscapes: the responses of ecological groups to forest loss in the Brazilian Atlantic forest.
568
PLoS ONE 10, e0128923.
569
Newbold, T., Scharlemann, J.P.W., Butchart, S.H.M., Şekercioğlu, Ç.H., Alkemade, R., 570
Booth, H., Purves, D.W., 2013. Ecological traits affect the response of tropical forest bird 571
species to land-use intensity. Proc. R. Soc. Lond., B 280, 20122131.
572
Oates, J.F., Bergl, R.A., Linder, J.M., 2004. Africa’s Gulf of Guinea forests: Biodiversity 573
patterns and conservation priorities. Center for Applied Biodiversity Science, Conservation 574
International.
575
Ochoa-Quintero, J.M., Gardner, T.A., Rosa, I., Barros Ferraz, S.F., Sutherland, W.J., 2015.
576
Thresholds of species loss in Amazonian deforestation frontier landscapes. Conserv. Biol. 29, 577
440-451.
578
Oksanen, J., Guillaume Blanchet, F., Friendly, M., Kindt, R., Legendre, P., McGlinn, D., 579
Minchin, P.R., O'Hara, R.B., Simpson, G.L., Solymos, P., Stevens, M.H.H., Szoecs, E., 580
Wagner, H., 2017. vegan: Community Ecology Package. version 2.4-3. http://CRAN.R- 581
project.org/package=vegan (assessed 05.07.2017).
582
Oliveira-Filho, F.J.B., Metzger, J.P., 2006. Thresholds in landscape structure for three 583
common deforestation patterns in the Brazilian Amazon. Landsc. Ecol. 21, 1061–1073.
584
Pardini, R., de Arruda Bueno, A., Gardner, T.A., Prado, P.I., Metzger, J.P., 2010. Beyond the 585
Fragmentation Threshold Hypothesis: Regime Shifts in Biodiversity Across Fragmented 586
Landscapes. PLoS ONE 5, e13666.
587
26
Peters, M.K., Likare, S., Kraemer, M., 2008. Effects of habitat fragmentation and degradation 588
on flocks of African ant-following birds. Ecol. Appl. 18, 847-858.
589
Peters, M.K., Okalo, B., 2009. Severe declines of ant-following birds in African rainforest 590
fragments are facilitated by a subtle change in army ant communities. Biol. Conserv. 142, 591
2050–2058.
592
R Core Team, 2017. R: A language and environment for statistical computing. Version 3.4.1.
593
R Foundation for Statistical Computing, Vienna, Austria. https://www.R-project.org/
594
(assessed 01.07.2017).
595
Radford JQ, Bennett AF, Cheers GJ (2005). Landscape level thresholds of habitat cover for 596
woodland-dependent birds. Biol. Conserv. 124, 317–337.
597
Ralph, C.J., Droege, S., Sauer, J.R., 1995. Managing and monitoring birds using point counts:
598
standards and applications, in: Ralph, C.J., Droege, S., Sauer, J.R. (Eds.), Monitoring bird 599
populations by point counts, General Technical Report PSW-GTR-149, USDA Forest 600
Service, Albany, pp. 161–169.
601
Reunanen, P., Mönkkönen, M., Nikula, A., Hurme, E., Nivala, V., 2004. Assessing landscape 602
thresholds for the Siberian flying squirrel. Ecol. Bull. 51, 277-286.
603
Rodewald, P.G., Dejaifve, P.-A., Green, A.A., 1994. The birds of Korup National Park and 604
Korup Project Area, Southwest Province, Cameroon. Bird Cons. Int. 4, 1–68.
605
Schmidt, B.C., Roland, J., 2006. Moth Diversity in a Fragmented Habitat: Importance of 606
Functional Groups and Landscape Scale in the Boreal Forest. Ann. Entomol. Soc. Am. 99, 607
1110-1120.
608
Schulze, C.H., Waltert, M., Kessler, P.J., Pitopang, R., Veddeler, D., Mühlenberg, M., 609
Gradstein, S.R., Leuschner, C., Steffan-Dewenter, I., Tscharntke, T., 2004. Biodiversity 610
27
indicator groups of tropical land-use systems: comparing plants, birds and insects. Ecol. Appl.
611
14, 1321–1333.
612
Şekercioğlu, Ç.H., Daily, G.C., Ehrlich, P.R., 2004. Ecosystem consequences of bird declines.
613
Proc. Natl. Acad. Sci. U.S.A. 101, 18042-18047.
614
Şekercioğlu, Ç.H., 2012. Bird functional diversity and ecosystem services in tropical forests, 615
agroforests and agricultural areas. J. Ornithol. 153, 153–161.
616
Senior, M.J.M., Hamer, K.C., Bottrell, S., Edwards, D.P., Fayle, T.M., Lucey, J.M., Mayhew, 617
P.J., Newton, R., Peh, K.S.-H., Seldon, F.H., Stewart, C., Styring, A.R., Thom, M.D.F., 618
Woodcock, P., Hill, J.K., 2013. Trait-dependent declines of species following conversion of 619
rain forest to oil palm plantations. Biodiv. Conserv. 22, 253–268.
620
Tóthmérész, B., 1995. Comparison of different methods for diversity ordering. Journal of 621
vegetation Science 6, 283-290.
622
Tscharntke, T., Şekercioğlu, Ç.H., Dietsch, T.V., Sodhi, N.S., Hoehn, P., Tylianakis, J.M., 623
2008. Landscape constraints on functional diversity of birds and insects in tropical 624
agroecosystems. Ecology 89, 944–951.
625
Tscharntke, T., Tylianakis, J.M., Rand, T.A., Didham, R.K., Fahrig, L., Batáry, P., Bengtsson, 626
J., Clough, Y., Crist, T.O., Dormann, C.F., Ewers, R.W., Fründ, J., Holt, R.D., Holzschuh, A., 627
Klein, A.M., Kleijn, D., Kremen, C., Landis, D.A., Laurance, W., Lindenmayer, D., Scherber, 628
C., Sodhi, N., Steffan-Dewenter, I., Thies, C., van der Putten, W.H., Westphal, C., 2012.
629
Landscape moderation of biodiversity patterns and processes - eight hypotheses. Biological 630
Reviews 87, 661-685.
631
Turner, I., 1996. Species loss in fragments of tropical rain forest: a review of the evidence. J.
632
Appl. Ecol. 33, 200–209.
633
28
Uezo, A., Beyer, D.D., Metzger, J.P., 2008. Can agroforest woodlots work as stepping stones 634
for birds in the Atlantic forest region? Biodiv. Conserv. 17, 1907-1922.
635
Veech, J.A., Summerville, K.S., Crist, T.O., Gering, J.C., 2002. The additive partitioning of 636
species diversity: recent revival of an old idea. Oikos 99, 3–9.
637
Villard, M.-A., Trzcinski, M.K., Merriam, G., 1999. Fragmentation effects on forest birds:
638
Relativ influence of woodland cover and configuration on landscape occupancy. Conserv.
639
Biol. 13, 774-783.
640
Waltert, M., Bobo, K.S., Sainge, N.M., Fermon, H., Mühlenberg, M., 2005. From forest to 641
farmland: habitat effects on Afrotropical forest bird diversity. Ecol. Appl. 15, 1351–1366.
642
Waltert, M., Mardiastuti, A., Mühlenberg, M., 2004. Effects of land use on bird species 643
richness in Sulawesi, Indonesia. Conserv. Biol. 18, 1339–1346.
644
Willis, E.O., 1985. East African Turdidae as safari ant-followers. Le Gerfaut 75:140–153.
645
Institut royal des sciences naturelles de Belgique.
646
Yoccoz, N.G., Nichols, J.D., Boulinier, T., 2001. Monitoring of biological diversity in space 647
and timeTREE 16, 446-453.
648 649
29 650
651
Fig. 1. Map of the study area in Southwest Cameroon and an illustration of the study design at 652
settlement level.(here: Fabe village).
653
30 654
Fig. 2. Response patterns of within-microhabitat (alpha; orange dot-dashed line), between- 655
microhabitat (beta; skyblue dashed line), observed (black solid line) and estimated within-block 656
(gamma; pink dotted line) species richness to changes in forest cover in most studied bird groups (see 657
Fig. S1 for the remaining groups) corresponding to the best-fitting MARS models; richness estimates 658
are based on the classical first-order Jackknife estimator.
659 660
31 661
Fig. 3. Response patterns of observed within-block (gamma) species richness (black solid line), 662
Shannon (orange dot-dashed line) as well as Rényi’s second-order (skyblue dashed line), third-order 663
(pink dotted line) and fourth-order entropy (blue coarse-dashed line) species richness to changes in 664
forest cover in some studied bird groups (see Fig. S3 for the remaining groups) corresponding to the 665
best-fitting MARS models; all diversity indices are expressed in effective numbers (see Jost 2006).
666 667 668
32
Table 1. Summary of forest cover and species richness figures as well as sampling effort at sampling 669 block level (1 km²) in the three survey landscapes; means are presented with SD; richness estimates 670 are based on the classical first-order Jackknife estimator; KNP – Korup National Park, UAF – 671 unprotected agroforestry matrix; OPP – oil palm plantation.
672
Forest cover Sampling
effort (min) γ-diversity at 1 km² (n)
mean min max total mean
observed
mean
expected min max
KNP 0.88
(±0.14) 0.52 1.00 1440 140 58.31
(±9.26) 78.09
(±13.60) 44 78
UAF 0.87
(±0.11) 0.64 1.00 1440 145 60.38 (±11.14)
82.60
(±15.93) 38 82
OPP 0.10
(±0.13) 0.00 0.42 1440 123 37.50 (±11.54)
53.72
(±17.90) 23 62 673
674