Does Overall Diet in Midlife Predict Future Aging Phenotypes? A Cohort Study
Tasnime Akbaraly, PhD,a,b,cSéverine Sabia, PhD,a,dGareth Hagger-Johnson, PhD,aAdam G. Tabak, MD,a,e
Martin J. Shipley, MSc,aMarkus Jokela, PhD,a,f,gEric J. Brunner, PhD,a Mark Hamer, PhD,a G. David Batty, PhD,a,h Archana Singh-Manoux, PhD,a,dMika Kivimaki, PhDa
aDepartment of Epidemiology and Public Health, University College London, London, UK;bInserm, U1061 Montpellier, F-34093 France;cUniversité Montpellier I, Montpellier, F-34000, France;dInserm U 1018, Assistance Publique-Hopitaux de Paris, France;
e1st Department of Medicine, Semmelweis, University Faculty of Medicine, Budapest, Hungary;fInstitute of Behavioral Sciences, University of Helsinki, Finland;gFinnish Institute of Occupational Health, Helsinki, Finland;hMRC Centre for Cognitive Ageing and Cognitive Epidemiology, University of Edinburgh, UK.
ABSTRACT
BACKGROUND:The impact of diet on specific age-related diseases has been studied extensively, but few investigations have adopted a more holistic approach to determine the association of diet with overall health at older ages. We examined whether diet, assessed in midlife, using dietary patterns and adherence to the Alternative Healthy Eating Index (AHEI), is associated with aging phenotypes, identified after a mean 16-year follow-up.
METHODS:Data were drawn from the Whitehall II cohort study of 5350 adults (age 51.3⫾5.3 years, 29.4%
women). Diet was assessed at baseline (1991-1993). Mortality, chronic diseases, and functioning were ascertained from hospital data, register linkage, and screenings every 5 years and were used to create 5 outcomes at follow-up: ideal aging (free of chronic conditions and high performance in physical, mental, and cognitive functioning tests; 4%), nonfatal cardiovascular event (7.3%), cardiovascular death (2.8%), noncardiovascular death (12.7%), and normal aging (73.2%).
RESULTS: Low adherence to the AHEI was associated with an increased risk of cardiovascular and noncardiovascular death. In addition, participants with a “Western-type” diet (characterized by high intakes of fried and sweet food, processed food and red meat, refined grains, and high-fat dairy products) had lower odds of ideal aging (odds ratio for top vs bottom tertile: 0.58; 95% confidence interval, 0.36-0.94;P⫽.02), independently of other health behaviors.
CONCLUSIONS:By considering healthy aging as a composite of cardiovascular, metabolic, musculoskel- etal, respiratory, mental, and cognitive function, the present study offers a new perspective on the impact of diet on aging phenotypes.
© 2013 Elsevier Inc. • The American Journal of Medicine (2013) 126, 411-419
KEYWORDS: Aging; Cognitive functioning; Dietary patterns; Diet quality indices; Mortality; Nutritional epidemi- ology; Overall diet; Physical functioning
Funding:The Whitehall II study is supported by grants from the British Medical Research Council (MRC) G8802774; the British Heart Foundation; the British Health and Safety Executive; the British Department of Health; the Na- tional Heart, Lung, and Blood Institute (R01HL036310); the National Institute on Aging, National Institutes of Health (R01AG013196 and R01AG034454); and the Agency for Health Care Policy and Research (grant HS06516). MK is supported by an ESRC professorship; TNA was supported by the Languedoc-Roussillon Region (Chercheur d’avenir Grant 2011). The funders had no role in study design, data collection and analysis, decision to publish, or preparation of the manuscript.
Conflict of Interest:None.
Authorship:TNA, SS, GHJ, AGT, MJS, MJ, EJB, MH, GDB, ASM, MK designed research, TNA and MK conducted research. TNA analyzed data or performed statistical analysis; TNA and MK drafted the manu- script; TNA had primary responsibility for final content and SS, GHJ, AGT, MJS, MJ, EJB, MH, DB, ASM, MK made a critical revision of the manuscript for important intellectual content.
Requests for reprints should be addressed to Tasnime Akbaraly, PhD, Inserm U 1061, Hôpital La Colombière, 39 avenue Charles Flahault, BP 34493, 34093 Montpellier cedex 05, France.
E-mail address:tasnime.akbaraly@inserm.fr
0002-9343 © 2013 Elsevier Inc.
http://dx.doi.org/10.1016/j.amjmed.2012.10.028
Open access under CC BY license.
Open access under CC BY license.
In recent years, the impact of diet on age-related health outcomes has been investigated increasingly. Some studies have assessed diet using eating patterns derived through factor analyses without any “a priori” hypothesis.1 The findings have shown a protective impact of “Prudent,”
“Mediterranean type,” and
“Whole Food” diet against type 2 diabetes,2 cardiovascular dis- eases,3,4 and depressive symp- toms.5 Other studies have used validated diet quality indices based on existing knowledge on
“healthy eating,”1 such as the Mediterranean diet score.6Adher- ence to this score has been asso- ciated with lower overall mortal- ity, lower mortality from cancer and cardiovascular disease, and lower incidence of neurodegen- erative diseases.7,8
The Alternative Healthy Eating Index (AHEI) is a validated index of diet quality, originally designed to provide dietary guidelines with
the specific intention to combat major chronic conditions such as cardiovascular diseases.9This index is a particularly relevant target for research on age-related morbidity. High scores on the AHEI have been shown to be associated with reduced risk of cardiovascular diseases9and type 2 diabe- tes10in a US population. Findings from the British White- hall II study11 suggest that adherence to the AHEI also is related to an almost 2-fold higher odds of reversing the metabolic syndrome, a condition known to be a strong predictor of cardiovascular morbidity and mortality.12
In addition to examining diet as a modifiable determinant of age-related diseases, there is a need to consider aging as a process consisting of multiple health components. Identi- fying predictors of exceptional health in old age, for exam- ple, may provide new insights into optimal levels of established risk and protective factors. These might not necessarily be the same as those suggested in clinical guide- lines for specific diseases (eg, coronary heart disease); re- search on ideal aging may inform new thresholds and tar- gets for intervention. In terms of diet, a more holistic view on aging would complement the traditional approach and help identify dietary factors that not only prevent morbidity and mortality but also promote ideal aging (also referred to as “exceptionally healthy aging” or “successful aging”), which encompasses good functioning across different phys- ical, mental, and cognitive domains.
In the present study, we therefore sought to assess the influence of diet measured in midlife by considering both adherence to healthy eating patterns and the AHEI recom- mendations, on a range of aging phenotypes assessed over a 16-year follow-up in a large British population of men and women.
METHODS
Study Population
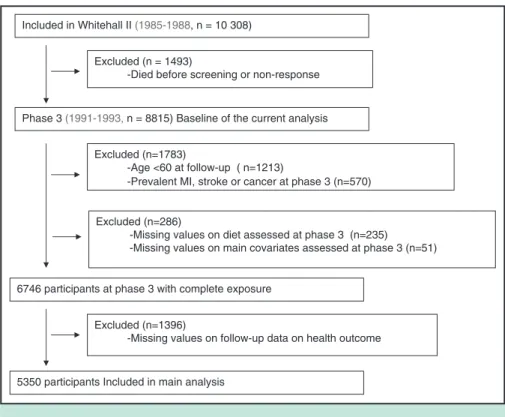
Participants in the Whitehall II study were London-based office staff, aged 35-55 years, who worked in 20 civil service departments at study in- ception.13 Baseline screening (phase 1: 1985-1988, n⫽10,308) comprised a clinical examination and a self-administered question- naire. Subsequent phases of data collection alternated between a clinical examination alongside a questionnaire survey and a postal questionnaire alone. Phase 3 (1991-1993, n⫽8815) is consid- ered the baseline for the purpose of this study because it represents the first assessment of dietary in- takes. The target population of the present study comprised all partic- ipants at least 60 years of age by the end of follow-up (Phase 9:
2007-2009) and with no history of stroke, myocardial infarction, or cancer at Phase 3 (n⫽7032). The University College London Ethics Com- mittee approved the study. After the participants were given a complete description of the study, written informed con- sent was obtained from all participants.
As described in the flow chart diagram (Figure), the analytic sample consisted of 5350 participants aged 60 years or older at the final follow-up, with complete data on diet and main covariates at phase 3 and aging phenotype at phase 9.
Dietary Assessment
At phase 3, participants were invited to fill a semi-quanti- tative food-frequency questionnaire containing 127 food items.14,15 The selected frequency category for each food item was converted to a daily intake. Nutrient intakes were computed by multiplication of the consumption frequency for each food by its nutrient content (for specified portions), and then the nutrient contributions from all foods were summed. Consumption frequency for multivitamin supple- ments also was collected. Nutrient values were calculated with the use of a computerized system developed for the Whitehall II dietary data. The validity and reliability of this version of the food-frequency questionnaire in terms of nutrient and food consumption have been documented in detail both in our cohort and in another independent UK cohort.15,16
Outcome Ascertainment
Five aging outcomes were considered: 1) ideal aging, 2) nonfatal cardiovascular disease at follow-up, 3) cardiovas- cular death, and 4) noncardiovascular death. Those who did
CLINICAL SIGNIFICANCE
● Data from British adults suggest that avoidance of a diet comprising fried and sweet food, processed and red meat, refined grains, and high-fat dairy prod- ucts is associated with a higher chance of achieving older ages disease-free and highly functional.
● Adherence to dietary recommendations provided by the Alternative Healthy Eat- ing Index is associated with reduced risk of premature death.
not belong to any of those categories were considered as the 5) natural (or normal) aging group. These health outcomes were ascertained from 3 follow-up screenings (Phase 5:
1997-1999; Phase 7: 2002-2004; and Phase 9: 2008-2009) plus records from national health registers.
Assessment of Nonfatal Cardiovascular Disease. Coro- nary heart disease status was based on clinically verified events and included myocardial infarction and definite an- gina. Nonfatal myocardial infarction was defined by using the World Health Organization Multinational Monitoring of Trends and Determinants in Cardiovascular Disease (MONICA) Project criteria17and ascertained by using data from Whitehall II study resting electrocardiograms (ECGs) and hospital records of ECGs and cardiac enzyme levels obtained during acute myocardial infarction.18Definite an- gina was identified by a questionnaire19and corroborated by medical records or abnormal results on resting ECG, exer- cise ECG, or coronary angiography. Stroke was assessed using a self-reported measure of physician diagnosis.
Assessment of Cardiovascular Death and Noncardiovas- cular Death. Follow-up for mortality was performed through the national mortality register kept by the National Health Services Central Registry, using the National Health Services identification number assigned to each British cit- izen. The International Classification of Diseases, Ninth Revision (ICD-9), and 10th Revision (ICD-10) codes were used to define cardiovascular disease (ICD-9 390.0-458.9, ICD-10 I00-I99) mortality. Noncardiovascular disease mor-
tality included all remaining deaths not classified as cardio- vascular disease.
Criteria for ideal aging at age 60 years or over at the last follow-up (Phase 9) were:20
● Being alive.
● Absence of chronic diseases, such as coronary heart dis- eases, stroke, cancer (assessed using national cancer reg- istry), and diabetes, which was determined by self-report of doctor diagnosis, use of antidiabetic medication, or oral glucose tolerance test (a fasting glucose ⱖ7.0 mmol/L, a 2-hour postload glucose ⱖ11.1 mmol/L).21
● Absence of mental health problems (defined by a score
⬎42 in the mental health scale of the Short Form General Health Survey.20,22
● Good cardiometabolic, respiratory, musculoskeletal, and cognitive functioning: cardiometabolic functioning was assessed by: 1) age- and sex-standardized systolic blood pressure (average of 2 measurements in sitting position after 5 minutes of rest with the Omron HEM-907; Omron Healthcare Inc., Palatine, Ill) below the median at Phase 9, irrespective of antihypertensive medication use and 2) age- and sex-standardized fasting glucose; respiratory functioning consisted of above median age- and sex- standardized scores in forced expiratory volume in 1 second/height squared (FEV1/height2 in L/m2) at Phase 9;23 musculoskeletal functioningwas assessed by above median age- and sex-standardized scores in walking speed over a clearly marked 8-foot walking course) at Phase 9;24 good cognitive functioning was defined as
Included in Whitehall II (1985-1988, n = 10 308)
Phase 3 (1991-1993,n = 8815) Baseline of the current analysis Excluded (n = 1493)
-Died before screening or non-response
Excluded (n=1783)
-Age <60 at follow-up ( n=1213)
-Prevalent MI, stroke or cancer at phase 3 (n=570)
5350 participants Included in main analysis Excluded (n=1396)
-Missing values on follow-up data on health outcome Excluded (n=286)
-Missing values on diet assessed at phase 3 (n=235)
-Missing values on main covariates assessed at phase 3 (n=51)
6746 participants at phase 3 with complete exposure
Figure Flow chart of sample selection of the 5350 Whitehall II participants.
above median age- and sex-standardized cognitive score built from 5 cognitive tests at Phase 925chosen to provide a comprehensive assessment of cognitive function, which were: the Alice Heim 4-I, composed of 65 verbal and mathematical reasoning items of increasing difficulty;26 short-term verbal memory test (a 20-word free recall); 2 tests of verbal fluency (phonemic assessed via “S” words and semantic assessed via “animal” words);27 and the Mill Hill Vocabulary test, consisting of a list of 33 stim- ulus words ordered by increasing difficulty and 6 re- sponse choices.28All functional measures were measured by a trained study nurse using standard protocols.
Covariates
Smoking (non/former/current) and physical activity were assessed at Phase 3. Physical activity was assessed based on responses to questions on the frequency and duration of participation in mildly energetic (eg, weeding, general housework, bicycle repair), moderately energetic (eg, danc- ing, cycling, leisurely swimming), and vigorous physical activity (eg, running, hard swimming, playing squash). Par- ticipants were then classified as active (⬎2.5 h/week of moderate physical activity or⬎1 h/week of vigorous phys- ical activity), inactive (⬍1 h/week of moderate physical activity and ⬍1 h/week of vigorous physical activity), or moderately active (if not active or inactive).29
Statistical Analysis
Dietary patterns were identified by performing principal component analysis of the 37 predefined food categories grouping the 127 food-frequency questionnaire items as detailed elsewhere.5The factors were rotated by an orthog- onal transformation (Varimax rotation function in SAS;
SAS Institute, Cary, NC) to achieve a simple structure, allowing greater interpretability. Two dietary patterns were identified using multiple criteria: the diagram of Eigenval- ues, the Scree plot, the interpretability of the factors, and the percentage of variance explained by the factors. The factor score for each pattern was calculated by summing intakes of all food groups weighted by their factor loadings. As de- tailed in Appendix Table 1 (online), the first pattern had high loading of items indicating intake of vegetables, fruits, and fish, labeled the “healthy-foods” dietary pattern. The second pattern, labeled “Western-type” diet, had high load- ings of items indicating high consumption of fried food, processed and red meat, pies, sweetened desserts, choco- lates, refined grains, high-fat dairy products, and condi- ments. Each participant received a factor score for both patterns. From the distribution of these factor scores, par- ticipants were categorized into tertiles for each pattern: the Tertile 1 group included participants with a factor score below the 33rd percentile, the Tertile 2 group included participants with a factor score in the 33th-66th percentile range and the Tertile 3 group included those with a factor score above the 66thpercentile.
The AHEI9was scored on the basis of the intake levels of 9 components (Appendix Table 2, online): vegetables;
fruits; nuts and soy; ratio of white meat (seafood and poul- try) to red meat; total fiber; trans fat; ratio of polyunsatu- rated fat to saturated fat; long-term multivitamin use (ⱖ5 vs⬍5 years); and alcohol consumption. Each component had the potential to contribute 0-10 points to the total score, with the exception of multivitamin use, which contributed either 2.5 or 7.5 points (Appendix Table 2, online). All the component scores were summed to obtain a total AHEI score ranging from 2.5 to 87.5; higher scores corresponded to a healthier diet.
Characteristics of men and women according to the 4 aging outcomes and the normal aging category were com- pared using chi-squared test for categorical covariates and analysis of variance for quantitative covariates.
Logistic regression models were used to assess the asso- ciation between dietary variables and each dichotomous aging outcome: ideal health, nonfatal cardiovascular disease (those who died from cardiovascular diseases were ex- cluded from this analysis), cardiovascular death (the non- cases included participants with no cardiovascular death over the follow-up but who may have had nonfatal cardio- vascular diseases), and noncardiovascular death. Dietary variables consisted of dietary patterns (the “healthy-foods”
and the “Western-type” diet) and the AHEI score, all of which were first categorized into tertiles (the lowest tertile used as the reference) to assess the association of the dietary variables with the 4 outcomes. These analyses were re- peated using dietary variables as continuous standardized z-scores (mean⫽0, standard deviation [SD]⫽1), with odds ratios expressed per 1-SD increment in the dietary variable.
Analyses were adjusted successively for age, sex, total en- ergy intake (Model 1), and health behavior: smoking and physical activity (Model 2).
In a sensitivity analysis, we performed multinomial lo- gistic regression to analyze associations between the 2 di- etary patterns, AHEI score, and a 5-category outcome (ie, ideal aging, nonfatal cardiovascular disease, cardiovascular death, noncardiovascular death, normal aging) to test whether competing risk might have biased the findings obtained from separate logistic regression models; the nat- ural aging category represented the noncase group.
All analyses were conducted using SAS software, ver- sion 9.
RESULTS
A total of 3775 (70.6%) men and 1575 (29.4%) women with baseline mean age 51.3 (SD 5.3) years were included. Com- pared with participants excluded (n⫽1682), those included were less likely to be women (P⬍.0001), older (P⫽.002), and were more likely to have a higher AHEI score (P⫽.02); no significant difference was found for dietary patterns between these 2 groups. Of the 5350 participants at follow-up, 4% met the ideal aging, 12.7% developed a nonfatal cardiovascular disease, 2.8% died from cardiovas- cular disease, and 7.3% from noncardiovascular causes over the mean 16-year follow-up. The remaining 73.2% followed
a natural aging course. Participant characteristics as a func- tion of these aging phenotypes are presented inTable 1.
Dietary Patterns
Results of the associations between “healthy-foods” and
“Western-type” dietary patterns and aging outcomes are presented inTable 2. The “healthy-foods” diet (incorporat- ing high intake of vegetables, fruits, and fish) was inversely associated with noncardiovascular mortality after adjusting for sex, age, total energy intake (Model 1, odds ratio [OR]
per 1-SD increment 0.76; 95% confidence interval [CI], 0.68-0.84). However, this association was attenuated after further adjustment for health behaviors such as smoking
status and physical activity (Model 2, OR 0.90; 95% CI, 0.79-1.01).
Participants in the top tertile of the “Western-type” diet (ie, a diet characterized by fried food, processed food and red meat, pies, sweetened desserts, chocolates, refined grains, high-fat dairy products, and condiments) had substantially lower odds for ideal aging compared with participants in the bottom tertile after adjustment for age, sex, and total energy intake (Model 1:
OR 0.52; 95% CI, 0.33-0.82) and health behaviors (Model 2:
OR 0.58; 95% CI, 0.36-0.93). A higher score of the “Western- type” diet also was associated with higher odds of both car- diovascular and noncardiovascular mortality (ORs per 1-SD increment 1.53; 95% CI, 1.16-2.01 and 1.36; 95% CI, 1.14- Table 1 Characteristics of Participants (n⫽5350) by Aging Phenotype, the Whitehall II study*
Characteristic
Ideal Aging Nonfatal CVD CVD Death Non-CVD Death Natural Aging†
PValue
n⫽213 n⫽680 n⫽149 n⫽392 n⫽3916
Baseline
Age, years 49.8 (5.1) 53.1 (5.2) 54.7 (4.9) 53.7 (5.3) 50.7 (5.1) ⬍.001
Sex, % women 31.5 24.4 24.8 32.9 30.0 .01
Total energy intake, kcal/day 2137 (618) 2148 (681) 2051 (638) 2099 (774) 2082 (605) .08 Smoking habits, %
Never 62.0 46.9 37.6 38.3 51.0 ⬍.001
Former 34.7 36.0 36.2 32.9 36.3
Current 3.3 17.1 26.2 28.8 12.7
Physical activity, %
Inactive 16.4 23.7 28.9 27.3 19.3 ⬍.001
Moderately active 30.0 27.3 31.5 28.1 27.7
Active 53.5 49.0 39.6 44.6 53.0
AHEI score, %
Tertile 1 25.8 33.4 49.0 41.1 32.4 ⬍.001
Tertile 2 41.8 31.0 25.5 30.6 33.8
Tertile 3 32.4 35.6 25.5 28.3 33.8
“Healthy-foods” pattern, %
Tertile 1 28.6 30.9 41.6 38.5 33.2 .04
Tertile 2 36.6 28.8 28.9 28.8 33.9
Tertile 3 34.7 32.6 29.5 32.6 32.9
“Western type” pattern, %
Tertile 1 34.7 32.2 29.5 34.2 33.5 .04
Tertile 2 38.0 29.3 36.2 29.3 34.0
Tertile 3 27.3 37.0 34.2 36.5 32.5
Follow-up
Coronary heart diseases, n (%) of cases 0 (0) 145 (25.1) — — 0 (0) N/A
Stroke, n (%) of cases 0 (0) 175 (28.4) — — 0 (0) N/A
SBP, mm Hg 112.9 (9.2) 125.3 (16.9) — — 127.7 (16.3) N/A
Cancer, n (%) of cases 0 (0) 71 (10.5) — — 542 (13.9) N/A
Type 2 diabetes, n (%) of cases 0 (0) 128 (18.8) — — 486 (12.4) N/A
Lung function (FEV1/height2), L/m2 1.11 (0.18) 0.91 (0.23) — — 0.94(0.22) N/A
Walking speed, m/s 1.41 (0.23) 1.11 (0.31) — — 1.15 (0.29) N/A
Cognitive function, z-score 0.85 (0.6) ⫺0.22 (1.1) — — ⫺0.01 (0.97) N/A
SF-36 mental health 56.1 (4.2) 53.4 (9.0) — — 53.8 (8.3) N/A
AHEI⫽the Alternative Healthy Eating Index; CVD⫽cardiovascular disease; FEV⫽forced expiratory volume; SBP⫽systolic blood pressure; SF-36⫽ the Short Form 36 General Health Survey.
*Numbers are means and SDs unless otherwise specified.
†Those alive at the end of follow-up without ideal health or nonfatal CVD.
From the distribution of these factor scores, participants were categorized into tertiles for each pattern: the Tertile 1 group included participants with a factor score below the 33rdpercentile, the Tertile 2 group included participants with a factor score in the 33th-66thpercentile range and the Tertile 3 group included those with a factor score above the 66thpercentile.
1.61, respectively) in the age, sex, and total energy intake- adjusted model, but those associations were attenuated after further adjustments.
To further examine the robustness of the association between
“Western-type” diet and ideal aging, we performed subsidiary analyses for each component characterizing the ideal aging phe- notype. Participants in the highest tertile of “Western-type” dietary pattern, compared with those in the bottom tertile, were more likely to have poorer musculoskeletal (OR for below-median walking speed⫽1.45; 95% CI, 1.14-1.84) and cognitive function- ing (OR for below-median test score⫽1.58; 95% CI, 1.27-1.97).
No significant association was found between “Western-type” diet and the indicators of cardiometabolic and respiratory functioning and mental health.
The AHEI Score
Results of the association between the AHEI score and aging outcomes are presented in Table 3. After adjusting for age, sex, and total energy intake, high adherence to the AHEI recommendations was associated with decreased cardiovascu-
lar and noncardiovascular mortality, but not with nonfatal cardiovascular morbidity. The association between the AHEI score and ideal aging was nonlinear; compared with partici- pants in the bottom AHEI tertile, those in the intermediate tertile had higher odds of ideal aging, while being in the highest tertile of AHEI and the continuous AHEI score was not significantly associated with ideal aging. Further adjustment for other health behavior did not modify those associations.
To examine potential competing risk bias, the association between dietary variables and aging phenotypes was exam- ined using multinomial regression, allowing the estimation of odds of ideal aging and unhealthy aging outcomes within a single analytic setting, with natural aging as the common reference point for all 4 outcomes. Findings similar to that in the main analysis suggest that competing risk bias is unlikely (Appendix Table 3, online).
DISCUSSION
Complementing previous studies that have investigated the association between dietary behaviors and specific Table 2 Association of the 2 Dietary Patterns at Baseline with 4 Aging Outcomes at Follow-up (n⫽5350), the Whitehall II Study
Dietary Pattern at Baseline
Aging Outcome at Follow-up
Ideal Aging Nonfatal CVD CVD Death Non-CVD Death
OR 95% CI PValue OR 95% CI PValue OR 95% CI PValue OR 95% CI P-Value Healthy-foods diet
Model 1
Tertile 1 1 Ref 1 Ref 1 Ref 1 Ref
Tertile 2 1.28 0.90-1.81 .17 1.00 0.81-1.23 .99 0.66 0.44-0.98 .04 0.70 0.54-0.90 .005 Tertile 3 1.19 0.82-1.73 .35 1.10 0.89-1.35 .39 0.66 0.43-1.01 .05 0.61 0.47-0.80 ⬍.0001 Effect per 1 SD 1.08 0.94-1.25 .27 1.05 0.96-1.15 .26 0.86 0.71-1.04 .10 0.76 0.68-0.84 ⬍.0001 Model 2
Tertile 1 1 Ref 1 Ref 1 Ref 1 Ref
Tertile 2 1.20 0.85-1.70 .30 1.05 0.85-1.30 .64 0.74 0.49-1.12 .15 0.77 0.59-1.00 .04 Tertile 3 1.08 0.75-1.57 .68 1.17 0.95-1.46 .14 0.76 0.51-1.20 .25 0.85 0.65-1.12 .25 Effect per 1 SD 1.04 0.90-1.21 .59 1.08 0.99-1.18 .09 0.93 0.77-1.13 .46 0.90 0.79-1.01 .07 Western-type diet
Model 1
Tertile 1 1 Ref 1 Ref 1 Ref 1 Ref
Tertile 2 0.94 0.67-1.33 .73 0.87 0.70-1.08 .21 1.42 0.91-2.20 .12 0.90 0.68-1.18 .44 Tertile 3 0.52 0.33-0.82 .005 1.08 0.83-1.41 .56 1.66 0.95-2.89 .07 1.23 0.87-1.72 .24 Effect per 1 SD 0.73 0.58-0.91 .006 1.07 0.93-1.22 .33 1.53 1.16-2.01 .003 1.36 1.14-1.61 ⬍.0001 Model 2
Tertile 1 1 Ref 1 Ref 1 Ref 1 Ref
Tertile 2 0.96 0.68-1.37 .84 0.85 0.68-1.06 .16 1.33 0.85-2.08 .21 0.83 0.63-1.10 .19 Tertile 3 0.58 0.36-0.93 .02 1.02 0.78-1.34 .86 1.35 0.77-2.37 .29 0.99 0.70-1.38 .94 Effect per 1 SD 0.81 0.64-1.03 .08 1.02 0.89-1.17 .79 1.33 1.00-1.76 .05 1.15 0.96-1.37 .12 CI⫽confidence interval; CVD⫽cardiovascular disease; OR⫽odds ratio.
Model 1: Adjusted for age, sex and total energy intake.
Model 2: Model 1⫹additionally adjusted for smoking habits and physical activity.
Results are from logistic regression models estimating the association of dietary patterns assessed at baseline with 4 aging outcomes at follow-up: ideal health (n⫽213), nonfatal cardiovascular disease (n⫽680), cardiovascular death (n⫽149), and noncardiovascular death (n⫽392).
From the distribution of these factor scores, participants were categorized into tertiles for each pattern: the Tertile 1 group included participants with a factor score below the 33rdpercentile, the Tertile 2 group included participants with a factor score in the 33th-66thpercentile range and the Tertile 3 group included those with a factor score above the 66thpercentile.
age-related diseases, the present report aimed to extend the findings by considering aging as a multi-component process. While our results indicate that low adherence to healthy recommendations of the AHEI guidelines is as- sociated with increased premature death, the “Western- type” diet significantly reduced the likelihood of achiev- ing ideal health at older ages, which incorporates cardiovascular, metabolic, musculoskeletal, respiratory, mental, and cognitive components. These associations were independent of other health behaviors such as phys- ical activity and smoking.
We first assessed the association between “healthy- food” dietary pattern and aging phenotypes. This dietary pattern is characterized by intake of vegetables, fruits, and fish, and a beneficial effect on aging was expected due to the high content of antioxidants in fruits and vegetables (cf. the free radical theory of aging) and the high long-chain omega-3 polyunsaturated fatty acids con- tent in oily fish, a major component of neuron membranes with vascular properties.30However, in the present study, no significant association was observed between the
“healthy-food” dietary pattern and the 4 aging outcomes.
These results contrast with the literature showing protec- tive effect of vegetarian diet or very low meat intake diet on human health and mortality.31 Of the 5350 partici- pants, only 159 reported that they “never or rarely”
consumed meat. Owing to low numbers of meat noneat- ers and the fact that we were not able to precisely define whether these participants were vegetarian or not, the interpretation of this null finding should be cautious; it is possible that the statistically nonsignificant associations
observed between the “healthy-food” dietary pattern and subsequent aging phenotypes indicate an absence of be- neficial impact of diet close to vegetarian diet, or alter- natively is a consequence of lack of statistical power.
Our results showing that a diet matching a “Western- type” dietary pattern in middle age may be a risk factor for not achieving ideal healthy aging constitute a novel finding. The “Western-type” diet is composed of high consumption of fried food, processed and red meat, pies, sweetened desserts, chocolates, refined grains, high-fat dairy products, and condiments, and was to be associated particularly with the musculoskeletal and cognitive com- ponents of aging. In previous studies, “Western-type”
(also labeled as “processed food”) diet has been associ- ated with depressive symptoms5 and cognitive perfor- mance.32The “Western-type” diet identified in our cohort is very close to the original “Western” pattern defined in the American population,1which has been shown to be associated with higher risk of inflammation.33 At this stage, however, the mechanisms underlying the associa- tion between the “Western-type food” dietary pattern and lower odds of ideal aging remain unclear and need further investigation.
To complement our analysis of dietary patterns, which are obtained through statistical modeling of empirical data to describe the dietary behaviors of the studied population, we examined the impact of the AHEI dietary guidelines.
Our findings confirm the links of the AHEI with reduced cardiovascular and noncardiovascular mortality reported previously in the present cohort.14 Our analyses did not suggest a significant association with nonfatal cardiovascu- Table 3 Association of Adherence to AHEI at Baseline with 4 Aging Outcomes at Follow-up (n⫽5350), the Whitehall II Study
AHEI Score at Baseline
Aging Outcome at Follow-up
Ideal Aging Nonfatal CVD CVD Death Non-CVD Death
OR 95% CI P
Value OR 95% CI P
Value OR 95% CI PValue OR 95% CI P Value Model 1
Tertile 1 1 Ref 1 Ref 1 Ref 1 Ref
Tertile 2 1.63 1.15-2.30 .006 0.87 0.71-1.07 .19 0.51 0.34-0.78 .001 0.68 0.53-0.88 .004 Tertile 3 1.23 0.85-1.78 .28 1.04 0.85-1.28 .69 0.51 0.34-0.77 .001 0.72 0.55-0.94 .01 Effect per 1 SD 1.13 0.98-1.31 .10 1.00 0.92-1.09 .99 0.72 0.61-0.86 ⬍.0001 0.82 0.73-0.93 .002 Model 2
Tertile 1 1 Ref 1 Ref 1 Ref 1 Ref
Tertile 2 1.48 1.04-2.09 .02 0.92 0.74-1.13 .40 0.58 0.37-0.84 .006 0.79 0.61-1.02 .07 Tertile 3 1.07 0.73-1.55 .73 1.12 0.91-1.38 .28 0.60 0.39-0.92 .02 0.75 0.57-0.98 .03 Effect per 1 SD 1.06 0.91-1.23 .45 1.04 0.95-1.13 .40 0.79 0.66-0.94 .007 0.83 0.75-0.93 .001
AHEI⫽the Alternative Healthy Eating Index; CI⫽confidence interval; CVD⫽cardiovascular disease; OR⫽odds ratio.
Model 1: Adjusted for age, sex and total energy intake.
Model 2: Model 1⫹additionally adjusted for smoking habits and physical activity.
Results are from logistic regression models estimating the association of adherence to AHEI at baseline with 4 aging outcomes at follow-up: ideal health (n⫽213), nonfatal cardiovascular disease (n⫽680), cardiovascular death (n⫽149), and noncardiovascular death (n⫽392).
From the distribution of these factor scores, participants were categorized into tertiles for each pattern: the Tertile 1 group included participants with a factor score below the 33rdpercentile, the Tertile 2 group included participants with a factor score in the 33th-66thpercentile range and the Tertile 3 group included those with a factor score above the 66thpercentile.
lar morbidity, while adherence to the AHEI has been sug- gested to reduce the risk of type 2 diabetes and cardiovas- cular disease in American cohorts.9,10 In terms of ideal aging, the role of AHEI remains unclear and requires further research.
Our data present some limitations. The main drawback concerns the generalizability of our findings. Whitehall II study participants are mainly white, office-based civil servants who are not fully representative of the British population.13 Moreover, for the present analysis, parti- cipants with missing values were excluded. Compared with the excluded, those included were less likely to be younger, to have a higher AHEI score, and better health outcomes. This may lead to an underestimation of the observed associations. The assessment of dietary intake using a semi-quantitative food-frequency questionnaire that only covered specific foods also constitutes a limi- tation. This method is recognized to be less precise than dietary assessment by the food diary method. However, we have shown previously in this study population that nutrient intake estimated by the food-frequency question- naire method is correlated with biomarker levels and intake estimates from the generally more accurate 7-day diary.15 Finally, with observational data the possibility remains that unmeasured confounders may explain at least part of the observed association. Overall, the present study needs to be replicated in other cohorts to confirm the role of dietary patterns and adherence to AHEI guide- lines in subsequent aging phenotypes.
Despite these limitations, the present study is unique by studying aging phenotypes based on validated clinic-based measures and medical records in a large cohort followed over a 16-year period. Furthermore, by analyzing ideal aging and unhealthy aging outcomes within a single analytic setting, we were able to avoid overlap of the different aging health components and reduce competing risk bias. We showed that specific dietary recommendations such as the one provided by the AHEI may be useful in reducing the risk of unhealthy aging, while avoidance of the “Western- type foods” actually might improve the possibility of achieving older ages free of chronic disease and remaining highly functional. A better understanding of the distinction between specific health behaviors that offer protection against diseases and those that move individuals towards ideal aging may facilitate improvements in public health prevention packages.
ACKNOWLEDGMENT
We thank all participating civil service departments and their welfare personnel and establishment officers; the Occupational Health and Safety Agency; the Council of Civil Service Unions; all participating civil servants in the Whitehall II study; and all members of the Whitehall II Study Team. The Whitehall II Study Team comprises research scientists, statisticians, study coordinators,
nurses, data managers, administrative assistants, and data entry staff, who made the study possible.
References
1. Hu FB. Dietary pattern analysis: a new direction in nutritional epide- miology.Curr Opin Lipidol. 2002;13(1):3-9.
2. Kastorini CM, Panagiotakos DB. Dietary patterns and prevention of type 2 diabetes: from research to clinical practice; a systematic review.
Curr Diabetes Rev. 2009;5(4):221-227.
3. Brunner EJ, Mosdol A, Witte DR, et al. Dietary patterns and 15-y risks of major coronary events, diabetes, and mortality.Am J Clin Nutr.
2008;87(5):1414-1421.
4. Fung TT, Willett WC, Stampfer MJ, Manson JE, Hu FB. Dietary patterns and the risk of coronary heart disease in women.Arch Intern Med. 2001;161(15):1857-1862.
5. Akbaraly TN, Brunner EJ, Ferrie JE, Marmot MG, Kivimaki M, Singh-Manoux A. Dietary pattern and depressive symptoms in middle age.Br J Psychiatry. 2009;195(5):408-413.
6. Trichopoulou A, Costacou T, Bamia C, Trichopoulos D. Adherence to a Mediterranean diet and survival in a Greek population. N Engl J Med. 2003;348(26):2599-2608.
7. Sofi F, Abbate R, Gensini GF, Casini A. Accruing evidence on benefits of adherence to the Mediterranean diet on health: an updated systematic review and meta-analysis. Am J Clin Nutr 2010;92(5):1189-1196.
8. Sofi F, Cesari F, Abbate R, Gensini GF, Casini A. Adherence to Mediterranean diet and health status: meta-analysis.BMJ. 2008;337:
a1344.
9. McCullough ML, Feskanich D, Stampfer MJ, et al. Diet quality and major chronic disease risk in men and women: moving toward improved dietary guidance.Am J Clin Nutr. 2002;76(6):1261-1271.
10. Fung TT, McCullough M, van Dam RM, Hu FB. A prospective study of overall diet quality and risk of type 2 diabetes in women.Diabetes Care. 2007;30(7):1753-1757.
11. Akbaraly TN, Singh-Manoux A, Tabak AG, et al. Overall diet history and reversibility of the metabolic syndrome over 5 years:
the Whitehall II prospective cohort study. Diabetes Care 2010;
33(11):2339-2341.
12. Sundstrom J, Riserus U, Byberg L, Zethelius B, Lithell H, Lind L.
Clinical value of the metabolic syndrome for long term prediction of total and cardiovascular mortality: prospective, population based co- hort study.BMJ. 2006;332(7546):878-882.
13. Marmot M, Brunner E. Cohort profile: the Whitehall II study.Int J Epidemiol. 2005;34(2):251-256.
14. Akbaraly TN, Ferrie JE, Berr C, et al. Alternative Healthy Eating Index and mortality over 18 y of follow-up: results from the Whitehall II cohort.Am J Clin Nutr. 2011;94(1):247-253.
15. Brunner E, Stallone D, Juneja M, Bingham S, Marmot M. Dietary assessment in Whitehall II: comparison of 7 d diet diary and food- frequency questionnaire and validity against biomarkers.Br J Nutr.
2001;86(3):405-414.
16. Bingham SA, Gill C, Welch A, et al. Validation of dietary assessment methods in the UK arm of EPIC using weighed records, and 24-hour urinary nitrogen and potassium and serum vitamin C and carotenoids as biomarkers.Int J Epidemiol. 1997;26(Suppl 1):S137-S151.
17. Tunstall-Pedoe H, Kuulasmaa K, Amouyel P, Arveiler D, Rajakangas AM, Pajak A. Myocardial infarction and coronary deaths in the World Health Organization MONICA Project. Registration procedures, event rates, and case-fatality rates in 38 populations from 21 countries in four continents.Circulation. 1994;90(1):583-612.
18. Kivimaki M, Batty GD, Hamer M, et al. Using additional information on working hours to predict coronary heart disease: a cohort study.
Ann Intern Med. 2011;154(7):457-463.
19. Rose GA, Blackburn H, Gillum RF, Prineas RJ. Cardiovascular Survey Methods, 2nd ed. Geneva: World Health Organization;
1982.
20. Kivimaki M, Ferrie JE. Epidemiology of healthy ageing and the idea of more refined outcome measures.Int J Epidemiol2011;40(4):845-847.
21. Alberti KG, Zimmet PZ. Definition, diagnosis and classification of diabetes mellitus and its complications. Part 1: diagnosis and classifi- cation of diabetes mellitus provisional report of a WHO consultation.
Diabet Med. 1998;15(7):539-553.
22. Ware JE Jr, Sherbourne CD. The MOS 36-item short-form health survey (SF-36). I. Conceptual framework and item selection. Med Care. 1992;30(6):473-483.
23. Miller MR, Hankinson J, Brusasco V, et al. Standardisation of spi- rometry.Eur Respir J. 2005;26(2):319-338.
24. Guralnik JM, Simonsick EM, Ferrucci L, et al. A short physical performance battery assessing lower extremity function: association with self-reported disability and prediction of mortality and nursing home admission.J Gerontol. 1994;49(2):M85-M94.
25. Singh-Manoux A, Marmot MG, Glymour M, Sabia S, Kivimaki M, Dugravot A. Does cognitive reserve shape cognitive decline? Ann Neurol. 2011;70(2):296-304.
26. Heim AW.A.H.4 Group Test of General Intelligence ASE,Windsor ed. Windsor, UK: NFER-Nelson Publishing Co.Ltd; 1970.
27. Borkowski J, Benton A, Spreen O. Word fluency and brain damage.
Neuropsychologica. 1967;5:135-140.
28. Raven J.Guide to Using the Mill Hill Vocabulary Scale with Progres- sive Matrices.London: HK Lewis; 1965.
29. Stringhini S, Sabia S, Shipley M, et al. Association of socioeconomic position with health behaviors and mortality.JAMA. 2010;303(12):
1159-1166.
30. Yehuda S, Rabinovitz S, Carasso RL, Mostofsky DI. The role of polyunsaturated fatty acids in restoring the aging neuronal membrane.
Neurobiol Aging. 2002;23(5):843-853.
31. Singh PN, Sabate J, Fraser GE. Does low meat consumption increase life expectancy in humans?Am J Clin Nutr. 2003;78(3 Suppl):526S- 532S.
32. Akbaraly TN, Singh-Manoux A, Marmot MG, Brunner EJ. Education attenuates the association between dietary patterns and cognition.
Dement Geriatr Cogn Disord. 2009;27(2):147-154.
33. Lopez-Garcia E, Schulze MB, Fung TT, et al. Major dietary pat- terns are related to plasma concentrations of markers of inflamma- tion and endothelial dysfunction. Am J Clin Nutr. 2004;80(4):
1029-1035.
Appendix Table 1 Factor Loading* for High Loading Items (ⱖ0.40)† on the Two Dietary Patterns Identified Using Principal Component Analysis at Baseline
1stPattern:
“Healthy-foods”
2ndPattern:
“Western-type”
Leafy vegetables 0.69 —
Other vegetables 0.67 —
Tomatoes 0.59 —
Salad dressing 0.50 —
Fruits 0.49 —
Fish 0.46 —
Cruciferous vegetables 0.44 —
Fried food — 0.56
Processed meats — 0.52
Quiche/pie — 0.47
Chocolate and sweets — 0.46
Desserts/biscuits — 0.45
Condiments — 0.45
High fat dairy products — 0.42
Refined grain — 0.42
Red meat — 0.41
Two dietary patterns were identified using multiple criteria: the diagram of Eigenvalues, the Screeplot, the interpretability of the factors, and the percentage of variance explained by the factors.
*Factor loadings represent the correlation between the food groups and the dietary pattern.12
†Values⬍0.30 were not listed in order to simplify interpretation of the factors.
Appendix Table 2 Construction of AHEI Scores in 5350 Participants
Components
Criteria for Minimum Score
Criteria for Maximum Score
Possible Score Range
AHEI Scores in the Participants*
M⫾SD
Vegetable (serving/day) 0 5 0-10 5.6 (2.9)
Fruit (serving/day) 0 4 0-10 5.9 (3.1)
Nuts and soy (serving/day) 0 1 0-10 3.2 (3.0)
Ratio of white to red meat 0 4 0-10 5.1 (2.8)
Total fiber† (% of energy) 0 24 0-10 7.6 (3.0)
Trans fat (% of energy) ⱖ4 ⱕ0.5 0-10 8.4 (2.7)
Ratio of PUFA to SFA ⱕ0.1 ⱖ1 0-10 5.2 (2.7)
Duration of multivitamin use ⬍5 year ⱖ5 year 2.5-7.5 4.2 (2.4)
Alcohol serving/day, men 0 or⬎3.5 1.5-2.5 0-10 4.7 (3.7)‡
Alcohol serving/day, women 0 or⬎2.5 0.5-1.5 0-10
Total score 2.5-87.5 50.0 (12.0)
AHEI⫽Alternative Healthy Eating Index; PUFA⫽polyunsaturated fatty acids; SAF⫽saturated fatty acids.
*Each AHEI component contributed from 0 to 10 points to the total AHEI score, except the multivitamin component which was dichotomous and contributing either 2.5 points (for nonuse) or 7.5 points (for use) A score of 10 indicates that the recommendations were fully met, whereas a score of 0 represents the least healthy dietary behavior. Intermediate intakes were scored proportionately between 0 and 10.
†The original components of the index include cereal fiber, because cereal fiber was not available in our nutrient data set, we adapted the score by replacing it with total fiber.
‡Mean score for men and women combined.
Appendix Table 3 Association between the Two Dietary Patterns, AHEI Scores, and the Four Aging Outcomes (n⫽5350)
Dietary Pattern
Ideal Aging Nonfatal CVD Fatal CVD Non-CVD Death
PValue
OR 95% CI OR 95% CI OR 95% CI OR 95% CI
“Healthy-foods” pattern Model 1
Tertile 1 1 reference 1 reference 1 reference 1 reference
Tertile 2 1.23 0.87-1.74 0.97 0.79-1.20 0.63 0.42-0.95 0.67 0.52-0.87
Tertile 3 1.16 0.80-1.69 1.06 0.86-1.32 0.67 0.44-1.02 0.73 0.56-0.96
Effect per 1 SD 1.07 0.93-1.24 1.03 0.95-1.13 0.85 0.70-1.03 0.83 0.73-0.94 .008 Model 2
Tertile 1 1 reference 1 reference 1 reference 1 reference
Tertile 2 1.23 0.87-1.74 0.97 0.79-1.20 0.63 0.42-0.95 0.67 0.52-0.87
Tertile 3 1.08 0.74-1.58 1.15 0.92-1.43 0.78 0.51-1.21 0.86 0.66-1.14
Effect per 1 SD 1.04 0.90-1.21 1.06 0.97-1.16 0.93 0.77-1.13 0.90 0.80-1.02 .19
“Western-type” pattern Model 1
Tertile 1 1 reference 1 reference 1 reference 1 reference
Tertile 2 0.92 0.65-1.30 0.85 0.68-1.06 1.36 0.87-2.12 0.88 0.66-1.17
Tertile 3 0.54 0.34-0.85 1.08 0.82-1.41 1.68 0.96-2.95 1.23 0.88-1.74
Effect per 1 SD 0.77 .061-0.95 1.09 0.95-1.25 1.58 1.20-2.08 1.38 1.16-1.64 ⬍10-4 Model 2
Tertile 1 1 reference 1 reference 1 reference 1 reference
Tertile 2 0.94 0.66-1.33 0.83 0.67-1.04 1.25 0.80-1.95 0.81 0.61-1.08
Tertile 3 0.58 0.36-0.94 1.02 0.78-1.34 1.40 0.80-2.47 0.96 0.68-1.35
Effect per 1 SD 0.83 0.66-1.05 1.03 0.89-1.18 1.35 1.02-1.78 1.16 0.97-1.38 .05 AHEI score
Model 1
Tertile 1 1 reference 1 reference 1 reference 1 reference
Tertile 2 1.52 1.07-2.16 0.85 0.69-1.04 0.48 0.32-0.72 0.67 0.52-0.86
Tertile 3 1.16 0.80-1.68 0.98 0.80-1.21 0.49 0.32-0.74 0.60 0.46-0.78
Effect per 1 SD 1.09 0.95-1.27 0.97 0.89-1.06 0.70 0.59-0.83 0.75 0.67-0.83 ⬍10-4 Model 2
Tertile 1 1 reference 1 reference 1 reference 1 reference
Tertile 2 1.41 0.99-2.01 0.90 0.73-1.10 0.54 0.35-0.81 0.76 0.59-0.98
Tertile 3 1.04 0.71-1.52 1.07 0.87-1.32 0.59 0.38-0.90 0.74 0.56-0.96
Effect per 1 SD 1.04 0.90-1.21 1.01 0.93-1.11 0.77 0.65-0.92 0.83 0.74-0.92 .006 AHEI⫽Alternative Healthy Eating Index; CI⫽confidence interval; CVD⫽cardiovascular disease; OR⫽odds ratio.
Natural Aging was the “noncase” category for all aging phenotype outcomes presented.
Pfor heterogeneity.
Multinomial logistic regression to analyze associations between dietary patterns, AHEI score, and the 5-category aging outcome: 1) ideal health, 2) nonfatal cardiovascular disease at follow-up, 3) cardiovascular death, 4) noncardiovascular death, and 5) natural (or normal) aging (the noncase category for each of the other categories).
Model 1: Adjusted for age, sex and total energy intake.
Model 2: As Model 1⫹additionally adjusted for other heath behavior: smoking habits and physical activity.