Lactoferrin for the treatment of age-associated in fl ammation – A pilot study
T. LASKOW, J. LANGDON, P. ABADIR, Q.-L. XUE and J. WALSTON
pDivision of Geriatric Medicine and Gerontology, Johns Hopkins University School of Medicine, Baltimore, MD, USA
Received: November 6, 2020 • Accepted: November 13, 2020 Published online: April 9, 2021
© 2021 Akademiai Kiado, Budapest
ABSTRACT
Background: Chronic inflammation (CI) is a common trait of aging associated with adverse outcomes including mortality. We hypothesized that recombinant human Lactoferrin (rhLf) would reduce chronic inflammation of aging.Methods:Thirty-six community dwelling older adults were randomly assigned to rhLf or placebo treatment in 1:1 ratio for 3 months. IL-6, sTNFR1, Comprehensive Metabolic Panel (CMP), and Complete Blood Count (CBC) were measured at baseline, 1 month, 3 months, and 6 months. Physical and cognitive measures were completed at same timepoints, including 4-m walking speed (m/s), grip strength (kg), 6-min walking distance (m), home activity measured by accelerometer, trail making test– Part A (s) and–Part B (s), and Digit symbol substitution test (number correctly coded). Primary outcomes were differences in IL-6 and sTNFR1 concentrations evaluated by generalized linear model with log-link and gamma family distribution, controlling for baseline cytokine concentrations.Results:rhLF was well- tolerated. There were a significant number of abdominal complaints and increased drop-out rate in placebo group. Participants in rhLf arm had non-significant lower mean percent increase in IL6 at 3 months (rhLf mean IL-6 6% lower than control,P50.843), and sTNFaR1 (rhLf mean 2% lower than control,P50.36).
No significant changes were observed for the cognitive or physical measures.Conclusion:Treatment with rhLf did not significantly alter serum IL6 or sTNFR1 concentrations of older adults. This study may have been underpowered to detect difference, but provided evidence that a larger sample-size could more definitively determine the effect of rhLF on age-associated CI.
KEYWORDS
lactoferrin, chronic inflammation, IL-6, sTNFR1
pCorresponding author. Division of Geriatric Medicine and Gerontology, Johns Hopkins University School of Medicine, 5501 Hopkins Bayview Circle, Suite 1A.62, Baltimore, MD 21224, USA. Tel.:þ1 410 550 1003; fax:þ1 410 550 3143. E-mail: jwalston@jhmi.edu
Physiology International108 (2021) 1, 121–136 DOI:10.1556/2060.2021.00010
INTRODUCTION
Levels of inflammatory cytokines increase with increasing age [1]. This phenomenon has been termed age-associated chronic inflammation (CI), or inflammaging [2]. Although the primary driver of CI is not known, proposed mechanisms include an increased number of senescent cells, altered composition of the gut microbiota, and increased innate immune system activation due to immunogenic cellular debris following dysregulated cell death [3].
Multiple strands of evidence suggest that chronic elevations in inflammatory cytokines directly contribute to the pathophysiological changes that contribute to the severity of age- associated morbidity [4]. For example, genetic variants associated with augmented cytokine production or signaling, including SNPs in IL1, IL6, and CRP, are associated with morbidities such as cardiovascular disease, type 2 diabetes, and Alzheimer’s disease [5, 6]. The exact mechanisms by which CI mediates its downstream effects is an area of active research, mech- anisms with some experimental and theoretical support include DNA damage secondary to ROS generation, perturbation to the stem cell niche, ‘senesces-induced-senesces’ in which inflam- matory mediators induce senescence-like behavior in neighboring cells, and changes to cellular energy metabolism such as mitochondrial function [7–10].
Modulation of inflammatory signaling has most often been studied to prevent the specific disease states such as inflammatory arthritis and cardiovascular disease. This approach has proven beneficial in some, but not all, chronic disease states where it has been tested. Notably, the CANTOS trial demonstrated modest benefit of canakinumab in reducing cardiovascular events as secondary prevention among patients who had persistent elevation of the inflam- matory marker hsCRP and history of a prior myocardial infarction [11]. However, the CIRT trial found no benefit for low-dose methotrexate for secondary prevention in patients with prior myocardial infarction or multivessel coronary artery disease and either type II diabetes or the metabolic syndrome [12]. Meanwhile, studies of TNFa inhibitors as treatment in patients with heart failure and elevated levels of TNFa did not demonstrate benefit and in one study showed evidence of harm [13, 14].
Beyond prevention or treatment of specific disease with inflammatory components, few studies have attempted to modulate CI itself. In a recent study of the impact of losartan and omega three fish oil on inflammatory mediators as well as functional outcomes in older adults found that these drugs had no impact on any of the primary or secondary outcomes [15]. Other trials are ongoing to study the impact of modulating the inflammatory cascade in the context of age-associated conditions including dementia, myocardial infarction, frailty, and diabetes. One challenge in such trials are the pleotropic effects of the intervention medications and the broad adverse effects that come with anti-inflammatory therapies. Over-the-counter therapies, such as non-steroidal anti-inflammatory (NSAID) therapies, have associated risks such as gastrointes- tinal bleeding and increased cardiovascular adverse events [16]. More potent and targeted in- flammatory modulators such as TNFa soluble receptor blockers cause immunosuppression with an associated increased risk of infectious complications.
Given the need to study safe yet effective mechanisms to modulate inflammatory signaling in older adults with CI, we sought to test an agent with known anti-inflammatory impact without known adverse impacts. Lactoferrin is an endogenous glycoprotein found in mammals, and a member of the larger transferrin family which is found widely in both animals and birds [17].
Although the highest concentrations of lactoferrin are found in colostrum, it is also present in
exocrine gland secretions and released by neutrophils [18]. Lactoferrin is a multifunctional protein with biological functions that include iron binding and modulation of iron homeostasis associated with reductions in IL-6 and upregulation of ferroportin. It has several immunologic and infectious disease-related functions including disruption of bacterial biofilms, inhibition of bacterial adhesion, and inhibition of bacterial invasion of host cells. Given that it is heavily secreted in mammalian milk, one of its crucial roles is the prevention of infections in newborns and infants.
In the clinical setting, lactoferrin has been demonstrated to lower incidence of late onset necrotizing enterocolitis in preterm infants [19]. It has also been reported to increase hemo- globin concentration and decrease IL-6 concentration in both pregnant and non-pregnant women with anemia [20]. Treatment with rhLf was reported to reduce antibiotic associated diarrhea in long-term care facility residents [21]. Anti-inflammatory effects were also demon- strated in a trial in which post-menopausal women were treated for 6 months with bovine lactoferrin and showed significant reductions of CRP and IL-6 levels [22].
Because of its favorable safety profile and demonstrated efficacy in reducing inflammatory cytokines, we hypothesized that oral lactoferrin would lower inflammatory cytokine levels in older adults, and in doing this, potentially slow functional and cognitive decline. We set out to test this hypothesis as detailed below.
METHODS
Participants
The study was reviewed and approved by the Johns Hopkins Medical Institutional Review Board (IRB). Participants were recruited from a registry of older adults who had expressed interest in participating in studies related to aging. Inclusion criteria for this study were: age 70 years or older, able to complete 4-m timed walk, walking speed≤1.0 m/s, serum IL-6 level≥2.5 pg/mL or TNFR1 level≥1,500 pg/mL. Exclusion criteria for this study were: a Mini-Mental Status Exam score <21, IL-6 levels above 30.0 pg/uL, daily anti-inflammatory drug use (prednisone, Advil, Aleve, Remicade, Enbrel, methotrexate, standing NSAID, aspirin greater than 325 mg per day), lower extremity mobility disability caused by Parkinson’s disease, cerebrovascular accident (CVA)with residual motor deficit, severe osteoarthritis or rheumatoid arthritis, symptomatic claudication, hospitalization within 3 months for myocardial infarction, angina, infection requiring antibiotics, or joint replacement, and the existence of any other known medical conditions that could cause elevation in cytokines selected as primary outcomes – such as chronic malignancies. Consistent with NIH guidelines, both genders and minority persons were enrolled. Participants were randomized to treatment or control by the study pharmacy using an online random number generator (https://www.randomizer.org/).
Laboratory tests
The primary outcome cytokines, IL-6 and sTNFR1, were measured by ELISA assay, using the Human IL-6 HS and TNFR1 microplates produced by R&D Systems (cat#. HS600C and DRT100). Per the study inclusion and exclusion criteria, IL-6 and sTNFR1 were measured in a Clinical Laboratory Improvement Amendments (CLIA) certified lab for screening purposes
Physiology International108 (2021) 1, 121–136 123
twice before randomization into the intervention study. If TNFR1 was 1,500 pg/mL or above or IL6 was 2.5 pg/mL and above at the initial screening visit, the serum cytokine levels were measured again from a second blood draw taken within 4 weeks of the initial screening visit.
Those who met entry criteria on both visits of either IL-6 or sTNFR1 level were eligible for study enrollment and scheduled for the baseline visit. Subsequently, IL-6 and sTNFR1 were measured at baseline, 1-month, 3-month, and 6-month follow up by the same CLIA certified laboratory. A comprehensive metabolic panel and complete blood count was also obtained at the screening, baseline, 1-month, 3-month, and 6-month visits.
Clinical testing
Physical and cognitive measures were completed at baseline, 3-month, and 6-month visit: 4- meter walking speed (m/s), grip strength (kg), 6-min walking distance (m), trail making test– Part A (s), Trail making test–Part B (s), and Digit symbol substitution test (number correctly coded) were measured at each visit. Additionally, participants were given accelerometer for home activity measurement using the Acti-Graph® Link Activity monitor (placed on the par- ticipant’s non-dominant wrist) at a sampling frequency of 80 Hz for 7 days immediately after completing the baseline, 3-month, and 6-month visits. For accelerometer, raw data was downloaded using commercial software (ACTLIFE, v6) to derive activity data in g force and counts/min. For each participant, 8 measures were derived from accelerometer data: total daily activity count (TAC), total log daily activity count (TLAC), log total daily activity count (LTAC);
these 3 corresponding measures using only morning data from 8 A.M. to noon (TAC 4HR, TLAC 4HR, and LTAC 4HR); and 2 measures of activity fragmentation. The activity frag- mentation measures were 24-h Active-to-Sedentary Behavior Transition Probability (STP), defined as the number of physical activity bouts (consecutive minutes registering≥1,853 counts per minute by Actigraph) divided by the total sum of minutes spent in physical activity [23], and 24-h Sedentary-to-Active Behavior Transition Probability (SATP) defined as the ratio of the number of sedentary bouts (consecutive minutes registering <1,853 counts per minute by Actigraph) divided by the total sedentary time [23].
Treatment: Lactoferrin
Recombinant human Lactoferrin (rhLF), purified from transgenic rice, was developed in a pharmaceutical grade capsule by Ventria Bioscience Biotech. Inert capsule ingredients were cellulose, magnesium stearate, and silicon dioxide. Each capsule was reported by manufacturer to contained 250 mg of rhLactoferrin. Participants in the treatment group received 6 capsules twice a day for a total dose of 1,500 mg rhLf twice a day. Purity was certified by manufacture using SEC-HPLC at 98.9% purity.
Placebo
Control group participants received matching placebo capsules (also purchased from Ventria Bioscience Biotech), containing cellulose, magnesium stearate, and silicon dioxide. Placebo was given using same daily dosing schedule, 6 capsules twice daily.
Treatment was continued for about 3 months (87 days). Participants had an additional follow up assessment at 6 months (3 months after completion of the treatment phase).
Statistical analysis
The mean serum concentrations of IL-6 and sTNFR1 between rhLf and placebo treatment arms were first evaluated as absolute values using Wilcoxon rank-sum testing. To account for data skewness and baseline differences between groups in mean cytokine concentrations, we then used a generalized linear model with log link and gamma family distribution, controlling for baseline level in each cytokine. For functional and laboratory measures the significance of between group differences were tested using a two-samplet-test with unequal variance, as well as multiple linear regression models adjusted for age, gender, and BMI and baseline measure. To compare side effect incidence between treatment and control we used a negative binomial regression model.
RESULTS
One hundred forty potential participants were identified from the registry, and (Fig. 1). Sixty-six potential participants attended a screening visit. Twenty-six screened participants were excluded
Fig. 1.Screening, randomization, treatment, and follow-up.
Label: Prescreening participants who were excluded either did not meet inclusion/exclusion criteria or declined study participation. Prior to baseline visit, cytokine measures outside prespecified study param-
eters was the most common reason for excluding potential participants. Randomization was completed using random number generator in blocks of ten numbers with even numbers assigned to rLf and odd
numbers to placebo
Physiology International108 (2021) 1, 121–136 125
due to serum cytokine concentrations that did not satisfy the prespecified inclusion/exclusion criteria. Four screened participants declined to participate. Thirty-six participants were enrolled.
The mean age of the rhLf arm was 82.6 years and the mean age for the placebo arm at 79.6 years (Table 1). 11 of 18 participants in both the rhLf and the placebo arm identified as female.
In rhLf arm, 78% of participants identified as White, 17% identified as Black or African American, 6 % identified as Asian. In the placebo arm, 83% of participants identified as White and 17% identified as Black or African American. The number of participants with BMI≥30 kg/
m2 was 5 of 18 in the rhLf arm and 8 of 18 in the placebo arm (Table 1).
Eighteen participants were assigned to the treatment group, of which all completed the full treatment course. In the placebo group, 7 of 18 withdrew from treatment (39%). Of those who withdrew, 6 of the 7 remained in the study for follow up only. 71% of those who withdrew (5 of 7) stopped the treatment because they experienced intolerable side-effects, including gastroin- testinal upset, change in bowel habits, and intolerance of pill burden. The remaining 2 of 7 who withdrew did so due to unrelated health issues.
Table 1.Characteristics of the study participants at baseline
Characteristics rhLactoferrinn518 Placebon518
Age–year: mean±SD 82.6±6.6 79.6±5.6
Female sex–no./total no. (%) 11/18 (61.1%) 11/18 (61.1%)
Ethnicity–no./total no. (%)
Hispanic or Latino 0/18 0/18
Asian 1/18 (5.6%) 0/18
Black/African American 3/18 (16.7%) 3/18 (16.7%)
White 14/18 (77.8%) 15/18 (83.3%)
Unknown or not reported 1/18 (5.6%) 1/18 (5.6%)
BMI≥30 kg/m2–no./total no. (%) 5/18 (27.8%) 8/18 (44.4%)
SD: standard deviation; BMI: Body Mass Index.
Table 2.Summary of distributions of IL-6 and TNFaR1 levels at 3- and 6-month visit
Cytokine Control median (IQR) Treatment median (IQR) P-valuep
Baseline
IL-6 (pg/mL) 2.19 (164) 3.53 (4.36) NA
TNFaR1 (pg/mL) 1,541.1 (410.0) 1,686.9 (628.4) NA
3 months
IL-6 (pg/mL) 3.26 (1.81) 3.55 (4.11) 0.478
TNFaR1 (pg/mL) 1,688.9 (359.2) 1,752.5 (452.8) 0.717
6 months
IL-6 (pg/mL) 3.45 (2.16) 3.69 (3.48) 0.553
TNFaR1 (pg/mL) 1,721.3 (512.4) 1,684.5 (689.7) 0.792
IQR: interquartile range; NA: inapplicable due to randomization.
pBased on non-parametric Wilcoxon rank-sum test.
0123
3-Month Follow-up Visit
)6-LI(goL
control treatment
0123
6-Month Follow-up Visit
Log(IL-6)
control treatment
6.87.07.27.47.67.88.08.2
3-Month Follow-up Visit
)1RaFNT(goL
control treatment
6.87.07.27.47.67.88.08.2
6-Month Follow-up Visit
Log(TNFaR1)
control treatment
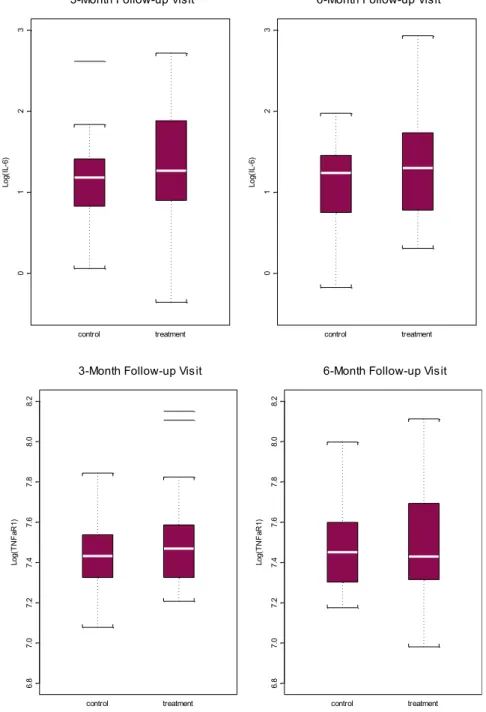
Fig. 2.Boxplot for distribution of log IL-6 (top) and log TNFaR1 (bottom) at 3-month and 6-month visit
Physiology International108 (2021) 1, 121–136 127
Effects of Lactoferrin on Chronic Inflammation Measures
For the primary endpoint chronic inflammation, the treatment group demonstrated a lower mean Il-6 and sTNFR1 levels at 3 months follow up, but higher mean IL-6 level at 6 months, and lower mean sTNFR1 level at 6 months, however these differences did not reach statistical sig- nificance at any timepoint (Table 2).
The effect of treatment on IL-6 and sTNFR1 were first analyzed by testing cross-sectional between-group difference at 3 months (end of treatment) and 6 months (3 months post- treatment). No statistically significant difference was observed between groups for either cyto- kine at 3-month or 6-month follow up (Table 2,Fig. 2).
At 3-month follow up, using a generalized linear model controlling for baseline log IL-6 concentration, the treatment group on average had a mean Il-6 concentration that was 5.7%
lower than the control group, however this difference was not statistically significant (P 5 0.843). At 6 months, the corresponding, baseline-adjusted difference in IL-6 concentration was 1.0% higher in the treatment group compared to control, and also not statistically significant (P 50.984). For sTNFR1, the baseline adjusted concentration was 2.1% lower in treatment group at 3 months and 5.5% lower at 6 months compared to the control group, though not significant at either time point (P 5 0.606 and P 5 0.247 respectively). See Table 3 for a summary of predicted mean level of IL-6 and sTNFR1 at three- and six-month after adjusting for baseline mean levels of these cytokines and other covariates adjusted results.
Tolerability and adherence
We wanted to know the tolerability of rhLf and adherence to treatment. To evaluate this, we analyzed the incidence of side effects (SE) throughout the interval of 3-month treatment and also at the 6-month follow up visit. We used fitting of a binomial regression model, which demonstrated an incidence of side effects was close to double in the placebo compared to treatment group, with 2.3 SE per 100 person days of treatment for the treatment group and 3.9 SE per 100 person days in the placebo group. The difference in SE incidence was, however, not statistically significant, P 5 0.147. The SE reported by the placebo group were primarily
“diarrhea”and were only reported during the treatment period. Notably, when participants in the placebo group reported an SE categorized as“other,” the SE was also, most often gastro- intestinal in nature. Pill size and/or the number of pills were also mentioned as a side effect
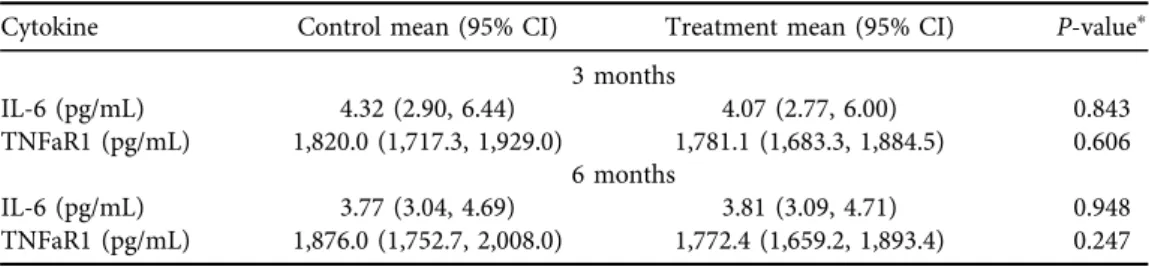
Table 3.Predicted mean IL-6 and TNFaR1 by treatment assignment after adjusting for baseline values (i.e., by setting log IL-6 and log TNFaR1 at its respective sample mean: 1.06 and 7.46)
Cytokine Control mean (95% CI) Treatment mean (95% CI) P-valuep
3 months
IL-6 (pg/mL) 4.32 (2.90, 6.44) 4.07 (2.77, 6.00) 0.843
TNFaR1 (pg/mL) 1,820.0 (1,717.3, 1,929.0) 1,781.1 (1,683.3, 1,884.5) 0.606 6 months
IL-6 (pg/mL) 3.77 (3.04, 4.69) 3.81 (3.09, 4.71) 0.948
TNFaR1 (pg/mL) 1,876.0 (1,752.7, 2,008.0) 1,772.4 (1,659.2, 1,893.4) 0.247
pBased on generalized linear regression of IL-6 (or TNFaR1), with a log link and gamma family distribution, on treatment and baseline log IL-6 (or log TNFaR1).
Table 4.Outcome-specific mean performance score by treatment assignment and time
Baseline 3-month 6-month
Meanp 95% CI Meanp 95% CI Meanp 95% CI
Walking speed (m/s) Placebo 0.754 0.673 0.836 0.764 0.677 0.85 0.767 0.681 0.852
Treatment 0.771 0.69 0.851 0.788 0.702 0.875 0.786 0.701 0.871
Grip (kg) Placebo 21.579 18.864 24.294 21.101 17.76 24.442 20.294 17.43 23.157
Treatment 23.787 21.091 26.483 23.553 20.235 26.872 23.493 20.649 26.337
6M walk (m) Placebo 342.34 285.42 399.26 326.7 271.57 381.83 334.94 279.48 390.4
Treatment 353.25 295.12 411.38 358.47 302.16 414.77 359.66 303.02 416.3
LTAC Placebo 14.46 14.29 14.64 14.44 14.26 14.63 14.46 14.28 14.65
Treatment 14.28 14.1 14.45 14.29 14.1 14.49 14.31 14.11 14.5
TMTA (s) Placebo 59.71 47.81 71.61 46.97 38.16 55.79 42.68 35.89 49.47
Treatment 49.67 37.85 61.49 39.37 30.62 48.13 33.11 26.36 39.85
TMTB (s) Placebo 114.85 93.71 136 125.56 97.27 153.86 131.24 100.61 161.87
Treatment 99.78 78.83 120.72 118.69 90.59 146.79 122.73 92.31 153.14
DSST (count) Placebo 29.77 23.72 35.83 29.12 24.3 33.95 31 25.42 36.58
Treatment 33.32 27.31 39.33 32.1 27.31 36.89 31.61 26.07 37.16
Label: LTAC–log total activity count; TMTA–trail making test A; TMTB–trail making test B; DSST–digit symbol substitution test; CI– confidence interval. Thepindicates values adjusting for age (581), gender (female), BMI (529.5).
PhysiologyInternational108(2021)1,121–136129
reported within the “other” category, and this SE related to pill burden was found in both treatment and control arms.
Importantly, the entire treatment group (n 5 18) completed the treatment course. In contrast, 39% of the individuals in the placebo group withdrew from treatment (7 out of 18), see earlier comments in this results section.
Exploratory functional measures
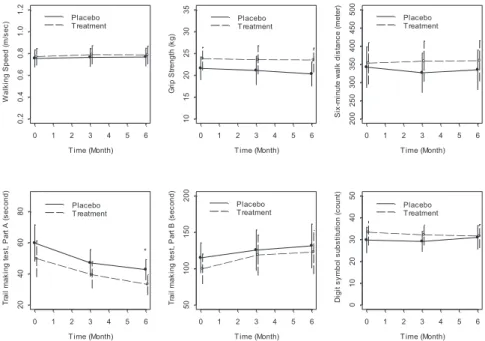
To demonstrate possible correlates between rhLf treatment and improvements in age-related clinical outcomes, we completed measures at baseline, 3 month, and 6 month follow up of physical and cognitive function. There was a total of seven outcomes evaluated. The physical outcome measures were 4-m walking speed (m/s), grip strength (kg), 6-min walking distance (m), log total activity count. The cognitive outcomes were Trail making test, Part A (s), Trail making test, Part B (s), Digit symbol substitution test (number correctly coded). The results are summarized inTable 4and Fig. 3.
We did not detect a significant effect of rhLf at the 3-month time point for any of the 7 cognitive and physical functional outcomes domains (see Table 4). This effect remained insignificant after adjusting for age, gender, and BMI using linear regression. At the 6-month time point, results for the clinical outcome measures remained insignificant. At the 6-month time point there was a statistically significant improvement in the Trail making test Part A when multiple linear regression was applied, adjusting for age, gender, and BMI, however it should be
T ime (Month)
)ces/m( deepS gniklaW
0 1 2 3 4 5 6
0.20.40.60.81.01.2
Placebo T reatment
T ime (Month)
Grip Strength (kg)
0 1 2 3 4 5 6
101520253035
Placebo T reatment
T ime (Month)
Six-minute walk distance (meter)
0 1 2 3 4 5 6
200250300350400450500
Placebo T reatment
T ime (Month)
)dnoces( A traP ,tset gnikam liarT
0 1 2 3 4 5 6
20406080 Placebo T reatment
*
T ime (Month)
Trail making test, Part B (second)
0 1 2 3 4 5 6
50100150200
Placebo T reatment
T ime (Month)
Digit symbol substitution (count)
0 1 2 3 4 5 6
01020304050
Placebo T reatment
Fig. 3.Adjusted mean performance score by treatment assignment and time.
Label: Adjusted for female gender, mean age of 81, and mean BMI of 29.5;p:P-value <0.05
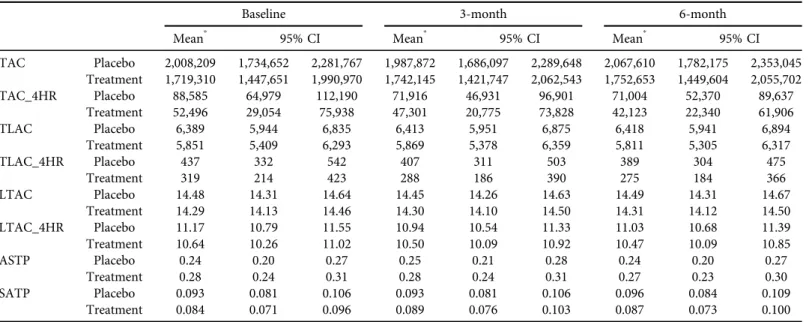
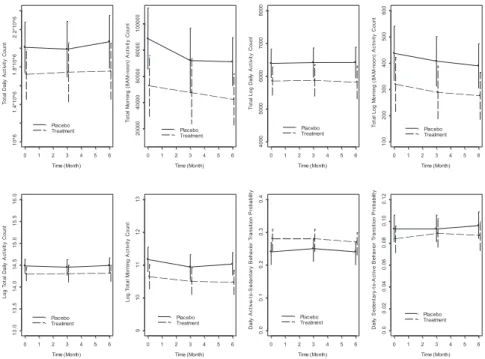
Table 5.Adjusted physical activity score by treatment assignment and time
Baseline 3-month 6-month
Meanp 95% CI Meanp 95% CI Meanp 95% CI
TAC Placebo 2,008,209 1,734,652 2,281,767 1,987,872 1,686,097 2,289,648 2,067,610 1,782,175 2,353,045 Treatment 1,719,310 1,447,651 1,990,970 1,742,145 1,421,747 2,062,543 1,752,653 1,449,604 2,055,702
TAC_4HR Placebo 88,585 64,979 112,190 71,916 46,931 96,901 71,004 52,370 89,637
Treatment 52,496 29,054 75,938 47,301 20,775 73,828 42,123 22,340 61,906
TLAC Placebo 6,389 5,944 6,835 6,413 5,951 6,875 6,418 5,941 6,894
Treatment 5,851 5,409 6,293 5,869 5,378 6,359 5,811 5,305 6,317
TLAC_4HR Placebo 437 332 542 407 311 503 389 304 475
Treatment 319 214 423 288 186 390 275 184 366
LTAC Placebo 14.48 14.31 14.64 14.45 14.26 14.63 14.49 14.31 14.67
Treatment 14.29 14.13 14.46 14.30 14.10 14.50 14.31 14.12 14.50
LTAC_4HR Placebo 11.17 10.79 11.55 10.94 10.54 11.33 11.03 10.68 11.39
Treatment 10.64 10.26 11.02 10.50 10.09 10.92 10.47 10.09 10.85
ASTP Placebo 0.24 0.20 0.27 0.25 0.21 0.28 0.24 0.20 0.27
Treatment 0.28 0.24 0.31 0.28 0.24 0.31 0.27 0.23 0.30
SATP Placebo 0.093 0.081 0.106 0.093 0.081 0.106 0.096 0.084 0.109
Treatment 0.084 0.071 0.096 0.089 0.076 0.103 0.087 0.073 0.100
TAC–total activity count; TLAC–total log activity count; LTAC–log total activity count; TAC_4HR, TLAC_4HR, and LTAC_4HR are corresponding measures using only data for the morning (8AM-noon) activities.
ASTP–24-h Active-to-Sedentary Behavior Transition Probability; SATP -24-h Sedentary to Active Transition Probability.
pAdjusting for age (581), gender (female), BMI (529.5).
PhysiologyInternational108(2021)1,121–136131
noted that thisfinding was not adjusted for baseline differences between treatment groups (see Fig. 3).
To account for differences in baseline mean functional measure between groups we also analyzed the 3-month and 6-month functional outcome measures after adjusting for age, gender, BMI, and their corresponding baseline functional measures, we did not observe a sig- nificant effect of rhLf on any of these outcomes. Notably, the improvement in Trail making test Part A was not present after adjustment for baseline differences between groups.
Within the domain of physical activity, as measured by accelerometry, 5 of 8 subdomain measures were notably different between treatment arms at baseline, with the control arm having more favorable physical activity profiles. Representative baseline comparisons include TLAC: Placebo–6,389 (±445) vs Treatment–5,851 (±442); ASTP: Placebo–0.24 (±0.04) vs Treatment – 0.28 (±0.04); SATP: Placebo –0.093 (±0.012) vs Treatment 0.84 (±0.013) (see Table 5and Fig. 4). Within these subdomains, multiple linear regression models adjusted for age, gender, and BMI and baseline physical activity were used to assess between group differ- ences at 3-month and 6-month follow up and no significant differences were found.
To evaluate the validity of our functional measures as secondary outcomes for studies of interventions to address age-related CI, we also assessed the correlation between each baseline physical and cognitive measure and baseline log IL-6 and log sTNFR1 using Spearman corre- lation. In this small sample of 36 participants, no correlations were statistically significant (See Supplemental Supplementary Figs 1 and 2).
Time (Month)
tnuoC ytivitcA yliaD latoT
0 1 2 3 4 5 6
10^61.4*10^61.8*10^62.2*10^6
Placebo Treatment
Time (Month)
Total Morning (8AM-noon) Activity Count
0 1 2 3 4 5 6
20000400006000080000100000
Placebo Treatment
Time (Month)
Total Log Daily Activity Count
0 1 2 3 4 5 6
40005000600070008000
Placebo Treatment
Time (Month)
Total Log Morning (8AM-noon) Activity Count
0 1 2 3 4 5 6
100200300400500600
Placebo Treatment
Time (Month)
tnuoC ytivitcA yliaD latoT goL
0 1 2 3 4 5 6
13.013.514.014.515.015.516.0
Placebo Treatment
Time (Month)
Log Total Morning Activity Count
0 1 2 3 4 5 6
910111213
Placebo Treatment
Time (Month)
Daily Active-to-Sedentary Behavior Transition Probability
0 1 2 3 4 5 6
0.00.10.20.30.4
Placebo Treatment
Time (Month)
Daily Sedentary-to-Active Behavior Transition Probability
0 1 2 3 4 5 6
0.00.020.040.060.080.100.12
Placebo Treatment
Fig. 4.Adjusted mean physical activity score by treatment assignment and time (Adjustment: female gender, mean age of 81, and mean BMI of 29.5)
Exploratory laboratory measures
Given the previously reported effects of lactoferrin supplementation on inflammatory cytokines and anemia of chronic inflammation, effects of treatment on percent change in white blood cell count and hemoglobin concentration from baseline to 3-month and 6-month follow up. No statistically significant different was observed between control and treatment groups using two- sample T-test assuming unequal variance (see Supplemental Fig. 3).
DISCUSSION
In this pilot randomized, controlled trial of oral rhLf for the treatment of age-associated CI, we did not detect a statistically significant treatment effect. There was no significant difference in IL-6 or sTNFR1 between the treatment and control groups. There was also no significant effect of rhLf at 3-month or 6-month follow up for any of the physical or cognitive outcomes when adjusting for baseline differences between groups. The rhLf treatment was well-tolerated.
Despite these negative results, the present study provides important rationale and guidance for future studies.
First, though the present study appears to have been underpowered, the results provide evidence for better estimates of the number of participants needed to adequately test the hy- pothesis of rhLf treatment effect. Given that the observed directionality of treatment effect was mostly consistent with our hypothesis, we were able to provide recommendations regarding the number of participants need to identify a true treatment effect with 80% power. Our power calculations are based on use of a two-samplet-test with unequal variance. Selecting sTNFR1 alone as a primary outcome, we estimate that 27 participants in each treatment arm would be needed to achieve 80% power. For IL-6, the number needed to achieve sufficient power would be 727 participants in each study arm.
A second important finding is underscored by these power calculations. Consistent with prior research, we found that sTNFR1 was a less variable inflammatory marker than IL-6 [24].
This has significant implications for feasible pilot study design, suggesting that sTNFR1 is a more suitable marker in this setting, providing adequate power with a more modest number of participants. Though IL-6 remains clinically important in the measurement and definition of CI, it may be more appropriate as a secondary outcome measure in future pilot studies of lactoferrin treatment or other interventions to modulate CI.
Treatment with lactoferrin did not cause significant changes in any of the physical or cognitive function measures utilized as secondary outcomes at 3-months. It may be that 3 months of treatment was not a sufficient length of time to see clinically meaningful change, and a longer treatment period would be of use in further studies. Also as noted in the supplemental analysis, baseline cytokine levels did not significantly correlate with the physical and cognitive measures, though correlations between IL-6 and TNF-related cytokines have been previously reported, particularly in larger population studies [25–28]. This lack of correlation may be related to the smaller sample-size, and relatively short treatment period, and highlights the need for careful selection of cognitive and physical function measures that are sufficiently sensitive to detect effects during early phase trials.
One of the motivations for the present study was the need to identify potential treatments for CI that have more favorable side effect profiles when compared to current anti-inflammatory
Physiology International108 (2021) 1, 121–136 133
medications. In this setting, our results demonstrate that lactoferrin had good tolerability and few side effects. This is supported by the observation that 18 of 18 participants in the treatment arm completing intervention. It is notable that participants in the placebo arm had more gastrointestinal side effect, and about a third of participants in the placebo arm discontinued their study regimen due to side effects. The manufacturer’s certification of both rhLf and placebo tablets list the same inert materials, which leaves two possibilities–either the increased quantity of these inert substances in placebo tablets (in the absence of rhLf content) promoted the gastrointestinal side-effects, most prominently diarrhea, or rhLf was protective against gastrointestinal distress caused by the capsules. The latter case would be consistent with lactoferrin’s previously described effect in gastrointestinal conditions, including reduction in late onset enterocolitis in preterm infants, and, in a more closely analogous patient population, the reduction in antibiotic associated diarrhea in long-term care patients receiving tube-feeding [19, 21].
Though there were no major side effects of treatment, pill-burden was mentioned as a side effect in both the placebo and treatment study arms. In this setting, were future studies to demonstrate a statistically significant effect of rhLf on CI, it would be important to identify the lowest effective dose as a means of promoting adherence.
In summary, this pilot trial of rhLF for the treatment of CI, although underpowered, pro- vides important rationale for additional studies of this agent and for the use of STNFR1 as a primary outcome measures for CI.
Declarations:Trial Registration Number: NCT02968992, registered November 11, 2016.
Funding:National Institute on Aging (NIA) R21 AG053681, the Johns Hopkins Older Amer- icans Independence Center P30 AG021334, and the Salisbury Family Foundation.
Conflicts of interest/competing interests:None.
Ethics approval:IRB approved study.
Consent to participate:All participants were consented prior to study participation.
Availability of data and materials:Study data available atClinicalTrials.gov(https://clinicaltrials.
gov/ct2/show/results/NCT02968992).
SUPPLEMENTARY MATERIAL
Supplementary data to this article can be found online at https://doi.org/10.1556/2060.2021.
00010
REFERENCES
1. Peters A, Delhey K, Nakagawa S, Aulsebrook A, Verhulst S. Immunosenescence in wild animals: meta- analysis and outlook. Ecol Lett 2019; 22: 1709–22.https://doi.org/10.1111/ele.13343.
2. Franceschi C, Campisi J. Chronic inflammation (inflammaging) and its potential contribution to age-asso- ciated diseases. J Gerontol A Biol Sci Med Sci 2014; 69: S4–9.https://doi.org/10.1093/gerona/glu057.
3. Sanada F, Taniyama Y, Muratsu J, Otsu R, Shimizu H, Rakugi H, et al. Source of chronic inflammation in aging. Front Cardiovasc Med 2018; 5: 12.https://doi.org/10.3389/fcvm.2018.00012.
4. Ferrucci L, Fabbri E. Inflammageing: chronic inflammation in ageing, cardiovascular disease, and frailty. Nat Rev Cardiol 2018; 15: 505–22.https://doi.org/10.1038/s41569-018-0064-2.
5. Smith AJP, Humphries SE. Cytokine and cytokine receptor gene polymorphisms and their functionality.
Cytokine Growth Factor Rev 2009; 20: 43–59.https://doi.org/10.1016/j.cytogfr.2008.11.006.
6. Dai L, Liu D, Guo H, Wang Y, Bai Y. Association between polymorphism in the promoter region of Interleukin 6 (-174 G/C) and risk of Alzheimer’s disease: a meta-analysis. J Neurol 2011; 259: 414–19.https://
doi.org/10.1007/s00415-011-6164-0.
7. Jurk D, Wilson C, Passos JF, Oakley F, Correia-Melo C, Greaves L, et al. Chronic inflammation induces telomere dysfunction and accelerates ageing in mice. Nat Commun 2014; 5: 4172.https://doi.org/10.1038/
ncomms5172.
8. Jo E, Lee S-R, Park B-S, Kim J-S. Potential mechanisms underlying the role of chronic inflammation in age- related muscle wasting. Aging Clin Exp Res 2012; 24: 412–22.https://doi.org/10.3275/8464.
9. Acosta JC, Banito A, Wuestefeld T, Georgilis A, Janich P, Morton JP, et al. A complex secretory program orchestrated by the inflammasome controls paracrine senescence. Nat Cell Biol 2013; 15: 978–90.https://doi.
org/10.1038/ncb2784.
10. VanderVeen BN, Fix DK, Carson JA. Disrupted skeletal muscle mitochondrial dynamics, mitophagy, and biogenesis during cancer cachexia: a role for inflammation. Oxid Med Cell Longev 2017; 2017: 3292087.
https://doi.org/10.1155/2017/3292087.
11. Ridker PM, Everett BM, Thuren T, MacFadyen JG, Chang WH, Ballantyne C, et al. Antiinflammatory therapy with canakinumab for atherosclerotic disease. N Engl J Med 2017; 377: 1119–31.https://doi.org/10.1056/
nejmoa1707914.
12. Ridker PM, Everett BM, Pradhan A, MacFadyen JG, Solomon DH, Zaharris E, et al. Low-dose methotrexate for the prevention of atherosclerotic events. N Engl J Med 2019; 380: 752–62. https://doi.org/10.1056/
nejmoa1809798.
13. Chung ES, Packer M, Lo KH, Fasanmade AA, Willerson JT. Randomized, double-blind, placebo-controlled, pilot trial of infliximab, a chimeric monoclonal antibody to tumor necrosis factor-a, in patients with mod- erate-to-severe heart failure. Circulation 2003; 107: 3133–40. https://doi.org/10.1161/01.cir.0000077913.
60364.d2.
14. Mann DL, McMurray JJV, Packer M, Swedberg K, Borer JS, Colucci WS, et al. Targeted anticytokine therapy in patients with chronic heart failure. Circulation 2004; 109: 1594–602.https://doi.org/10.1161/01.cir.
0000124490.27666.b2.
15. Pahor M, Anton SD, Beavers DP, Cauley JA, Fielding RA, Kritchevsky SB, et al. Effect of losartan andfish oil on plasma IL-6 and mobility in older persons. The ENRGISE pilot randomized clinical trial. J Gerontol A Biol Sci Med Sci 2018; 74: 1612–19.https://doi.org/10.1093/gerona/gly277.
16. Cooper C, Chapurlat R, Al-Daghri N, Herrero-Beaumont G, Bruyere O, Rannou F, et al. Safety of oral non- selective non-steroidal anti-inflammatory drugs in osteoarthritis: what does the literature say? Drugs Aging 2019; 36: 15–24.https://doi.org/10.1007/s40266-019-00660-1.
17. Moore SA, Anderson BF, Groom CR, Haridas M, Baker EN. Three-dimensional structure of diferric bovine lactoferrin at 2.8A resolution. J Mol Biol 1997; 274: 222–36.https://doi.org/10.1006/jmbi.1997.1386.
18. Rosa L, Cutone A, Lepanto M, Paesano R, Valenti P. Lactoferrin: a natural glycoprotein involved in iron and inflammatory homeostasis. Int J Mol Sci 2017; 18: 1985–85.https://doi.org/10.3390/ijms18091985.
Physiology International108 (2021) 1, 121–136 135
19. Pammi M, Suresh G. Enteral lactoferrin supplementation for prevention of sepsis and necrotizing entero- colitis in preterm infants. Cochrane Database Syst Rev 2017; CD007137.https://doi.org/10.1002/14651858.
cd007137.pub5.
20. Lepanto MS, Rosa L, Cutone A, Conte MP, Paesano R, Valenti P. Efficacy of lactoferrin oral administration in the treatment of anemia and anemia of inflammation in pregnant and non-pregnant women: an interven- tional study. Front Immunol 2018; 9: 2123.https://doi.org/10.3389/fimmu.2018.02123.
21. Laffan AM, McKenzie R, Forti J, Conklin D, Marcinko R, Shrestha R, et al. Lactoferrin for the prevention of post-antibiotic diarrhoea. J Health Popul Nutr 2012; 29: 547–51.https://doi.org/10.3329/jhpn.v29i6.9889.
22. Bharadwaj S, Naidu TAG, Betageri GV, Prasadarao NV, Naidu AS. Inflammatory responses improve with milk ribonuclease-enriched lactoferrin supplementation in postmenopausal women. Inflamm Res 2010; 59:
971–8.https://doi.org/10.1007/s00011-010-0211-7.
23. Schrack JA, Kuo P-L, Wanigatunga AA, Di J, Simonsick EM, Spira AP, et al. Active-to-Sedentary behavior transitions, fatigability, and physical functioning in older adults. J Gerontol A Biol Sci Med Sci 2018; 74:
560–7.https://doi.org/10.1093/gerona/gly243.
24. Navarro SL, Brasky TM, Schwarz Y, Song X, Wang CY, Kristal AR, et al. Reliability of serum biomarkers of inflammation from repeated measures in healthy individuals. Cancer Epidemiol Biomarkers Prev 2012; 21:
1167–70.https://doi.org/10.1158/1055-9965.epi-12-0110.
25. Cesari M, Penninx BWJH, Pahor M, Lauretani F, Corsi AM, Williams GR, et al. Inflammatory markers and physical performance in older persons: the InCHIANTI study. J Gerontol A Biol Sci Med Sci 2004; 59:
M242–8.https://doi.org/10.1093/gerona/59.3.m242.
26. Hsu FC, Kritchevsky SB, Liu Y, Kanaya A, Newman AB, Perry SE, et al. Association between inflammatory components and physical function in the health, aging, and Body composition study: a principal component analysis approach. J Gerontol A Biol Sci Med Sci 2009; 64A: 581–9.https://doi.org/10.1093/gerona/glp005.
27. Palta P, Xue Q-L, Deal JA, Fried LP, Walston JD, Carlson MC. Interleukin-6 and C-reactive protein levels and 9-year cognitive decline in community-dwelling older women: the women’s health and aging study II. J Gerontol A Biol Sci Med Sci 2014; 70: 873–8.https://doi.org/10.1093/gerona/glu132.
28. Newman AB, Sanders JL, Kizer JR, Boudreau RM, Odden MC, Zeki Al Hazzouri A, et al. Trajectories of function and biomarkers with age: the CHS all stars study. Int J Epidemiol 2016; dyw092–92.https://doi.org/
10.1093/ije/dyw092.