Please cite this work as:
Attila Gere, Dalma Radványi, Károly Héberger, Which insect species can best be proposed for human consumption?
Innovative Food Science and Emerging Technologies 52 (2019) 358–367 www.elsevier.com/locate/ifset
https://doi.org/10.1016/j.ifset.2019.01.016 Available online 28 January 2019
© 2019 Elsevier Ltd. All rights reserved
Which insect species can best be proposed for human consumption?
Attila Gerea,*, Dalma Radványib,Károly Hébergerc
a Szent István University, Faculty of Food Science, Sensory Laboratory, H-1118 Budapest, Villányi út 29-43, Hungary
b Centre for Agricultural Research, Hungarian Academy of Sciences, Plant Protection Institute, 2462 Martonvásár, Brunszvik utca 2, Hungary
c Plasma Chemistry Research Group, Research Centre for Natural Sciences, Hungarian Academy of Sciences, H-1117 Budapest, Magyar tudósok krt. 2, Hungary
* Corresponding Author:
Attila Gere, e-mail: gere.attila@etk.szie.hu; gereattilaphd@gmail.com
Keywords
Entomophagy; sum of ranking differences; multicriteria optimization; eating insects; proximate analysis
Abstract
Edible insects have become popular in the past few years not only in the scientific literature but in other media as well. One of the major advantages of entomophagy (eating insects) is said to be the great nutritional composition. Many sources report that insects (generally) have better nutritional characteristics than traditional protein sources. In our research, we aim to give a complete picture of the nutritional profile of insects using a multicriteria optimization method, sum of ranking differences. The materials we used are published results of different authors from the past few years. The proximate analysis tells that insects generally have a better nutritional profile than other meats. The situation is a bit different in the case of mineral content; hence some vegetables have excellent mineral sources but waxworm larvae were ranked in the first three. Additionally, waxworm larvae have the most similar amino acid pattern to the FAO recommendation for adults.
Earthworm, house cricket, and mealworm larvae showed the most promising vitamin content;
however, huge differences were observed between the developmental stages of insects. A detailed analysis of these differences on the example of mealworms showed that adults may present a better option from the nutritional point of view. Same measurements conducted by different authors on the same species show considerable differences; hence the comparison of the results of different publications is dubious and should be handled with care. Based on our results, insects have a promising nutritional profile and may become part of many food products in the future. Present status of knowledge allows to conclude; which insect is best suitable for human consumption.
1 Introduction
Entomophagy, or insect-eating, has become a new trend in food sciences since 2013 after FAO published its working paper entitled “Edible insects: future prospects for food and feed security”
(Arnold van Huis et al., 2013). Since then, the number of publications dealing with the potential use of insects as human food is continuously increasing year-by-year (Müller, Evans, Payne, &
Roberts, 2016). More and more events, clubs and consumer groups are formed, which all aim the promotion of entomophagy. Its popularity is due to the several benefits, researchers enumerate environmental aspects, social-, economic advantages and valuable nutritional profile of certain insect species.
Insects, or mini-livestock, require less space for husbandry due to their special needs and abilities (e.g. flying). While traditional livestock requires horizontal land, insects, e.g. crickets, are usually
bred in stocked boxes; hence vertical space is used more effectively. In countries, where insects are traditionally consumed, breeding is done using inexpensive materials in the backyards or in the household kitchen as well (Arnold van Huis et al., 2013). Land use of mealworm production was reported as 1.81-14.12 × lower compared to traditional proteins such as milk, chicken, pork, and beef (Oonincx & de Boer, 2012). Water requirement of insects is significantly lower compared to other protein sources. For example, cricket farming requires 2 liters water per gram of protein produced, while beef needs 112 liters (Gahukar, 2016). Agriculture is the leading contributor of total greenhouse gas (GHG) emission, which can also be moderated by replacing traditional proteins with insect-based alternatives. Compared to cows, insects produce significantly fewer amounts of GHGs, especially methane, carbon dioxide and nitrous oxide (Oonincx et al., 2011).
Consumption of insects can contribute to the reduction of agricultural land use and carbon footprint of current food production (Alexander et al., 2017).
Insects also have desirable characteristics from a nutritional point of view. Several articles deal with the nutritional composition of different insect species e.g. (Rumpold & Schlüter, 2013). The next issues are reported and available easily: proximate nutrient profile, amino acid content, vitamins, fatty acid and mineral content of selected species. A common conclusion is that insects have better nutritional profiles compared to traditional protein sources (Williams, Williams, Kirabo, Chester, & Peterson, 2016). Many authors agree on the benefits of using insects as an alternative or additional source of animal protein (Akhtar & Isman, 2018; Yen, 2009; Zielińska, Karaś, & Baraniak, 2018).
In spite of the tremendous number of articles promoting the beneficial characteristics of insects, there are some aspects, which obstruct their spread. Food safety authorities face new challenges when it comes to insects. Different insect species may carry microbial, chemical, parasitical or allergic hazards (Belluco et al., 2013). Furthermore, insects’ advantage of eating almost everything from waste to prepared feed gives a hardly controllable issue about their feed, which makes the work of food safety authorities even more complex. Another important issue is the consumer acceptance of insects as a food source in Western societies. Food neophobia (extreme or irrational fear from new food sources), disgust, sensory rejection, and beliefs are all against the acceptance of insect-based food products (Gere, Székely, Kovács, Kókai, & Sipos, 2017; Gere, Zemel, Radványi, & Moskowitz, 2018; La Barbera, Verneau, Amato, & Grunert, 2017; Shelomi, 2015).
As scientific literature collects more and more data about the nutritional benefits of insects, the available data enables researchers to conduct a detailed comparison of the nutritional profiles of insects and traditional protein sources. It has been suggested that the “term ‘insects’ is not a useful food category in discussions of health and nutrition” (Payne, Scarborough, Rayner, & Nonaka, 2016) due to the high variability of their nutritional profile and nutrient values. The different nutrient profile implies that some species should not be promoted as healthier than traditional meat alternatives (Payne et al., 2016).
There are, however, several factors, which influence the nutritional profile of mini-livestock. Eri silkworm (Samia ricinii) prepupae and pupae showed similar nutritional values regardless of their developmental stages and feed source (Longvah, Mangthya, & Ramulu, 2011). However, larvae and adult forms of mealworm (Tenebrio molitor) show large differences in their protein- (Finke, 2002) and fatty acid content (Ravzanaadii, Kim, Choi, Hong, & Kim, 2012). A review of food composition data for edible insects reported that even if there are numerous publications about nutritional data of edible insects, their quality is unfortunately low (Nowak, Persijn, Rittenschober,
& Charrondiere, 2016). Out of species and developmental stage, other factors can also influence the nutritional profile of the final product considerably, such as e.g. feed and origin of insects (Adámková et al., 2017; Fontaneto et al., 2011). The available data clearly show differences in nutritional values, protein and fatty acid content, vitamins etc. It is difficult to find an optimum from among the various deviating and sometimes contradictory factors. Multicriteria optimization is one of the possible solutions for the problem. The algorithm outlined below can cope with this optimization task without using subjective weighting schemes (Rácz, Bajusz, & Héberger, 2015).
In our study, we provide a methodology, which is able to compare insect species and traditional protein sources based on their nutritional profile such as proximate, mineral, fatty acid, vitamin and amino acid content. A secondary aim is to collect relevant data sources in order to analyze the nutritional profiles of insects reared in different countries in order to analyze the geographic dependency of insects.
2 Materials and methods 2.1 Materials
Although there are several published studies which present nutritional data of certain insect species (for a recent review, see Rumpold and Schlüter (2013)), the authors usually analyze a few species
and different nutrients. In order to create input tables required by multicriteria evaluation, such as sum of ranking differences (SRD), one needs multiple nutrients and species. Our literature overview resulted three publications, which have the desired characteristics: i) present more than six nutrients per table; ii) analyze the commonly consumed insect species; iii) lack of missing values.
From this point of view, Finke (2002) has multiple tables sufficient for the SRD analysis. Table 1 (proximate analysis), Table 2 (minerals), Table 3 (amino acids), Table 4 (Vitamins) and Table 5 (fatty acids) have been chosen for the analysis. However, the SRD methodology is entirely general i.e. it is not limited to the selected sources. Not only the nutrients but the number of species is also sufficient (between 8 and 9, depending on the analysis). In order to compare some of the presented nutrient data to other, commonly consumed protein sources, the USDA food database was used (USDA, 2018).
Since T. molitor is one of the most researched insects, data provided by Ravzanaadii et al. (2012) was used to evaluate the similarities and differences of nutritional data between T. molitor larvae and adult forms, excreta and exuvium.
In order to introduce the effect of origin on the nutritional quality of insects, the paper authored by Adámková et al. (2017) was used, which collected nutritional data of selected insects from different parts of the world. Detailed tables about the fatty acid content of three species (T. molitor, A. domesticus and G. assimilis) are presented and these will also be compared using the SRD method.
2.2 Methods
Sum of (absolute) ranking differences (SRD) was introduced by Héberger in 2010 (K Héberger, 2010). Recent investigations (Sipos, Gere, Popp, & Kovács, 2018; Stokes et al., 2018) emphasize that the SRD is not a plain distance metric, but a manifold algorithm including a data fusion step (as outlined by (Willett, 2013)) and validation steps as randomization test (Rücker, Rücker, &
Meringer, 2007) and k-fold cross-validation (Hastie, Tibshirani, & Friedman, 2011), as well.
SRD algorithm contains three stages: i) first a gold standard (benchmark) should be defined according to the features of the data set; mean, or median, minimum, maximum, a known standard, can all well serve as a benchmark. Then, ii) a column-wise comparison of the index vectors follows the calculation of (absolute) differences between standard and individual vector coordinates and
adding the differences for each object (samples, objects) together. These values are called SRD values and rank the individual variables (insect species arranged in the columns of the input matrix). All details of calculations are given in our earlier works (Károly Héberger & Kollár- Hunek, 2011) and (Kollár-Hunek & Héberger, 2013). The final move is the cross-validation, which assigns uncertainties to the SRD values.SRD values are normalized between 0 and 100 for easy comparability between various datasets. Input data tables of case studies are presented in the supplementary material (Table S1-S6).
3 Results and discussion
3.1 Case study 1 – proximate nutritional profile
In the first case study, the proximate nutritional profiles of different insect and traditional protein sources have been analyzed: protein, fat, fiber, ash, energy, saturated fatty acid content (SFA), monounsaturated fatty acid content (MUFA), polyunsaturated fatty acid content (PUFA) and the fat-protein ratio (CF:CP). Data was converted to g/100g dry matter except for Energy where kcal/100g was used, while CF-CP ratio is a dimensionless quantity.
Data of five insect species was obtained from Finke (2002); notations are given in brackets: Adult house crickets (Ad_a), house cricket nymphs (Ad_n) (Acheta domesticus), superworms (Zm) (Zophobas morio larvae), giant mealworm larvae (gTm), mealworm larvae (Tm_l) and adult mealworms (Tm_a) (Tenebrio molitor), waxworm larvae (Gm) (Galleria mellonella), and silkworm larvae (Bm) (Bombyx mori) (Finke, 2002). Nutritional data of beef, pork, chicken, egg, salmon and milk was obtained from the USDA database (USDA, 2018).
Sum of ranking differences (SRD) method requires a reference (benchmark) variable, which can be defined as a hypothetical best protein source according to the used features. This so-called
“Read” column was determined as follows: row maximum for protein, fiber, ash, MUFA and PUFA, while row minimums were calculated for fat, SFA and CF-CP ratio, which means that the hypothetical best food source is high in protein, fiber, ash MUFA and PUFA, but contains low amounts of fat, SFA and has low crude fat/crude protein ratio. Such a hypothetically “best” protein gives us a direction and enables us to find the protein, which is the most similar to it, such a way a multicriteria decision making is realized (Lourenço & Lebensztajn, 2018; Rácz et al., 2015).
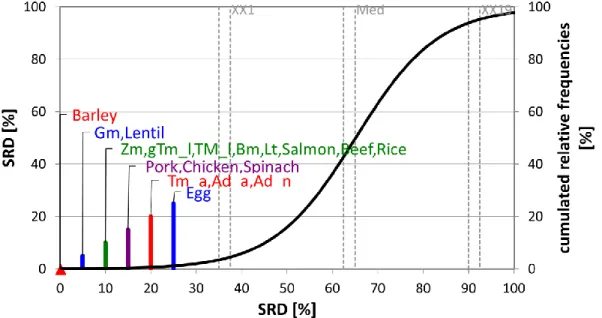
Results presented in Fig. 1 show that the lowest SRD value (e.g. protein closer to the hypothetical best) was provided by adult Tenebrio molitor (mealworm). Other developmental stages of T.
molitor (larvae and its giant form) provided similar SRD values than Acheta domesticus (house cricket) nymph and adult forms, which suggests that adult T. molitors have a desirable nutritional composition compared to its larvae form based on these data. Traditional proteins are located at the right part of the plot suggesting that their nutritional profiles are farther from the theoretical best one. Chicken, egg and salmon have lower SRD results, even lower than waxworm larvae (Gm), suggesting that Gm (even if it is an insect) is inferior. Larger SRD values were obtained by pork and beef, which was expected due to their high fat and SFA content. Milk is positioned after the 5% percentile (denoted by XX1), which indicates that its location is not significantly different from random ranking. It is also not surprising because milk is a liquid and because of this, its nutritional profile shows a different structure (higher water content, etc.) and SRD comparison of milk with conventional protein sources is affected by the special features: it will naturally be very different from a hypothetical best protein, which was determined based on mainly insects and meats.
Fig. 1. The SRD values (scaled between 0 and 100) of the proximate nutritional profiles determined by sum of ranking differences. An optimum protein source was used as reference (benchmark) column, which had the best possible characteristics of the nutrients analyzed.
Scaled SRD values are plotted on x axis and left y axis, right y axis shows the relative
frequencies of random ranking distribution function: black curve). The probability ranges are also given 5 % (XX1), Median (Med), and 95 % (XX19). Notations in brackets: Adult house
crickets (Ad_a), house cricket nymphs (Ad_n) (Acheta domesticus), superworms (Zm) (Zophobas morio larvae), giant mealworm larvae (gTm), mealworm larvae (Tm_l), adult mealworms (Tm_a) (Tenebrio molitor), waxworm larvae (Gm) (Galleria mellonella), and silkworm larvae (Bm) (Bombyx mori)
The relatively large difference between SRD=0 and ~16 (Tm_a) shows a possibility to find a better insect, another insect with a better profile.
3.2 Case study 2 – mineral content
Fig. 2. The SRD values (scaled between 0 and 100) as ranked by mineral content. An optimum protein source was used as reference (benchmark) column, which had the best possible
characteristics of the nutrients analyzed. Scaled SRD values are plotted on x axis and left y axis, right y axis shows the relative frequencies of random ranking distribution function: black curve).
The 5 % probability ranges (XX1), Median (Med), and 95 % (XX19) are also given. Notations in brackets: Adult house crickets (Ad_a), house cricket nymphs (Ad_n) (Acheta domesticus), superworms (Zm) (Zophobas morio larvae), giant mealworm larvae (gTm), mealworm larvae (Tm_l), adult mealworms (Tm_a) (Tenebrio molitor), waxworm larvae (Gm) (Galleria mellonella), and silkworm larvae (Bm) (Bombyx mori)
Table 2 of Finke (2002) presents the mineral content of selected insect species. Huge differences can be found between species when it comes to mineral content. For example, adult crickets and earthworms contain more than 400 mg/kg calcium, superworms and silkworms showed a moderate 177 mg/kg calcium content. Multicriteria optimization helps us determining, which species show desirable mineral composition. In this step, Ca, P, Mg, Na, K, Cl, Fe, Zn, Cu, Mn, I and Se data of the next insectsare compared: adult house crickets (Ad_a), house cricket nymphs (Ad_n) (Acheta domesticus), superworms (Zm) (Zophobas morio larvae), giant mealworm larvae (gTm), mealworm larvae (Tm_l) and adult mealworms (Tm_a) (Tenebrio molitor), waxworm larvae (Gm) (Galleria mellonella), earthworms (Lt) (Lumbricus terresstris) and silkworm larvae (Bm) (Bombyx mori). For minerals, the hypothetical best species was defined as the one containing the highest amounts of all minerals.
Fig. 2 presents the results of the mineral content analysis. Barley shows 0 SRDnorm value, meaning that its ranking is identical with the reference. On the second place, however, one can find Gm and lentil, showing that Gm is the most similar to the reference and is located before all the other animal or insect protein sources. Crickets (Ad_n and Ad_a) show higher SRDnorm values suggesting that even if their proximate nutritional profile is promising, there are better alternatives if it comes to mineral content.
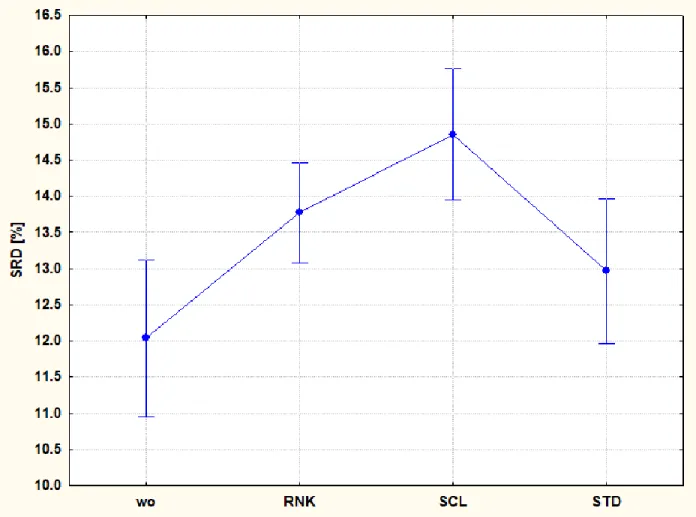
In order to test the consistency of the data set provided by Finke (2002), we used three different transformation methods: rank (RNK), scaling (SCL) and standardization (STD). After transforming the data sets, leave-one-out (LOO) cross-validation was carried out. LOO procedure helps to understand the effect of the deletion of the rows (here the minerals) on the final result and helps to assign reliable variance to the SRD values. In case of obtaining contradictory results from the three preprocessing variants, the ordering in the data set is not random and conclusions should be made with care. Fig. 3 shows that STD SCL and RNK transformations are somewhat different, but they show mainly the same tendency. RNK transformation provides middle values, but it is unable to differentiate between the first three and last four species. All three transformations agree on that adult Tenebrio molitor (Tm_a) has the lowest SRD values.
Fig. 3. Influence of data pre-processing: wo (without) and with rank transformation (RNK), range scaling (SCL) and standardization (STD). Normalized SRD values for the mineral content for nine insect species. Leave-one-out SRD confidence intervals of each transformation is plotted.
Validation of SRD showed that data transformation does not influence the final results considerably, hence the aggregated results of the three transformations were evaluated (Fig. 4).
Two arbitrary lines can be defined (red dashed lines) showing the natural grouping in the data.
Several species are located below the dashed red line, not only Tm_a. In order to distinguish between them, one-way analysis of variance with multiple post-hoc tests was conducted. Least significant difference, Bonferroni, Tukey and Scheffé tests agreed on the results that Salmon and Beef show the most desirable mineral patterns, however, Tm_a and Lt are the closest to them in terms of mineral content.
Fig. 4. Aggregated results of all three transformations rank (RNK), scaling (SCL) and standardization (STD) and without any. Lower SRD [%] values mean that the insect species is closer to the hypothetical best one. Notations are: adult house crickets (Ad_a), house cricket nymphs (Ad_n) (Acheta domesticus), superworms (Zm) (Zophobas morio larvae), giant mealworm larvae (gTm), mealworm larvae (Tm_l), adult mealworms (Tm_a) (Tenebrio molitor), waxworm larvae (Gm) (Galleria mellonella), earthworms (Lt) (Lumbricus terresstris) and silkworm larvae (Bm) (Bombyx mori).
3.3 Case study 3 – amino acid profile
Amino acids undoubtedly play an essential role in human nutrition; hence the amino acid content of insects is frequently reported in many articles e.g. (Martina Bednárová, Borkovcová, Mlcek, Rop, & Zeman, 2013; Ghaly & Alkoaik, 2009). Amino acid profile analysis was done based on the data provided by Table 3 of Finke (2002) but in this case, we used the recommended amino acid scoring patterns for adults as the reference for SRD (FAO, 2011). This way we can identify
those insect species, which have the most similar amino acid pattern to the recommended one. The reference column of the SRD input table was calculated as percentages of each recommended amino acid using the FAO report. This way we do not lose any information about the amount of each amino acid, but we can compare the amino acid patterns of the insects.
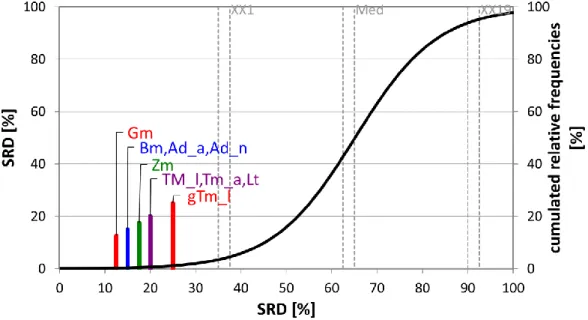
Fig. 5. The SRD values (scaled between 0 and 100) of the proteins determined by sum of ranking differences. Recommended amino acid scoring pattern for adults was used as reference
(benchmark) column. Scaled SRD values are plotted on x axis and left y axis, right y axis shows the relative frequencies of random ranking distribution function: black curve). The 5 %
probability ranges (XX1), Median (Med), and 95 % (XX19) are also given. Notations in brackets: Adult house crickets (Ad_a), house cricket nymphs (Ad_n) (Acheta domesticus), superworms (Zm) (Zophobas morio larvae), giant mealworm larvae (gTm), mealworm larvae (Tm_l), adult mealworms (Tm_a) (Tenebrio molitor), waxworm larvae (Gm) (Galleria mellonella), and silkworm larvae (Bm) (Bombyx mori)
Fig. 5 provides a clear rank, Gm larvae is the closest to the 0 SRD value, which means that waxworm larvae have the most similar amino acid pattern to the FAO recommendation for adults.
However, its SRD value is relatively high (SRDnorm=12,5), suggesting that even if it is the closest to the reference, there is plenty of room to find a better insect. Although the authors are aware, that insects as a child and infant food is not an option yet, SRD was run using the FAO
recommendations for children and infants also (data not shown). Similar results were obtained for children (Gm as the closest to the 0 SRD, followed by Bm, Ad_n and Ad_a), even the SRDnorm values were the same. For infants, insects on the first four places were the same in the same order, the SRD norm value of Gm proved to be somewhat lower (SRDnorm=10), indicating, that the amino acid profile of Gm is closer to the recommended pattern of infants than the one of adults’
and children’. This is due to the fact that infants need a higher ratio of valine than isoleucine, while the recommended amounts for adults and children are the same.
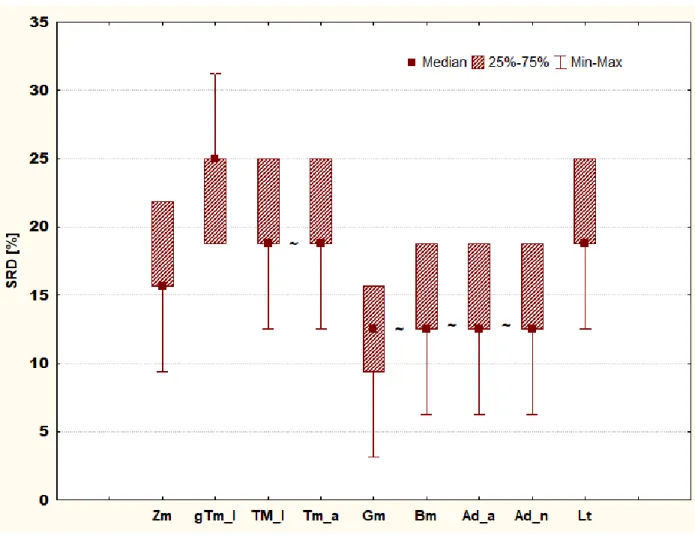
Fig. 6. Box and whisker plot of Case study 3. Sevenfold cross-validation of SRD values (%) are plotted on the y-axis. The non-significantly different methods are marked with the “~” symbol.
Notations in brackets: Adult house crickets (Ad_a), house cricket nymphs (Ad_n) (Acheta domesticus), superworms (Zm) (Zophobas morio larvae), giant mealworm larvae (gTm), mealworm larvae (Tm_l), adult mealworms (Tm_a) (Tenebrio molitor), waxworm larvae (Gm) (Galleria mellonella), and silkworm larvae (Bm) (Bombyx mori)
Fig. 6 presents the box and whiskers plot of the cross-validated SRD values (%), which strengthen the results of Fig. 5. Insects denoted by Gm, Bm, Ad_n and Ad_a have the lowest SRD values.
Gm does not differ significantly from the other three insects in the group. However, giant T.
molitor larva (gTm_l) is identified as the most differing one. Our results suggest that in the case of amino acid patterns, there are clear differences between the species but not between development stages, suggesting that the amino acid pattern does not change much during development. It is important to note, that in this case, we used percentages; hence the results do not give any information about amounts, only about ratio differences.
3.4 Case study 4 – vitamin content
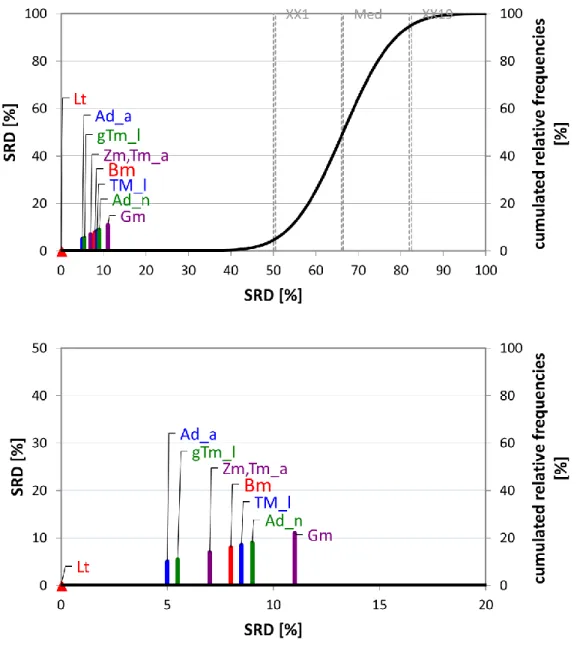
Data provided by Table 4 of Finke (2002) was used to compare the vitamin content of the selected insect species. Lumbricus terresstris (Lt) showed the highest vitamin content, the obtained SRDnorm value was 0, which means that Lt has always the same ranks as the reference column (Fig. 7). Reference values were chosen as the maximum values of the rows (vitamins). It has to be mentioned that SRD gives a clear ranking, even if there is a small difference between the samples.
The normalized SRD values were in a small range (0-11) suggesting that the evaluated species have highly similar vitamin composition to the references and to each other. In Case study 3 – amino acid composition, larva denoted by Gm showed SRDnorm=12.5 and was placed on the first rank. Differences between developmental stages can be observed, there is a significant difference between insects with notations of Ad_n and Ad_a, as well as between Tm_a and Tm_l. These suggest that, during development, vitamin content changes. The adult forms show smaller values (e.g. closer to the 0 SRD); hence, it is suggested to harvest adult insects if higher vitamin content is an important factor to be considered. The larva gTm_l might look like an exception but giant mealworms are mealworms treated with the juvenile hormone in order to break the reproductive cycle of insects, which means that giant mealworm larvae are older individuals.
Fig. 7. The SRD values (scaled between 0 and 100) of vitamin content. Maximum values of each vitamin concentrations were used as reference (benchmark) column. Scaled SRD values are plotted on x axis and left y axis, right y axis shows the relative frequencies of random ranking distribution function: black curve). The 5 % probability ranges (XX1), Median (Med), and 95 % (XX19) are also given. Notations are in brackets: Adult house crickets (Ad_a), house cricket nymphs (Ad_n) (Acheta domesticus), superworms (Zm) (Zophobas morio larvae), giant
mealworm larvae (gTm), mealworm larvae (Tm_l), adult mealworms (Tm_a) (Tenebrio molitor), waxworm larvae (Gm) (Galleria mellonella), earthworm (Lt) (Lumbricus terresstris) and
silkworm larvae (Bm) (Bombyx mori)
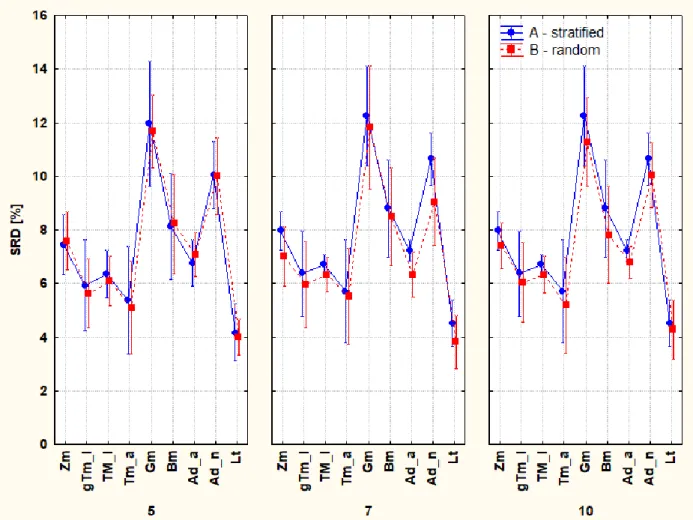
Cross-validation renders uncertainties to the SRD values (to the sharp colored columns in the figures). However, its realization can be done differently i) in a stratified way (blockwise) called k-fold cross-validation with or without repetitions, the former one is also called Monte Carlo resampling, or ii) by repeated random selection. However, cross-validation without repetitions can also be completed differently: Venetian blinds (123123123, etc.), contiguous blocks (111222333, etc.), random selection (e.g. 1132213332, etc.), where 1, 2 and 3 denotes the training, the validation and the test sets. These methods are also called leave-many-out cross-validation; however, a borderline case leave-one-out also exists, when all cases (samples, objects) are left out once and only once. After many repetitions, a large number of SRD values are obtained. Present work applied (A) and repeated random cross-validation (B). Analysis of variance (ANOVA) is able to decompose the effects of different variants of cross-validation and the different types of insects.
Now, our program is able to distinguish two types of cross-validation i) factor 1 (F1) has two levels (A = contiguous blockwise (stratified) selection; B= repeated random selection); ii) factor 2 (F2) is the k-fold cross-validation and has three levels 5-, 7- and 10-fold CV; and iii) factor 3 (F3) type of insects, with eight levels (the larva denoted by Lt is not suitable for an analysis of variance as it has no variability (SRD is always zero for Lt)) (Fig. 8).
If the ordering of vitamins has no structure, the Venetian blinds and contiguous block-wise (stratified) selection should provide the same results; hence it is sufficient to study only one of them.
Fig. 8. Vitamin content analysis. The three plots represent the 5-, 7-, and 10-fold cross
validations (k = 5, 7,10, respectively) done after stratified selection (A, blue lines) and repeated random selection (B, red lines) .Notations are: adult house crickets (Ad_a), house cricket nymphs (Ad_n) (Acheta domesticus), superworms (Zm) (Zophobas morio larvae), giant mealworm larvae (gTm), mealworm larvae (Tm_l), adult mealworms (Tm_a) (Tenebrio molitor), waxworm larvae (Gm) (Galleria mellonella), earthworms (Lt) (Lumbricus terresstris)and silkworm larvae (Bm) (Bombyx mori).
3.5 Case study 5 – detailed analysis of T. molitor
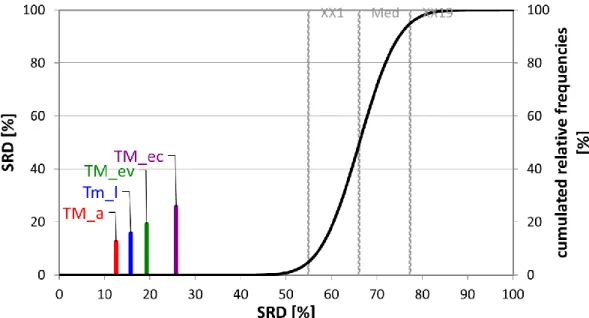
Case studies 1-4 focus on a given nutritional information and rank the species differently, which is a logical consequence of insect heterogeneity. There was no “perfect” insect (from a nutritional point of view) the “best” heavily depends on the nutrients evaluated. The question raises quickly, what happens if we collect all the data and conduct a global analysis. Case study 5 introduces this evaluation on the example of Tenebrio molitor. Detailed analysis of Tenebrio molitor (Tm) was
provided by Ravzanaadii et al. (2012). The authors provided a complete nutritional description of T. molitor larva and adult form as well as the exuvium and excreta. Proximate nutrient data, an amino acid -, mineral- and fatty acid content is also provided by the authors.
It should be mentioned that SRD is unable to handle weights in its present form; hence, all the included nutrients (rows in the input table) are handled as equally important. The authors of this manuscript are aware that different nutrients are not equally important; however, for the sake of comparison, we handle them equally. This way we provide a global picture about the differences between the development stage, the exuvium, and excreta. The global analysis revealed that the adult form of T. molitor has the most desirable nutritional characteristic, followed by larva (Fig.
9).
Fig. 9. The SRD values (scaled between 0 and 100) of the nutrient data determined by sum of ranking differences. Scaled SRD values are plotted on x axis and left y axis, right y axis shows the relative frequencies of random ranking distribution function: black curve). The 5 %
probability ranges (XX1), Median (Med), and 95 % (XX19) are also given. Notations are in brackets: adult (a), larva (l), exuvium (ev), excreta (ec).
If we compare these results to the previous ones, we need to take into account that the authors used samples from a different origin (the USA vs. the Republic of Korea) and there is a 10 years difference between the publications. In spite of these huge differences, it can be seen that based on the data provided by Finke (2002), adult T. molitor showed better characteristics than larva in the case of proximate nutrient profile and vitamins; however, larva proved to be better in the case of mineral content. Regarding the amino acid composition, previous results show that there is no difference, but it should be noted that Case study 3 uses the recommended amino acid scoring patterns for adults issued by FAO and in this case, we used different reference column.
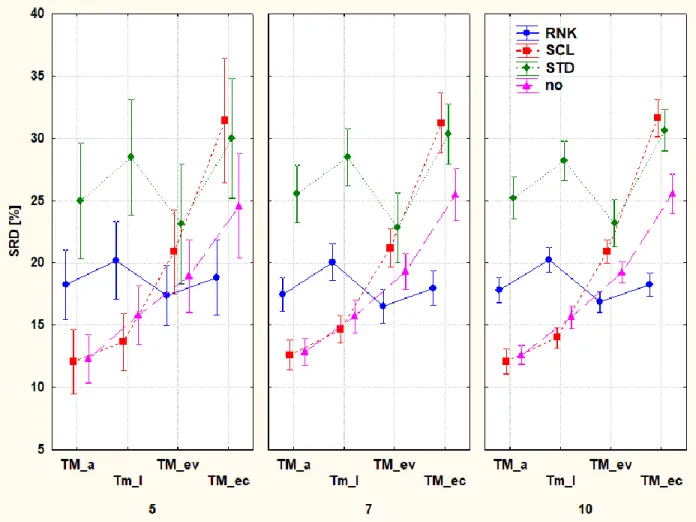
Fig. 10.Influence of data pre-processing: without transformation (no, purple triangle) and rank transformation (RNK, blue circle), range scaling (SCL, red square) and standardization (STD, green diamond). The three plots represent the 5-, 7-, and 10-fold cross validations (k=5, 7, 10, respectively). Notations are in brackets: adult (a), larva (l), exuvium (ev), excreta (ec). (For
interpretation of the references to colour in this figure legend, the reader is referred to the web version of this article.)
Exuvium and excreta have higher ranks as expected. Detailed analysis revealed that this is caused mainly by the lower amino acid content (data not shown). However, excreta have a surprisingly good fatty acid composition, it showed high amounts of unsaturated fatty acids and low amounts of saturated ones.
3.6 Case study 6 – origin
Case study 5 gave an interesting result when we compared the data of T. molitor of different origin.
In order to get a more detailed and reliable picture of the effect of origin, a simple comparison of two studies is not sufficient. A research article by Adámková et al. (2017) evaluated the nutritional profile of house crickets (Gryllus assimilis) and giant mealworms (Zophobas morio). The authors not only reported their results from Sumatra but collected fatty acid content of Zophobas morio from Brno (M. Bednárová, 2013), Marion (Finke, 2002) and Spain (Barroso et al., 2014). Fatty acid content of Tenebrio molitor from The Netherlands, Warsaw, Marion and Spain are also reported along with data of field cricket (Gryllus assimilis) and house crickets (Acheta domesticus) from Marion (Finke, 2002), The Netherlands (Tzompa-Sosa, Yi, van Valenberg, van Boekel, &
Lakemond, 2014) and Spain (Barroso et al., 2014).
Results presented by Fig. 11a shows that three groups can be formed by visual evaluation of SRD values. It can immediately be seen that some of the species do not differentiate from each other, they belong to the same cluster. Although the first three are all T. molitor samples, T. molitor can be found in almost all clusters (Fig. 11b). However, the first cluster consists of 5 samples out of which one is house cricket (Acheta domesticus, AD) from The Netherlands. Interestingly and reassuringly, samples from the same origin are located close to each other, e.g. TM from Spain or AD from Marion. These results suggest that origin (and study) has a stronger effect on the fatty acid composition than the species. This information raises the attention that insects should not be handled as one big source of food supporting the statement of (Payne et al., 2016): “term ‘insects’
is not a useful food category in discussions of health and nutrition” There are only a few studies, which provide robust data. There are, naturally, other sources of nutrient data such as USDA, AUSNUT or FAO/INFOODS, which all contain more or fewer insect species. However, as we
introduced in the present article, these should be used with caution due to the high variability between the sources.
Fig. 11. a) Aggregated results of all three transformations rank (RNK), scaling (SCL) and standardization (STD) and without any. Lower SRD [%] values mean that the insect species is closer to the hypothetical best one. b) Dendrogram of hierarchical cluster analysis (Euclidean distance, Ward’s method) run on the SRD values. Notations are: ZMSul (Zophobas morio, Sumatra, larva, Adámková et al., 2017), ZMBrl (Zophobas morio, Brno, larva, Bednárová, Borkovcová, Mlcek, Rop, & Zeman, 2013), ZMMal (Zophobas morio, Marion, larva, Finke, 2002), ZMSpl (Zophobas morio, Spain, larva, Barroso, Haro, Venegas, & Mart, 2013), TMSuP (Tenebrio molitor, Sumatra, pupa, Adámková et al., 2017), TMSul (Tenebrio molitor, Sumatra, larva, Adámková et al., 2017), TMNL (Tenebrio molitor, The Netherlands, Tzompa-Sosa, Yi, van Valenberg, van Boekel, & Lakemond, 2014), TMPo (Tenebrio molitor, Warsaw, Poland, Zielińska, Baraniak, Karaś, Rybczyńska, & Jakubczyk, 2015), TMMal (Tenebrio molitor, Marion, larva, Finke, 2002), TMSpl (Tenebrio molitor, Spain, larva, Sánchez-Muros, Barroso, & de Haro, 2016), TMSpl2 (Tenebrio molitor, Spain, larva, Barroso et al., 2013), TMMaA (Tenebrio molitor,
Marion, adult, Finke, 2002), GASuN (Gryllus assimilis, Sumatra, nymph, Adámková et al., 2017), GASpA (Gryllus assimilis, Spain, adult, Barroso, Haro, Venegas, & Mart, 2013), ADMaA (Acheta domesticus, Marion, adult, Finke, 2002), ADMaN (Acheta domesticus, Marion, nymph, Finke, 2002), ADNL (Acheta domesticus, The Netherlands, Tzompa-Sosa, Yi, van Valenberg, van Boekel, & Lakemond, 2014), ADSpA (Acheta domesticus, Spain, adult, Barroso, Haro, Venegas,
& Mart, 2013)
4. Discussion
Entomophagy is not a new issue. It started by the early humans (A. van Huis, 2017) and there are about 1900 species consumed in several countries around the world. It received increased scientific attention in the past few years and a high number of publications, books (scientific and cookbooks also) were published and conferences, meetings, workshops were held. Numerous startup companies were established in the USA and EU as well, which launched several food products containing insects in various amounts and forms. It is interesting to see; however, that only a few publications aim the nutritional profiles of insects. The published data is frequently not applicable for further data analyses. The majority of the publications lack important details, such as the feed of the analyzed insets, their developmental stage and, in some cases, even the used analytical methods are unclear. Presented data is inconsistent, in some cases, only a few nutritional data are present, which makes a comparison difficult between studies. In several cases, researchers aim to characterize one or two species (see e.g. Ssepuuya, Mukisa, and Nakimbugwe, 2017). Very few publications aim to compare the obtained results with traditional meat products and the authors of this publication were not able to find any studies, which conducted a complete nutritional comparison of insects and other protein sources.
Proximate analysis results show that insects are better alternatives compared to traditional proteins.
Although studying different species, but the same conclusions were drawn by Chakravorty et al.
(2014), where Chondacris rosea and Brachytrupes orientalis showed higher protein content compared to other proteins; however, their amino acid content was inferior. Insects should not be considered as major mineral sources. Huge differences are present between the minerals but their multicriteria optimization shows that they generally do not differ greatly from traditional proteins and barely and lentil may be a better option when it comes to minerals. The same results were presented in the cases of Oecophylla smaragdina and Odontotermes sp., which are preferred in
Arunachal Pradesh, India (Chakravorty, Ghosh, Megu, Jung, & Meyer-Rochow, 2016). However, the first study about the bioavailability of insects showed that insects contain higher amounts of biologically available iron (Latunde-Dada, Yang, & Vera Aviles, 2016).
The few studies, which aimed to compare the “healthiness” of insects to other meats concluded that insects are highly diverse and their nutritional profile is influenced by many factors (Payne et al., 2016). Our results show the same, species are the most influencing factor but developmental stage can also exert significant differences within species. In case of Blattodea species, adults were found to be better sources of protein, ash and calcium, but contained less fat compared to subadults (Kulma et al., 2016). Mealworms, for example, are also suggested to be consumed in adult form when the proximate nutritional profile is analyzed, while larvae could be a better choice when the mineral content is more important. On the other hand, the amino acid content shows similar patterns, but the complex analysis (all nutrients evaluated) puts adult form on the first place in the comparison. In a recent study, the effect of sex of Acheta domesticus species on their nutritional value was compared. The authors found that males contained lower energy and significantly less lipids, while more protein compared to females. On the other hand, amino acid content and fatty acid profile showed not significant differences (Kulma et al., 2019).
5. Conclusions
A multicriteria optimization of insect species’ nutritional data reveals the similarities and dissimilarities of insects from a nutritional point of view. Nutritional comparison of insects as traditional protein sources is hard to be completed because of the (partly) contradictory behavior of individual values. The sum of ranking differences method is able to compare species based on several nutritional components at once. Unfortunately, the different data sources do not make it possible to conduct a throughout nutrient analysis due to mostly missing values of many entries.
However, the provided meta-analysis shows that the superiority of insects as a protein source cannot be stated in every case; although, the general overview is promising. It is necessary to differentiate between insects and should not be handled as a whole, homogenous food source.
There are no “best” or “healthiest” insect species because the assessment of “best” heavily depends on the nutrients in question. For example, the proximate analysis shows that adult mealworms should be chosen, while waxworm larvae (Galleria mellonella) have the highest mineral content among the evaluated items.
Sum of ranking differences method gave robust and validated results; however, the quality of input data is essential. Unfortunately, numerous publications lack several details about the insect material they use. As our results suggest, studies from different parts of the world give significantly different nutrient results about the same species; hence further data and carefully designed experiments are needed to identify and to characterize the best insect species suitable for human consumption.
Acknowledgement
AG thanks the support of Premium Postdoctoral Researcher Program of Hungarian Academy of Sciences. DR thanks the support of GINOP-2.3.2-15-2016-00051. The authors thank the support of the National Research, Development, and Innovation Office of Hungary (OTKA, contract No K 119269).
References
Adámková, A., Mlček, J., Kouřimská, L., Borkovcová, M., Bušina, T., Adámek, M., … Krajsa, J. (2017). Nutritional potential of selected insect species reared on the island of Sumatra.
International Journal of Environmental Research and Public Health, 14(5), 1–10.
https://doi.org/10.3390/ijerph14050521
Akhtar, Y., & Isman, M. B. (2018). 10 - Insects as an Alternative Protein Source. In R. Y. Yada (Ed.), Proteins in Food Processing (Second Edition) (Second Edi, pp. 263–288). Woodhead Publishing. https://doi.org/https://doi.org/10.1016/B978-0-08-100722-8.00011-5
Alexander, P., Brown, C., Arneth, A., Dias, C., Finnigan, J., Moran, D., & Rounsevell, M. D. A.
(2017). Could consumption of insects, cultured meat or imitation meat reduce global agricultural land use? Global Food Security, (March), 1–11.
https://doi.org/10.1016/j.gfs.2017.04.001
Barroso, F. G., de Haro, C., Sánchez-Muros, M. J., Venegas, E., Martínez-Sánchez, A., & Pérez- Bañón, C. (2014). The potential of various insect species for use as food for fish.
Aquaculture, 422–423, 193–201. https://doi.org/10.1016/j.aquaculture.2013.12.024 Bednárová, M. (2013). Possibilities of Using Insects as Food in the Czech Republic. Mendel
University, Brno.
Bednárová, M., Borkovcová, M., Mlcek, J., Rop, O., & Zeman, L. (2013). Edible insects - Species suitable for entomophagy under condition of Czech Republic. Acta Universitatis Agriculturae et Silviculturae Mendelianae Brunensis, 61(3), 587–593.
https://doi.org/10.11118/actaun201361030587
Belluco, S., Losasso, C., Maggioletti, M., Alonzi, C. C., Paoletti, M. G., & Ricci, A. (2013).
Edible insects in a food safety and nutritional perspective: A critical review. Comprehensive Reviews in Food Science and Food Safety, 12(3), 296–313. https://doi.org/10.1111/1541- 4337.12014
Chakravorty, J., Ghosh, S., Jung, C., & Meyer-Rochow, V. B. (2014). Nutritional composition of Chondacris rosea and Brachytrupes orientalis: Two common insects used as food by tribes of Arunachal Pradesh, India. Journal of Asia-Pacific Entomology, 17(3), 407–415.
https://doi.org/10.1016/j.aspen.2014.03.007
Chakravorty, J., Ghosh, S., Megu, K., Jung, C., & Meyer-Rochow, V. B. (2016). Nutritional and anti-nutritional composition of Oecophylla smaragdina (Hymenoptera: Formicidae) and
Odontotermes sp. (Isoptera: Termitidae): Two preferred edible insects of Arunachal Pradesh, India. Journal of Asia-Pacific Entomology, 19(3), 711–720.
https://doi.org/10.1016/j.aspen.2016.07.001
FAO. (2011). Dietary protein quality evaluation in human nutrition. Auckland: FOOD AND AGRICULTURE ORGANIZATION OF THE UNITED NATIONS.
https://doi.org/978-92-5-107417-6
Finke, M. D. (2002). Complete nutrient composition of commercially raised invertebrates used as food for insectivores. Zoo Biology, 21(3), 269–285. https://doi.org/10.1002/zoo.10031 Fontaneto, D., Tommaseo-Ponzetta, M., Galli, C., Risé, P., Glew, R. H., & Paoletti, M. G.
(2011). Differences in fatty acid composition between aquatic and terrestrial insects used as food in human nutrition. Ecology of Food and Nutrition, 50(4), 351–367.
https://doi.org/10.1080/03670244.2011.586316
Gahukar, R. T. (2016). Chapter 4 - Edible Insects Farming: Efficiency and Impact on Family Livelihood, Food Security, and Environment Compared With Livestock and Crops A2 - Dossey, Aaron T. In J. A. Morales-Ramos & M. G. B. T.-I. as S. F. I. Rojas (Eds.) (pp. 85–
111). San Diego: Academic Press.
https://doi.org/https://doi.org/10.1016/B978-0-12-802856-8.00004-1
Gere, A., Székely, G., Kovács, S., Kókai, Z., & Sipos, L. (2017). Readiness to adopt insects in Hungary: A case study. Food Quality and Preference, 59, 81–86.
https://doi.org/10.1016/j.foodqual.2017.02.005
Gere, A., Zemel, R., Radványi, D., & Moskowitz, H. (2018). Consumer Response to Insect Foods. In Reference Module in Food Science (pp. 1–6). Elsevier.
https://doi.org/10.1016/B978-0-08-100596-5.21881-7
Ghaly, A. E., & Alkoaik, F. N. (2009). The yellow mealworm as a novel source of protein.
American Journal of Agricultural and Biological Science, 4(4), 319–331. Retrieved from https://www.scopus.com/inward/record.uri?eid=2-s2.0-
84949962636&partnerID=40&md5=68d3f71614762fa2249775227ba6c565
Hastie, T., Tibshirani, R., & Friedman, J. (2011). The Elements of Statistical Learning (2nd ed.).
New York, NY: Springer.
Héberger, K. (2010). Sum of ranking differences compares methods or models fairly. TrAC - Trends in Analytical Chemistry, 29(1), 101–109. https://doi.org/10.1016/j.trac.2009.09.009
Héberger, K., & Kollár-Hunek, K. (2011). Sum of ranking differences for method discrimination and its validation: comparison of ranks with random numbers. Journal of Chemometrics, 25(4), 151–158. https://doi.org/10.1002/cem.1320
Kollár-Hunek, K., & Héberger, K. (2013). Method and model comparison by sum of ranking differences in cases of repeated observations (ties). Chemometrics and Intelligent Laboratory Systems, 127, 139–146. https://doi.org/10.1016/j.chemolab.2013.06.007 Kulma, M., Kouřimská, L., Plachý, V., Božik, M., Adámková, A., & Vrabec, V. (2019). Effect
of sex on the nutritional value of house cricket, Acheta domestica L. Food Chemistry, 272, 267–272. https://doi.org/10.1016/j.foodchem.2018.08.049
Kulma, M., Plachý, V., Kouřimská, L., Vrabec, V., Bubová, T., Adámková, A., & Hučko, B.
(2016). Nutritional value of three Blattodea species used as feed for animals. Journal of Animal and Feed Sciences, 25(4), 354–360. https://doi.org/10.22358/jafs/67916/2016 La Barbera, F., Verneau, F., Amato, M., & Grunert, K. (2017). Understanding Westerners’
disgust for the eating of insects: The role of food neophobia and implicit associations. Food Quality and Preference, (October), 0–1. https://doi.org/10.1016/j.foodqual.2017.10.002 Latunde-Dada, G. O., Yang, W., & Vera Aviles, M. (2016). In Vitro Iron Availability from
Insects and Sirloin Beef. Journal of Agricultural and Food Chemistry, 64(44), 8420–8424.
https://doi.org/10.1021/acs.jafc.6b03286
Longvah, T., Mangthya, K., & Ramulu, P. (2011). Nutrient composition and protein quality evaluation of eri silkworm (Samia ricinii) prepupae and pupae. Food Chemistry, 128(2), 400–403. https://doi.org/10.1016/j.foodchem.2011.03.041
Lourenço, J. M., & Lebensztajn, L. (2018). Post-Pareto Optimality Analysis With Sum of Ranking Differences. IEEE Transactions on Magnetics, PP(99), 1–10.
https://doi.org/10.1109/TMAG.2018.2836327
Müller, A., Evans, J., Payne, C. L. R., & Roberts, R. (2016). Entomophagy and Power. Journal of Insects as Food and Feed, 2(2), 121–136. https://doi.org/10.3920/JIFF2016.0010 Nowak, V., Persijn, D., Rittenschober, D., & Charrondiere, U. R. (2016). Review of food
composition data for edible insects. Food Chemistry, 193, 39–46.
https://doi.org/https://doi.org/10.1016/j.foodchem.2014.10.114
Oonincx, D. G. A. B., & de Boer, I. J. M. (2012). Environmental Impact of the Production of Mealworms as a Protein Source for Humans – A Life Cycle Assessment. PLOS ONE, 7(12),
1–5. https://doi.org/10.1371/journal.pone.0051145
Oonincx, D. G. A. B., van Itterbeeck, J., Heetkamp, M. J. W., van den Brand, H., van Loon, J. J.
A., & van Huis, A. (2011). An Exploration on Greenhouse Gas and Ammonia Production by Insect Species Suitable for Animal or Human Consumption. PLOS ONE, 5(12), 1–7.
https://doi.org/10.1371/journal.pone.0014445
Payne, C. L. R., Scarborough, P., Rayner, M., & Nonaka, K. (2016). Are edible insects more or less ‘healthy’ than commonly consumed meats? A comparison using two nutrient profiling models developed to combat over- and undernutrition. European Journal of Clinical Nutrition, 70(3), 285–291. https://doi.org/10.1038/ejcn.2015.149
Rácz, A., Bajusz, D., & Héberger, K. (2015). Consistency of QSAR models: Correct split of training and test sets, ranking of models and performance parameters. SAR and QSAR in Environmental Research, 26(7–9), 683–700.
https://doi.org/10.1080/1062936X.2015.1084647
Ravzanaadii, N., Kim, S.-H., Choi, W. H., Hong, S.-J., & Kim, N. J. (2012). Nutritional Value of Mealworm, Tenebrio molitor as Food Source. Int. J. Indust. Entomol, 25(1), 93–98.
https://doi.org/10.7852/ijie.2012.25.1.093
Rücker, C., Rücker, G., & Meringer, M. (2007). y-Randomization and Its Variants in QSPR/QSAR. Journal of Chemical Information and Modeling, 47(6), 2345–2357.
https://doi.org/10.1021/ci700157b
Rumpold, B. A., & Schlüter, O. K. (2013). Nutritional composition and safety aspects of edible insects. Molecular Nutrition and Food Research, 57(5), 802–823.
https://doi.org/10.1002/mnfr.201200735
Sánchez-Muros MJ, Barroso FG, de Haro C (2016) Chapter 10 - Brief Summary of Insect Usage as an Industrial Animal Feed/Feed Ingredient. In: Dossey AT, Morales-Ramos JA, Rojas MG (eds) Insects as Sustainable Food Ingredients. Academic Press, San Diego, pp 273–309.
Shelomi, M. (2015). Why we still don’t eat insects: Assessing entomophagy promotion through a diffusion of innovations framework. Trends in Food Science and Technology, 45(2), 311–
318. https://doi.org/10.1016/j.tifs.2015.06.008
Sipos, L., Gere, A., Popp, J., & Kovács, S. (2018). A novel ranking distance measure combining Cayley and Spearman footrule metrics. Journal of Chemometrics, 32(4), e3011.
https://doi.org/10.1002/cem.3011
Ssepuuya, G., Mukisa, I. M., & Nakimbugwe, D. (2017). Nutritional composition, quality, and shelf stability of processed Ruspolia nitidula (edible grasshoppers). Food Science and Nutrition, 5(1), 103–112. https://doi.org/10.1002/fsn3.369
Stokes, T. D., Foteini, M., Brownfield, B., Kalivas, J. H., Mousdis, G., Amine, A., & Georgiou, C. (2018). Feasibility Assessment of Synchronous Fluorescence Spectral Fusion by
Application to Argan Oil for Adulteration Analysis. Applied Spectroscopy, 72(3), 432–441.
https://doi.org/10.1177/0003702817749232
Tzompa-Sosa, D. A., Yi, L., van Valenberg, H. J. F., van Boekel, M. A. J. S., & Lakemond, C.
M. M. (2014). Insect lipid profile: Aqueous versus organic solvent-based extraction methods. Food Research International, 62, 1087–1094.
https://doi.org/10.1016/j.foodres.2014.05.052
USDA. (2018). Food Composition Database. Retrieved from https://ndb.nal.usda.gov/ndb/
van Huis, A. (2017). Did early humans consume insects? Journal of Insects as Food and Feed, 3(3), 161–163. https://doi.org/10.3920/JIFF2017.x006
van Huis, A., Van Itterbeeck, J., Klunder, H., Mertens, E., Halloran, A., Muir, G., & Vantomme, P. (2013). Edible insects. Future prospects for food and feed security. Rome.
https://doi.org/978-92-5-107595-1
Willett, P. (2013). Combination of Similarity Rankings Using Data Fusion. Journal of Chemical Information and Modeling, 53(1), 1–10. https://doi.org/10.1021/ci300547g
Williams, J. P., Williams, J. R., Kirabo, A., Chester, D., & Peterson, M. (2016). Chapter 3 - Nutrient Content and Health Benefits of Insects. In A. T. Dossey, J. A. Morales-Ramos, &
M. G. Rojas (Eds.), Insects as Sustainable Food Ingredients (pp. 61–84). San Diego:
Academic Press. https://doi.org/https://doi.org/10.1016/B978-0-12-802856-8.00003-X Yen, A. L. (2009). Edible insects: Traditional knowledge or western phobia? Entomological
Research, 39(5), 289–298. https://doi.org/10.1111/j.1748-5967.2009.00239.x
Zielińska E, Baraniak B, Karaś M, et al. (2015) Selected species of edible insects as a source of nutrient composition. Food Res Int 77:460–466.
https://doi.org/10.1016/j.foodres.2015.09.008
Zielińska, E., Karaś, M., & Baraniak, B. (2018). Comparison of functional properties of edible insects and protein preparations thereof. LWT - Food Science and Technology,
91(February), 168–174. https://doi.org/10.1016/j.lwt.2018.01.058