The phosphatidic acid phosphatase lipin-1 facilitates inflammation-driven colon
carcinogenesis
Clara Meana, … , Jesús Balsinde, María A. Balboa
JCI Insight. 2018;3(18):e97506. https://doi.org/10.1172/jci.insight.97506.
Colon cancer is a devastating illness that is associated with gut inflammation. Here, we explored the possible role of lipin-1, a phosphatidic acid phosphatase, in the development of colitis-associated tumorigenesis. Azoxymethane and dextran sodium sulfate–treated (DSS-treated) animals deficient in lipin-1 harbored fewer tumors and carcinomas than WT animals due to decreased cellular proliferation, lower expression of antiapoptotic and
protumorigenic factors, and a reduced infiltration of macrophages in colon tumors. They also displayed increased resistance to DSS-induced colitis by producing less proinflammatory cytokines and experiencing less immune infiltration. Lipin-1–deficient macrophages from the colon were less activated and displayed lower phosphatidic acid phosphatase activity than WT macrophages isolated from DSS-treated animals. Transference of WT
macrophages into lipin-1–deficient animals was sufficient to increase colitis burden.
Furthermore, treatment of lipin-1–deficient mice with IL-23 exacerbated colon inflammation.
Analysis of human databases from colon cancer and ulcerative colitis patients showed that lipin-1 expression is increased in those disorders and correlates with the expression of the proinflammatory markers CXCL1 and CXCL2. And finally, clinically, LPIN1 expression had prognostic value in inflammatory and stem-cell subtypes of colon cancers. Collectively, these data demonstrate that lipin-1 is a critical regulator of intestinal inflammation and inflammation-driven colon cancer development.
Research Article Gastroenterology Inflammation
Find the latest version:
http://jci.me/97506/pdf
Conflict of interest: The authors have declared that no conflict of interest exists.
Submitted: September 14, 2017 Accepted: August 14, 2018 Published: September 20, 2018 Reference information:
JCI Insight. 2018;3(18):e97506.
https://doi.org/10.1172/jci.
insight.97506.
The phosphatidic acid phosphatase lipin-1 facilitates inflammation-driven colon carcinogenesis
Clara Meana,1,2 Ginesa García-Rostán,1 Lucía Peña,1,2 Gema Lordén,1,2 África Cubero,3 Antonio Orduña,3 Balázs Győrffy,4 Jesús Balsinde,1,2 and María A. Balboa1,2
1Instituto de Biología y Genética Molecular, Consejo Superior de Investigaciones Científicas (CSIC), Universidad de Valladolid, Valladolid, Spain. 2Centro de Investigación Biomédica en Red de Diabetes y Enfermedades Metabólicas Asociadas (CIBERDEM), Madrid, Spain. 3Departamento de Microbiología, Facultad de Medicina, Universidad de Valladolid, Valladolid, Spain. 4MTA-TTK Lendület Cancer Biomarker Research Group, Institute of Enzymology and Semmelweis University 2nd Department of Pediatrics, Budapest, Hungary.
Introduction
Colorectal cancer is nowadays the third most prominent form of cancer and the second cause of death in developed countries. The lack of therapies that can efficiently control the disease urges the explora- tion of novel avenues to find promising targets for new drugs. It is well established that chronic gut inflammation is a foundation for tumor initiation and progression (1). Patients with inflammatory bowel diseases, especially ulcerative colitis (UC), are at higher risk for colon cancer, and the use of antiinflammatory drugs reduces its incidence (2, 3). During the development of inflammation-associ- ated cancers, the interaction between the epithelial cells that harbor mutations in proto-oncogenes or tumor-suppressor genes, and the microenvironment enriched in proinflammatory mediators, benefit tumor growth (4). Mediators such as IL-23 activate mitogenic pathways that trigger the expansion of premalignant clones (5). Also, stimulation of the IL-23 receptor in innate and adaptive immune cells induces the production of IL-17 that, either directly or via induction of other inflammatory cytokines and chemokines, contributes to the generation of a tumor microenvironment in which tumor sup- pressive cells are repressed (6, 7). In this scenario, the recruitment of innate immune cells by chemo- kines such as CXCL1 or CXCL2 further contributes to exacerbating the protumorigenic environment (8). From these data it is clear that a better knowledge of the pathways implicated in the expression of proinflammatory genes in intestinal immune cells could help to design new strategies to restrain inflammation-associated malignancies.
Colon cancer is a devastating illness that is associated with gut inflammation. Here, we explored the possible role of lipin-1, a phosphatidic acid phosphatase, in the development of colitis- associated tumorigenesis. Azoxymethane and dextran sodium sulfate–treated (DSS-treated) animals deficient in lipin-1 harbored fewer tumors and carcinomas than WT animals due to decreased cellular proliferation, lower expression of antiapoptotic and protumorigenic factors, and a reduced infiltration of macrophages in colon tumors. They also displayed increased resistance to DSS-induced colitis by producing less proinflammatory cytokines and experiencing less immune infiltration. Lipin-1–deficient macrophages from the colon were less activated and displayed lower phosphatidic acid phosphatase activity than WT macrophages isolated from DSS-treated animals. Transference of WT macrophages into lipin-1–deficient animals was sufficient to increase colitis burden. Furthermore, treatment of lipin-1–deficient mice with IL-23 exacerbated colon inflammation. Analysis of human databases from colon cancer and ulcerative colitis patients showed that lipin-1 expression is increased in those disorders and correlates with the expression of the proinflammatory markers CXCL1 and CXCL2. And finally, clinically, LPIN1 expression had prognostic value in inflammatory and stem-cell subtypes of colon cancers. Collectively, these data demonstrate that lipin-1 is a critical regulator of intestinal inflammation and inflammation-driven colon cancer development.
R E S E A R C H A R T I C L E
Lipids are well established as key modulators of immune responses. Many of them function as bioac- tive extracellular and intracellular molecules that bind to membrane receptors or change the localization or activation of signaling proteins during immune cell activation (9, 10). Interestingly, de novo synthesis of lipids has also been described as an important event during the differentiation and activation of innate immune cells such as macrophages (11). While much effort has been devoted to demonstrating that lipid mediators like COX-2–derived prostaglandin E2 are important for tumor growth and development in the colon (12, 13), other lipids and their related enzymes, and more specifically, enzymes that drive de novo lipid synthesis, have received less attention in the context of gut inflammation and tumorigenesis.
During the last few years, our laboratory has been involved in delineating the role that a family of enzymes of the de novo lipid biosynthesis pathway, the lipins, has in proinflammatory responses (14–17).
Lipins possess phosphatidic acid (PA) phosphohydrolase activity that produces diacylglycerol (DAG).
Hence, they supply substrates for lipid synthesis, but also act to regulate the intracellular concentration of 2 key lipids during proinflammatory signaling, PA and DAG (16, 18, 19). Thus far, 3 different genes, LPIN1, LPIN2, and LPIN3, have been described that encode for lipin proteins with different patterns of expres- sion and function. The human and mouse gastrointestinal tract is the preferred tissue for the expression of LPIN3, while LPIN1 and LPIN2 are more highly expressed in other tissues (20). In an immune cell context, we have observed that the protein encoded by LPIN1, lipin-1, is primarily expressed in macrophages, where it influences TLR4-mediated events (16). Animals deficient in lipin-1 are protected from damage in models of systemic inflammation, by experiencing a reduced production of poised proinflammatory molecules (16). Interestingly, expression of IL-23 seems to be one of the proinflammatory factors most affected by lipin-1 during TLR4 activation of murine and human macrophages (16).
Based on these previous findings, we have investigated in this work the possible role of lipin-1 in the development of colitis and colitis-associated tumorigenesis. Our data suggest that in the gut, lipin-1 may act to amplify inflammation, thereby supporting tumor progression and cancer development.
Results
Lipin-1 deficiency attenuates inflammation-promoted tumorigenesis and carcinogenesis in a murine colitis-associated cancer model. To investigate the role of lipin-1 in colorectal tumorigenesis we used the well-known azoxymethane/dextran sodium sulfate (AOM/DSS) murine model, where tumor progression is driven by colitis (21). The carcinogenic progress in this model recapitulates the steps that take place during colitis-associated cancer in humans, from inflammation to dysplasia and then carcinogenesis (22). We observed that lipin-1–deficient animals lost significantly less weight than WT animals during treat- ments (Figure 1A). Examination of the colons at the end of the protocol revealed a very significant decrease in the number of tumors per animal, and in the percentage of animals harboring tumors in lipin-1–deficient animals (Figure 1, B–D). The decrease in the number of tumors affected both medial and distal colons (Figure 1, E and F). Also, the majority of tumors from WT animals had a size of 2 to 3 mm (45%), whereas the majority of tumors from lipin-1–deficient animals were less than 2 mm (75%) (Figure 1, D, F, and G). A detailed histological examination of tumor sections showed that, while in WT animals 46% of the tumors were carcinomas, in lipin-1–deficient animals just 4% of them were car- cinomas (Figure 2A). Importantly, while 75% of carcinomas were invasive in WT animals, we found no invasive carcinomas in lipin-1–deficient animals (Figure 2, A and B, and Supplemental Figure 1; supple- mental material available online with this article; https://doi.org/10.1172/jci.insight.97506DS1). In agreement with these data, the average number of mitoses in carcinomas from WT animals was nearly double that found in lipin-1–deficient animals (Figure 2C). Also, the proliferation marker Ki67 was more highly expressed in crypts from WT animals than from lipin-1-deficient animals (Figure 2D).
Evaluation of the presence of the antiapoptotic protein Bcl-2 showed enhanced expression in tumors and in nontumoral tissue from WT animals compared with lipin-1–deficient ones, suggesting a reduced resistance to apoptosis in the phosphatase-deficient colons (Figure 2E).
Analysis of mRNA levels for 3 well-known inflammatory protumorigenic factors, Il11, Il6, and Nos2, showed a relevant lower expression in tumors and adjacent areas from lipin-1–deficient mice compared with WT ones (Figure 2F and Supplemental Figure 1; protein data for IL-6 are shown in Supplemental Figure 2) (23). The same behavior was also found for Cxcl1 and Cxcl2, chemokines that are involved in the attraction of immune cells, angiogenesis, and dysplasia-carcinoma transition events in colorectal cancer (Figure 2F; protein data for CXCL1 are shown in Supplemental Figure 2) (8, 24). In agreement with all of
these data, phosphorylation of STAT3, a mediator of epithelial proliferation that is activated by different cytokines, was increased in WT tissues from tumor-harboring mice relative to lipin-1–deficient ones (Fig- ure 2, G and H) (25). These data suggest that lipin-1 positively influences tumor formation, growth, and progression in the large intestine.
Lipin-1 deficiency reduces macrophage infiltration in colon tumors. We next investigated the expression levels of lipin-1 in colon and colon tumors. In healthy murine colon tissues the expression of the phosphatase is not observable compared with the levels present in adipose tissue (Figure 3A). In tumors generated by AOM/DSS treatment, we observed that epithelial cells did not increase their lipin-1 content compared with normal epithe- lial cells, and also that the latter do not show appreciable phosphatase levels compared with a positive control such as hepatic cells (Figure 3B). In fact, WT and lipin-1–deficient tumors with similar levels of dysplasia were alike regarding lipin-1 expression in the epithelial compartment (Figure 3E). However, we detected lipin-1 expression in some stromal cells of the tumor, distinct from T or B lymphocytes (Figure 3, B and D). Because macrophages are a very important part of the stromal population that help in the growth and progression of tumors (1), we isolated tumor macrophages to study the expression of lipin-1 by immunoblot. As shown in Figure 3C, tumor macrophages express lipin-1 while, again, epithelial cells of the tumor do not.
Next, we evaluated the degree of immune infiltration in the tumors, and we found that the infil- tration of F4/80+ cells (macrophages) was lower in animals deficient in lipin-1. The infiltration of other immune cells like T cells did not change in the absence of the phosphatase (Figure 3, F and G).
Furthermore, we observed that in the tumors generated in lipin-1–deficient animals there were fewer Figure 1. Lipin-1 deficiency decreases tumorigenesis in a murine model of colitis-associated cancer (CAC). WT and lipin-1–deficient (fld) animals were treated with AOM/DSS as described in the Methods. (A) Weight change along the protocol is shown. Two separate experiments were done with similar results (n = 13). Data represent the mean ± SEM. (B) Number of polyps in the large intestine per animal at day 80 (n = 13). (C) Percentage of animals with polyps (n = 13). (D) Representative open colons from WT and fld animals after AOM/DSS treatment. (E) Polyps per animal in medial and distal colons (n = 7–8). Data represent the mean ± SEM. (F) Images of representative distal colons after CAC induction. (G) Tumor diameter distribution in WT and fld animals (n = 7–8). *P < 0.05; **P < 0.01 by 2-way ANOVA with Tukey’s post hoc test (A) or Student’s t test (B and E).
R E S E A R C H A R T I C L E
IL-6–producing macrophage-like cells than in tumors generated in WT animals, suggesting that these cells are less activated in the absence of lipin-1 (Supplemental Figure 2).
Overall, these studies suggest that in the colon, lipin-1 expression is restricted to the stromal compart- ment, with macrophages being part of this lipin-1–expressing population, and that tumors from animals Figure 2. Lipin-1 deficiency decreases carcinoma development in colon. WT and lipin-1–deficient (fld) animals were treated with AOM/DSS and tumors were analyzed at day 80. (A) Percentage of histopathological lesions (carcinoma, Ca). (B) Microscopic images of dysplasias (×10), and carcinomas (×4) with magnified insets (×10). (C) Number of mitoses found in tumors (n = 3–6). Data represent the mean ± SEM. (D) Ki67+ cells/crypt analyzed in the nontumor part of the colons.
More than 12 crypts/mice were scored (n = 5). (E) Images of nontumor and tumor parts of colons immunostained for Bcl-2. Original magnification was ×10, except for tumor images (×4). (F) Analysis by quantitative real-time PCR of the mRNA abundance of the indicated genes in tumors. Data represent the mean ± SEM. (G) Representative images of colons immunostained for phospho-STAT3. Original magnification was ×10. (H) Colon homogenates were analyzed for phospho-STAT3 and β-actin by immunoblot (n = 4). *P < 0.05; **P < 0.01 by Student’s t test.
Figure 3. Lipin-1 is expressed in tumor macrophages. (A) Homogenates from white adipose tissue (WAT) or normal colon tissue from WT animals were analyzed by immunoblot using specific antibodies against lipin-1 or β-actin as indicated. (B) Tumor contiguous sections from WT animals were stained with H&E (a) or stained by immunohistochemistry using specific antibodies against lipin-1 (b–e). Image panels show: (b) tumor epithelial cells, (c) normal epithelial cells, (d) tumor-infiltrating lymphocytes, (e) tumor stromal cells, and (f) liver (positive staining control for lipin-1). Original magnification, ×10 (a) and ×60 (b–f). (C) Homogenates from WAT, or isolated epithelial cells and macrophages from WT animal tumors were analyzed by immunoblot using specific antibodies against lipin-1 or GAPDH as indicated. (D) Tumor contiguous sections of the same tumor shown in B were stained by immunohistochemistry using antibodies against CD3e (T cells), CD45R (B cells), and lipin-1, as indicated. Original magnification, ×10 and ×60 for magnified insets (right). (E) Colon and tumor sections from WT and lipin-1–deficient (fld) animals were stained by IHC using antibodies against lipin-1. Normal epithelial cells and tumoral epithelial cells are shown. Original magnification, ×60. (F) Contiguous tumor sections from WT and fld animals were stained by IHC using antibodies against F4/80 (macrophages) or CD3e (T cells). Original magnification, ×10. (G) Tumor F4/80+ and CD3e+ infiltrated cells were quantified from tumor sections stained as in F and data are shown as percentage of positive cells with respect to total cells. Cells were counted in 3 different fields per tumor (n = 6 for WT and 5 for fld). ***P < 0.001 by Student’s t test.
R E S E A R C H A R T I C L E
deficient in lipin-1 have a decreased infiltration of macrophages.
Lipin-1–deficient animals are protected against DSS-induced colitis. To further define the role of lipin-1 in inflammation-driven tumorigenesis, a model of UC induced by oral DSS was evaluated. DSS causes dis- ruption of the epithelial colonic layer, which is followed by translocation of luminal bacteria to the mucosa and an acute inflammatory response marked by a massive infiltration of the mucosa with neutrophils and macrophages (26). Clinical symptoms of the disease are diarrhea, rectal bleeding, and weight loss that cor- relate with the pathological changes in the colon (27). Treatment of mice with 3% DSS promoted a severe weight loss in WT animals, but it affected lipin-1–deficient animals more modestly (Figure 4A). Disease activity index (DAI), which determines stool consistency and presence of blood in the stools, also revealed that lipin-1–deficient animals had a less severe disease than WT ones (Figure 4B). A detailed histological analysis consistent with the gross findings showed that colonic injury was more aggressive and widespread in WT DSS-treated than in lipin-1–deficient DSS-treated mice (Figure 4, C–E). While the latter exhibited small, superficial, broad-based mucosal ulcers and moderate architectural distortion and/or destruction of glands, the former exhibited huge, superficial, broad-based mucosal ulcers and severe crypt damage with more than 75% of crypts and surface epithelium lost. Taking into account all of these features, the total histology score was much higher in WT animals than in lipin-1–deficient ones (Figure 4E). Furthermore, a hallmark of proinflammatory signaling activation, phosphorylation of ERK1/2 (also known as p44/42 MAPK), was markedly reduced in colons deficient in lipin-1 (Figure 4F).
Because development of DSS-induced colitis occurs along with an exacerbated production of proinflam- matory factors (26, 27), inflammatory gene expression was examined in DSS-treated animals. Compared Figure 4. Lipin-1–deficient animals are protected against DSS-induced colitis. WT and lipin-1–deficient (fld) animals were treated with 3% DSS. (A and B) Weight change and DAI score measured during DSS treatment. Experiments were performed 5 times (n = 5–10). Data represent the mean ± SEM.
(C) Representative images of H&E-stained colon sections 8 days after DSS treatment initiation. Original magnification, ×10. (D and E) Colonic histology scores and total colonic histology score were calculated as indicated in the Methods (n = 5). Data represent the mean ± SEM. (F) Colon homogenates were analyzed for phospho-ERK1/2 (p-p44/42) and total ERK1/2 (p44/42) content by immunoblot. *P < 0.05; **P < 0.01;***P < 0.001 by 2-way ANOVA with Tukey’s post hoc test (A and B) or Student’s t test (D and E).
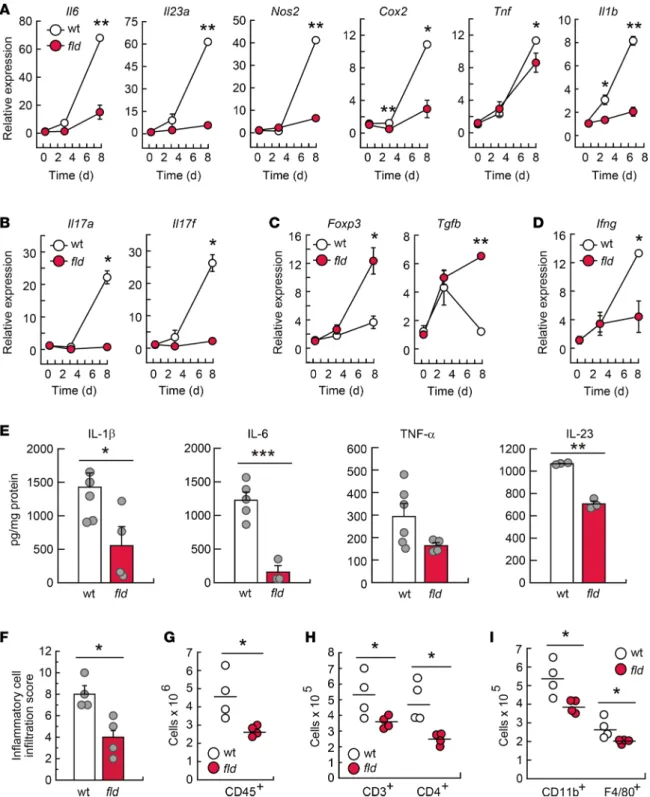
with WT colons, tissues from lipin-1–deficient animals showed lower expression of the genes Il6, Il23a, Nos2, Cox2, Tnf, Il1b, Cxcl1, and Il10, and their protein products (Figure 5, A and E, and Supplemental Figure 3), which are typically upregulated during inflammatory reactions by innate immune cells. Colons from lipin-1–
deficient animals were also found to exhibit lower levels of the Th17 cell activation products Il17a and Il17f, and also of the Th1-associated molecule Ifng, all of which are known to be pathogenic in inflamed colon (Fig- ure 5, B and D) (28). Interestingly, we observed an increased expression of the Treg cell marker Foxp3 and the associated cytokine Tgfb in colons where lipin-1 was absent, a population of CD4+ cells that helps maintain intestinal homeostasis (Figure 5C) (28, 29). These experiments suggest that lipin-1 impacts on proinflamma- tory activation during the development of DSS-induced colitis by increasing pathogenic innate and adaptive responses and restraining protective ones.
Histological evaluation of inflammatory cell infiltration into the colon revealed that WT animals expe- rienced a higher immune infiltration than that of lipin-1–deficient ones during DSS treatment (Figure 5F).
Closer analysis by flow cytometry showed that DSS-treated colons from lipin-1–deficient mice had signifi- cantly reduced accumulation of cells expressing the leukocyte marker CD45 (Figure 5G), the lymphocyte markers CD3 and CD4 (Figure 5H), and the myeloid cell markers CD11b and F4/80 (Figure 5I). There were no differences in the accumulation of cells expressing CD45R, CD8, Gr1, or CD11c (Supplemental Figure 4). These data indicate that lipin-1 plays a role in immune infiltration during the development of colitis, allowing an increased lymphocytic and myeloid infiltration.
Expression of lipin-1 in macrophages is sufficient to increase the severity of colitis in lipin-1–deficient animals.
Since innate immunity plays a key role in DSS-induced colitis (26, 27), and lipin-1 affected both the amount of F4/80+ cells present in inflamed colons (Figure 5I) and the proinflammatory activation of mac- rophages (16), we investigated next whether lipin-1 expression in macrophages is intrinsically involved in the development of colitis. To test this hypothesis we first isolated macrophages from the colons of DSS- treated animals and analyzed the production of several cytokines that are involved in the development of colitis. We found that IL-1β, TNF-α, and IL-6 were all produced in lesser amounts by lipin-1–deficient colonic macrophages (Figure 6A). We also found that lipin-1–deficient macrophages displayed lower PA phosphohydrolase 1 (PAP-1) activity than WT ones (Figure 6B), a result that could explain the effects observed in cytokine production (16).
Secondly, we used adoptive transfer techniques (30, 31). Transference of lipin-1–deficient macrophages into WT animals reduced disease severity, weight loss, and histology score during DSS treatment of ani- mals, albeit the effect did not reach statistical significance (Figure 6, C–F). However, transference of WT macrophages into lipin-1–deficient mice promoted significant increases in weight loss, disease activity, and histology score that approached the levels observed for WT animals (Figure 6, C–F). This is consistent with the idea that WT macrophages possess an increased potential to produce damaging proinflammatory fac- tors compared with macrophages deficient in lipin-1. Of note, during the transference of macrophages the animals still have their own macrophages, which explains why WT animals that received lipin-1–deficient macrophages still develop severe colitis.
Overall, these results suggest that selective expression of lipin-1 in macrophages is sufficient to augment colitis severity.
Lipin-1 does not have an intrinsic role in T lymphocytes. Next, we investigated whether lipin-1 could also have an intrinsic role in the biology of T lymphocytes that could partially explain the observed pheno- type during colitis development in lipin-1–deficient animals. To this end, we studied the possible role of lipin-1 during T cell activation and proliferation by the classical engagement of the T cell receptor–asso- ciated complex CD3 and the costimulating receptor CD28. We observed that T cells deficient or not in lipin-1 responded equally well by expressing similar levels of the inducible cell surface glycoprotein CD69, acquired during lymphoid activation (Supplemental Figure 5, A and B). Further, after 6 days of activation, T cells expressing lipin-1 display the same proliferation levels as cells that do not express lipin-1 (Supple- mental Figure 5, C and D).
Altogether, these data suggest that lipin-1 has no role in T cell activation and proliferation, which is in accordance with the low levels of lipin-1 found in these cells compared with other immune cells such as macrophages (16). These data make it unlikely that T cell lipin-1 participates in the development of colitis.
Reduced colitis in lipin-1–deficient animals is due to decreased IL-23 production. IL-23 plays an essential role in driving experimental colitis (28, 29) by supporting the expansion and maintenance of Th17 cells (28), and restraining Foxp3+ Treg populations (25, 28). Because IL-23–associated responses (Th17- and
R E S E A R C H A R T I C L E
Figure 5. Lipin-1 deficiency reduces DSS-induced inflammation in colon. WT and lipin-1–deficient (fld) animals were treated with DSS as indicated in the Methods. (A–D) Analysis by quantitative real-time PCR of the mRNA content for the indicated molecules in colon tissues. The amount of each mRNA in the colons of untreated mice was given an arbitrary value of 1 (n ≥ 3). (E–I) Studies were performed at day 8 after treatment initiation. (E) Colon homogenates were used for cytokine quantification using specific ELISAs as indicated (n ≥ 3). (F) Histological evaluation of inflammatory cell infiltration into colonic tissues (n = 4). In A–F data represent the mean ± SEM. (G–I) Lamina propria cells were analyzed by flow cytometry. (G) Total leukocytes are shown as CD45+ cells (n = 4). (H and I) CD45+ cells were gated and total CD3+ and CD4+ cells (H) or total CD11b+ and F4/80+ myeloid cells (I) are shown (n = 4). *P < 0.05; **P < 0.01; ***P < 0.001 by Student’s t test.
Treg-dependent cytokines), as well as Il23 mRNA levels, were affected by lipin-1 expression (Figure 5, B and C), we assessed whether just restoring IL-23 levels could increase colitis severity in lipin-1–
deficient animals. To this end, recombinant IL-23 was administered daily to animals with or without DSS treatment. Exogenous IL-23 caused no mucosal damage to non–DSS-treated mice (Figure 7A and Supplemental Figure 6A). Of note, treatment with IL-23 in combination with DSS induced a higher level of transmural colonic damage, larger mucosal ulcers, and greater inflammatory cell infiltration than those in lipin-1–deficient mice treated with DSS only (Figure 7, A–D). Furthermore, administra- tion of IL-23 to DSS-treated lipin-1–deficient mice increased the levels of mRNA for Il17a as well as other injury markers such as Tnf, Il1b, and the chemokines Cxcl1 and Ccl2 (Figure 7E). These effects Figure 6. Lipin-1 expression level in macrophages determines colitis severity. (A and B) Macrophages isolated from DSS-treated WT and lipin-1–deficient (fld) mouse colons were used for quantification of the indicated cytokines by spe- cific ELISAs (n = 3) (A), or for quantification of PAP-1 activity, as indicated in the Methods (n = 4–6) (B). Data represent the mean ± SEM. (C–F) WT and fld animals were subjected to macrophage transference during the treatment with DSS, as mentioned in the Methods. Weight change (C), DAI score (D), total histology score (E), and images of H&E-stained colon sections (F) 8 days after DSS treatment initiation are shown (n = 4–5 animals/group). In E, data represent the mean ± SEM. *P < 0.05; **P < 0.01; ***P < 0.001 by Student’s t test (A and B) or 1-way ANOVA with Tukey’s post hoc test (C–E). In F, original magnification was ×10.
R E S E A R C H A R T I C L E
were not found in IL-23–treated WT animals (Supplemental Figure 6). Moreover, administration of IL-23 during AOM/DSS treatment increased tumor loading in lipin-1–deficient animals (Figure 7F).
These results suggest that the decreased production of IL-23 in lipin-1–deficient animals is, at least in part, responsible for the lower level of colonic damage encountered during DSS treatment, and also for tumor development.
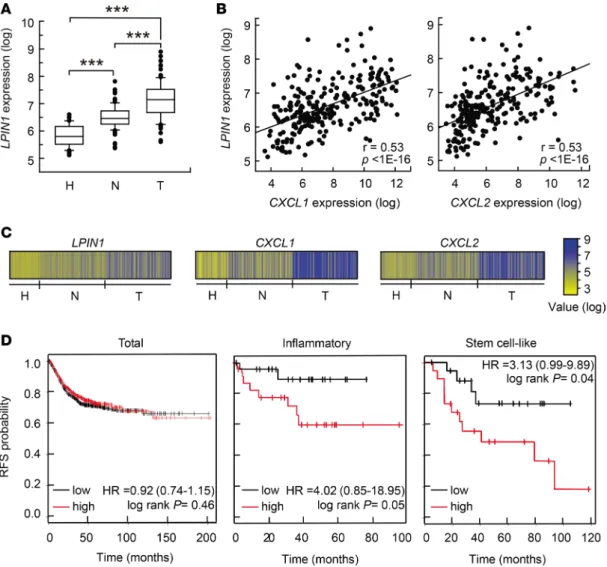
Lipin-1 expression increases in human colon cancers and UC, and is a marker of poor prognosis in inflammatory colon cancers. Next, we investigated whether our findings could be relevant to the pathogenesis of human colon cancer and UC. First, we analyzed LPIN1 expression in relevant microarray data sets that are pub- licly available. In 3 independent clinical data sets we found that LPIN1 expression levels were increased in adenocarcinomas when compared with corresponding paired adjacent mucosa, or compared with colon mucosa from healthy subjects (Figure 8, A and C, and Supplemental Figure 7, A and C) (32–34). We next investigated the correlation between the expression of LPIN1 and several proinflammatory or chemokine genes. Interestingly, LPIN1 expression correlates with CXCL1 and CXCL2, with P less than 1 × 10–16 in some Figure 7. IL-23 increases susceptibility to DSS-induced inflammation in lipin-1–deficient animals. Lipin-1–deficient ani- mals were treated with DSS, with or without a daily injection with 400 ng recombinant IL-23, for 6 days. (A) Representa- tive images of H&E-stained colon sections. Original magnification, ×10. (B) Colonic histological scores (n = 5). (C) Colonic total histology score (n = 5). (D) Inflammatory cell infiltration into colonic tissues (n = 5). (E) Abundance of mRNA for the indicated genes analyzed by quantitative real-time PCR. The amount of each mRNA in colons treated with DSS only was given an arbitrary value of 1 (n = 4). (F) Tumors/animal after AOM/DSS treatment with or without IL-23 administration as indicated in the Methods (n = 4). Data in B–E represent the mean ± SEM. *P < 0.05; **P < 0.01 by Student’s t test.
databases (Figure 8, B and C), and also strongly correlates with IL6, PTGHS2/COX2, NOS2, and IL23A in other databases (Supplemental Figure 7, B and D). We performed a meta-analysis of relapse-free survival in 10 data sets comprising 1,251 patients (GSE38832, GSE17538, GSE37892, GSE41258, GSE39582, GSE14333, GSE33114, GSE12945, GSE31595, and GSE29621). We did not observe any relevant correla- tion between LPIN1 expression level and relapse-free survival using all the tumors (Figure 8D). However, if tumors were discriminated according to their cellular phenotype (247 tumors) (35), we found that high LPIN1 expression in inflammatory tumors significantly correlated with shorter relapse-free survival com- pared with low-LPIN1-expressing tumors (Figure 8D). A similar behavior was also found for stem cell–like phenotype tumors (Figure 8D).
We also interrogated databases from patients with UC. In 2 independent data sets we found increased expression of LPIN1 in mucosa samples from UC patients compared with healthy subject samples (Supple- mental Figure 8, A and C) (36, 37). Also, a significant positive correlation was found between the expression of LPIN1 and the proinflammatory genes IL6 and NOS2 in those samples (Supplemental Figure 8, B and D).
Overall, these clinical results support the experimentally described role for LPIN1 in colonic inflam- mation during tumor development and further indicate that it may function to favor cancer progression in an inflammatory context.
Figure 8. Expression pattern of LPIN1 in human UC and colorectal cancer and prognostic values in cancer. (A–C) Analysis performed in the GSE44076 data set (246 colonic samples). (A) Box plots showing LPIN1 expression analysis in tissues from healthy donors (H, n = 50), and paired normal mucosa (N, n = 98) and tumor tissues (T, n = 98) from colorectal cancer patients. **P < 0.001 by 1-way ANOVA with Holm-Sidak post hoc test. (B) Scatter plot showing the correlation between LPIN1 and CXCL1 (left) or LPIN1 and CXCL2 (right) expression levels. Pearson’s coefficient tests were performed to assess statisti- cal significance. (C) Schematic showing log expression levels for LPIN1, CXCL1, and CXCL2 in all the samples from the GSE44076 data set. (D) Kaplan-Meier plots of relapse-free survival (RFS) of patients as end point, stratified by expression of LPIN1. Analysis of the total number of samples (n = 1,211), or inflammatory (n = 45) or stem cell–like (n = 38) cancer subtypes are shown. P value was calculated by a log-rank test.
R E S E A R C H A R T I C L E
Discussion
Inflammation, although necessary for damage repair and the battle against infections, can greatly impact proliferation, resistance to apoptosis, and cellular transformation to promote neoplasia. In fact, chron- ic inflammation is now recognized as an enabling characteristic of cancer. In the present study we have revealed how a lipid-related enzyme, lipin-1, modulates gut inflammation, and constitutes a pivotal player in the initiation and development of tumorigenesis and carcinogenesis in an inflammatory context (Figure 9). Also, our results show that the expression level of LPIN1 has a prognostic value in human inflammatory and stem-like types of colon cancers.
A striking finding of our study is the observation that lipin-1 influences dysplasia-carcinoma transi- tion events in mice. The effect may be due to the involvement of lipin-1 in the expression of CXCL1 and CXCL2. These chemotactic factors are not only important for attracting immune cells, but are also related to angiogenesis and dysplasia-carcinoma transition processes in colon cancers (8, 24, 38, 39).
Interestingly, one of the factors that regulates CXCL1/2 levels in tumors seems to be PGE2 (8, 14), a proinflammatory lipid generated from COX-2, the expression of which is also regulated by lipin-1 dur- ing DSS-induced colitis. It is known that during tumor development CXCL1/2 may recruit CXCR2- expressing myeloid-derived suppressor cells that have the capacity to inhibit CD8+ T cell cytotoxic activity against tumor cells, promoting in this way tumor growth and progression (8). Supporting our initial idea, we have also found a significant positive correlation between LPIN1 and CXCL1/2 expres- sion in human carcinomas.
Lipin-1 expression in tumors likely participates in the production of chemotactic factors CXCL1 and CXCL2 and, as a consequence, in the infiltration of myeloid cells (F4/80+, macrophages). Mac- rophages are components of the stromal compartment, where lipin-1 levels are the highest within the tumor. Since we have not found increased lipin-1 expression in colon tumoral epithelial cells versus nor- mal epithelial cells, the aforementioned observation would explain the increased expression of LPIN1 in human colorectal carcinomas that is reported in databases.
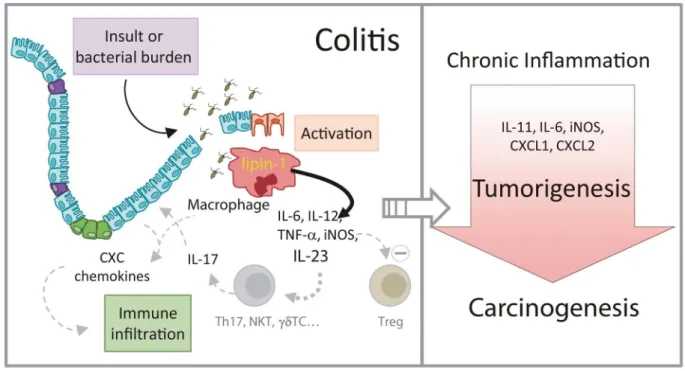
Figure 9. Schematic representation of the role of lipin-1 in colitis and colitis-associated tumorigenesis. Lipin-1 participates in the production of proinflammatory factors that help define the level of inflammation in the gut subsequent to an insult. IL-23 production is regulated by lipin-1. This cytokine participates in the production of IL-17, and enhances the generation of chemokines that increase immune infiltration and help to increase gut damage. As a result, animals that express lipin-1 develop severe colitis when exposed to insult. If colitis is maintained over time, tumors and carcinomas develop in the colon. During tumorigenesis, lipin-1 determines the levels of cytokines such as IL-11 or IL-6 that affect tumor epithelial cell proliferation, and also chemotactic factors like CXCL1 or CXCL2 that aid in immune cell infiltration into the tumor. In fact, lipin-1 expression in human colon cancers correlates with the expression on these 2 chemotactic factors, and has a prognostic value for these patients. The level of expression of lipin-1 in colon macrophages seems to be key in all of these processes.
In other types of human cancers such as prostate cancer or triple-negative breast cancer, increased lipin-1 expression levels have also been found relative to nontumoral tissues or to other types of cancer (40, 41). In fact, in triple-negative breast cancer there exists a positive correlation between LPIN1 expression in the tumor and poor prognosis for the patients, similar to what we have found in patients with colon cancer (40). However, in contrast to the colitis-associated cancer model that we have used, where tumor initiation and progression is mainly due to leukocyte infiltration and proinflammatory mediators (42), the initiation and progression of prostate cancer or triple-negative breast cancer are not strongly based on inflammatory events. In these cancers the role of lipin-1 seems to be relevant within the epithelial tumoral compartment regulating death/survival processes (40, 41). Although we cannot rule out that in human colon cancer lipin-1 also has a role in the maintenance of tumoral epithelial cells, our data support the idea that lipin-1 plays a role in the stromal/immune compartment during the development of colitis-associated cancers.
Further experimentation would be needed to elucidate whether lipin-1 expression in immune cells also plays a role in prostate and triple-negative breast cancers.
One of the important findings in the present study is that LPIN1 expression has a prognostic value for relapse-free survival in inflammatory and stem cell–like types of human colon cancers. The observation in human inflammatory colon cancers is supported by our experimental data in colitis and colitis-associated tumors in mice. However, the effect on a stem cell–like type of cancer was more unexpected, but clearly supports the idea that the more LPIN1 expression is present in the tissue, the higher the inflammation and hence, the higher the probability for tumor cells generated from stem or stem-like cells to thrive. In such a scenario, LPIN1 expression would serve for stratification of inflammatory and stem cell–like colorectal cancer patients, those with higher LPIN1 expression being the ones that would probably benefit the most from therapies to control inflammation.
During the development of colitis, lipin-1 determines the level of proinflammatory factors with high potential to influence the severity of the disease, including IL-23 (28, 43). Among other effects, IL-23 is known to support the expansion and maintenance of pathogenic Th17 cells and restrain Treg populations that help to maintain intestinal homeostasis (28, 43). The effect of IL-23 on Th17 and Treg responses depends on the presence of other important factors such as IL-6 and TGF-β (43). TGF-β favors Th17 cell development in the presence of IL-6, while in the absence of IL-6, Treg cell expansion is favored (28, 43). Lipin-1 aids in the expression levels of both IL-23 and IL-6, while it inhibits the expression of TGF-β. Thus, lipin-1, by regulating the TGF-β/IL-6 balance towards IL-6 in the presence of IL-23 seems to favor IL-17 pathogenic responses over Treg ones. These considerations are further supported by the results obtained from lipin-1–deficient animals treated with exogenous IL-23 during DSS-induced colitis, where IL-23 enhances IL-17 expression levels and increases disease severity. IL-23 has already been used in clinical trials as a target for inflammatory bowel diseases or colon cancer, although no definitive results are yet available. It is clear that targeting this cytokine could have the advantage of neutralizing pathogenic IL-17, but not protective IL-17 responses that are IL-23 independent in the gut (44). Based on our findings in human UC sample databases, we propose that stratification of UC patients by LPIN1 expression could be a sound approach to improve the success of therapies against IL-23.
Other proinflammatory factors such as Nos2/iNOS and Cox2/COX-2, whose expression depends on lipin-1, are also important for the development of colitis (45, 46). In fact, combined treatment with inhibi- tors for iNOS and COX-2 has maximal protective effect on chemically induced colitis models, supporting the idea that they might have some potential in the treatment of inflammatory bowel diseases (47). Lipin-1 could also exert its damaging effect via upregulation of these 2 enzymes. Furthermore, we have previously shown that, in human macrophages, decreased expression of lipin-1 blunts the activation of group IVA cyto- solic phospholipase A2 (14), the major enzyme regulating arachidonic acid mobilization from phospholipids for utilization by COX-2 (48). Thus, lipin-1 may regulate COX-2 activity by acting at 2 different levels, by controlling both the expression of the enzyme and the availability of substrate in inflammatory responses.
We demonstrate that lipin-1 greatly contributes to total cellular PA phosphatase activity of colon mac- rophages, indicating that the enzymatic activity of the protein is important for the production of proin- flammatory cytokines by these cells and, as a consequence, in colitis development. Interestingly, lipins also display a transcriptional coactivator activity that has been well demonstrated in the liver (49). We cannot rule out at this time that the transcriptional coactivator activity of lipin-1 plays a role in colitis and colon cancer, but there are several considerations that point to the idea that this might not be the case. For example, the PPAR transcription factors, downstream effectors of nuclear lipin-1 activity, have been shown
R E S E A R C H A R T I C L E
to protect from colitis by repressing NF-κB, thereby reducing inflammation in murine models (50). Lipin-1, acting as a transcriptional coactivator, upregulates genes that are related to fatty acid oxidation and mito- chondrial oxidative phosphorylation (49). These metabolic changes drive a macrophage antiinflammatory state (51). However, we show in this study and also in previous work (16) that, during colitis development, the greater the expression of lipin-1 by macrophages, the higher their proinflammatory state. Regarding colon tumorigenesis, PPARγ inhibits polyp development in the colon in a AOM/DSS model (52), but the role of other members of the PPAR family is less clear, and contradictory information exists (53). In vitro studies have shown that the nuclear function of lipin-1 does not restore the viability of a lipin-1–deficient triple-negative breast cancer cell line (40). Taking into account that some lipin-1 roles may be cell specific (49), future investigation should shed light on the possible nuclear function of lipin-1 during inflammatory/
tumorigenic processes in the gut.
It has been shown that some therapies against cytokines that are key in the development of colon can- cer, such as IL-6 (54) or TNF (55), have failed to produce clinical responses in recent trials. Taking this idea into account, it could be considered that inhibitors or treatments against molecules with the capacity to modulate multiple inflammatory pathogenic factors would have a higher probability of success in the battle against cancer. We have shown in this study that one of those molecules is lipin-1. Possible benefits that a therapy against lipin-1 could have include (a) inhibition of the production of CXCL1, CXCL2, IL-6, iNOS, and the potent tumorigenic factor IL-11, resulting in decreased immune infiltration and STAT3 activation;
(b) reduction of dysplasia-carcinoma transition events; and (c) reduction of the levels of the antiapoptotic protein Bcl-2. Also, and based on our results from DSS-induced colitis, it could be expected that a therapy against lipin-1, by restricting the expression of cytokines like IL-23, could result in beneficial effects as well for patients suffering from inflammatory bowel diseases.
Methods
Animals. BALB/cByJ-Lpin1fld/J mice were purchased from The Jackson Laboratory and bred in the Service of Animal Research and Welfare of the University of Valladolid, as previously described (16). Most of the experiments were conducted with 12-week-old female animals.
Colitis induction. Acute experimental colitis was induced by adding 3% (w/v) DSS, 36–50 kDa (MP Biomedicals, Inc.) to drinking water. Fresh DSS solution was prepared daily. Six days after initiation of treatment, animals were just kept on regular drinking water for 2 additional days. Control groups received regular drinking water during the whole experiment. Body weight and DAI were evaluated daily as an indirect measure of colitis severity. DAI was evaluated as the combined scores of weight loss, stool con- sistency, and fecal blood (27). At day 3 or 8 after induction of colitis, mice were sacrificed under ketamine and xylazine (100 mg/kg and 10 mg/kg, respectively) and cervical dislocation. The abdominal cavity was exposed and colons were removed, washed with PBS, and cut into pieces for further molecular analysis or fixed for histological examination.
Colitis-associated tumor induction. Tumor induction was assessed as previously described with minor modi- fications (21). Briefly, 12-week-old mice were i.p. injected with 7.5 mg/kg AOM (Sigma-Aldrich), and 5 days later they were treated with 3% DSS in drinking water for 5 days, followed by 15 days of regular drinking water. DSS treatment was repeated twice (total of 3 cycles). One month after the last DSS cycle (80 days from the initiation of the protocol) mice were sacrificed and polyps were counted and measured with a digi- tal caliper. Individual polyps were excised and processed for mRNA extraction or fixed in 10% buffered for- malin for histological examination. To study the effect of IL-23 administration in the generation of tumors, animals were i.p. injected with 400 ng recombinant IL-23 (Biolegend) every other day during the 5 days of treatment with DSS, for 3 cycles. The rest of the protocol for tumor induction was as described above.
Histological assessment of colonic damage. Colon specimens from both DSS and AOM/DSS experiments were excised near the ileocecal junction, washed in saline serum, fixed in 10% buffered formalin, embedded in paraffin, cut (3- to 4-μm-thick sections) and stained with H&E. Histological images were captured using a wide-field DM2000 microscope equipped with a DFC295 color camera (Leica) at ×10 magnification. Coli- tis scores were assigned based on the depth of injury (score 0–3); regenerative and metaplastic changes in glandular epithelium — nuclear enlargement, increased mitotic activity, appearance of occasional Paneth’s cells and/or marked decrease in cytoplasmic mucin (score 1–4); architectural distortion/irregular shape and/or destruction of glands (score 0–4); superficial broad-based mucosal ulcers (score 0–3); and inflam- matory infiltration (score 0–3) (56). The sum of the average values obtained for each scoring was multiplied
by a factor indicating the percentage of colonic length involved (score 0–4) (56). For immunohistochemical analysis, paraffin-embedded tissues were cut into 5-μm sections and stained with antibodies against F4/80 (Bio-Rad, MCA497), Ki67 (Master Diagnostica, 0003110QD), Bcl-2 (Abcam, ab182858), phospho-STAT3 (Cell Signaling Technology, 9145), CXCL1 (Mybiosource, MBS840366), IL-6 (eBioscience, MP5-20F3), lipin-1 (14), CD3e (Santa Cruz Biotechnology, sc-1127), and CD45R (BD Biosciences, 557390).
Isolation of immune cells from lamina propria. Large intestines from animals treated for 6 days with DSS, followed by 2 days of regular drinking water, were harvested, washed, and cut into 1-cm pieces. Tissues were then incubated in Ca2+- and Mg2+-free Hank’s Balanced Salt Solution (HBSS) with 5% FBS and 2 mM EDTA in an orbital shaker at 37°C for 30 minutes. Supernatants were then discarded and the remaining pieces were minced and incubated with 1.5 mg/ml collagenase IV (Sigma-Aldrich) under the same conditions as above for 30 to 40 minutes. Cells and tissue pieces were filtered with a 70-μm strainer. Cell suspensions were cen- trifuged at 430 g for 5 minutes and pelleted cells used for flow cytometry or macrophage enrichment (57).
Intestinal epithelial cell isolation. The epithelial cell population was isolated as described elsewhere (58, 59). Briefly, minced colon tissue was incubated vigorously at 37°C in 1 mM EDTA-HBSS to obtain dissoci- ated crypt cells. Epithelial cells were then separated from mononuclear and red blood cells through a 50%
Percoll gradient. The upper layer containing the epithelial cells was centrifuged and the pellet was resus- pended in the following buffer: 20 mM Tris-HCl pH 7.4, 150 mM NaCl, 4 mM EDTA, 100 μM Na2VO4, 1 mM PMSF, protease inhibitor cocktail (Sigma-Aldrich), and 0.5% Triton X-100 for 30 minutes at 4°C.
Thirty micrograms of protein was used for protein expression analysis by immunoblot.
Flow cytometry. Isolated lamina propria immune cells were stained with fluorochrome-conjugated anti- bodies specific for CD45 (30-F11), CD4 (RM4-5), CD8 (53-6.7), CD3 (17A2), CD11b (M1/70), CD11c (N418), F4/80 (BM8), Ly6Gr (RB6-8C5), and CD45r (RA3-6B2) (eBioscience), followed by flow cytom- etry analysis using a Beckman Coulter Gallios flow cytometer, as previously described (16). The data were analyzed with Kaluza software (Beckman Coulter). The percentage of positive cells for any membrane marker was always measured after gating the CD45+ population.
Real-time PCR. Total RNA from mouse tissues and cells was extracted using an RNeasy Mini Kit (Qia- gen) and TRIzol reagent (Ambion), respectively. The cDNA templates were synthesized using M-MLW Reverse Transcriptase (Ambion) following the manufacturer’s instructions. Quantitative real-time PCR analysis was performed in a LightCycler 480 (Roche) with a KAPA SYBR FAST qPCR kit (Kapabiosys- tems) and specific primers for Il6, 5′-TAGTCCTTCCTACCCCAATTTCC-3′ and 5′-TTGGTCCTTAGC- CACTCCTTC-3′; Il12a, 5′-CAATCACGCTACCTCCTCTTTT-3′ and 5′-CAGCAGTGCAGGAATAAT- GTTTC-3′; Il12b, 5′-TGGTTTGCCATCGTTTTGCTG-3′ and 5′-ACAGGTGAGGTTCACTGTTTCT-3′;
Il23a, 5′-ATGCTGGATTGCAGAGCAGTA-3′ and 5′-ACGGGGCACATTATTTTTAGTCT-3′;
Ccl2, 5′-AGGTCCCATGTCATGCTTCTGG-3′ and 5′-CTGCTGCTGGTGATCCTCTTG-3′; Nos2, 5′-CCAAGCCCTCACCTACTTCC-3′ and 5′-CTCTGAGGGCTGACACAAGG-3′; Ptgs2, 5′-TGAG- CAACTATTCCAAACCAGC-3′ and 5′-GCACGTAGTCTTCGATCACTATC-3′; Il1b, 5′-GCAACT- GTTCCTGAACTCAACT-3′ and 5′-ATCTTTTGGGGTCCGTCAACT-3′; Tnf, 5′-ACGGCATGGATCT- CAAAGAC-3′ and 5′-AGATAGCAAATCGGCTGACG-3′; Il17a, 5′-TTTAACTCCCTTGGCGCAAAA-3′
and 5′-CTTTCCCTCCGCATTGACAC-3′; Il17f, 5′-TGCTACTGTTGATGTTGGGAC-3′ and 5′-AAT- GCCCTGGTTTTGGTTGAA-3′; Foxp3, 5′-GGCCCTTCTCCAGGACAGA-3′ and 5′-GCTGATCATG- GCTGGGTTGT-3′; Tgfb, 5′-CTCCCGTGGCTTCTAGTGC-3′ and 5′-GCCTTAGTTTGGACAG- GATCTG-3′; Ifng, 5′-ATGAACGCTACACACTGCATC-3′ and 5′-TCTAGGCTTTCAATGACTGTGC-3′;
Il11, 5′-TGTTCTCCTAACCCGATCCCT-3′ and 5′-CAGGAAGCTGCAAAGATCCCA-3′; Cxcl1, 5′-CTGGGATTCACCTCAAGAACATC-3′ and 5′-CAGGGTCAAGGCAAGCCTC-3′; Cxcl2, 5′-CCAAC- CACCAGGCTACAGG-3′ and 5′-GCGTCACACTCAAGCTCTG-3′; and Gapdh, 5′-AGGTCGGTGT- GAACGGATTTG-3′ and 5′-TGTAGACCATGTAGTTGAGGTCA-3′. Quantification of relative tran- script levels was determined using the comparative 2–ΔΔCT method and Gapdh as the housekeeping gene (16).
Macrophage transference. Bone marrow–derived macrophages (BMDMs) were obtained and differenti- ated as previously described (16). One million BMDMs were injected in the mouse tail vein 1 day before and after induction of colitis with DSS, as previously described (30).
Immunoblots. Colonic tissues were homogenized in 20 volumes of the following buffer: 25 mM HEPES/
NaOH pH 7.4, 150 mM NaCl, 4 mM EDTA, 25 mM NaF, 1 mM Na2VO4, 1 mM PMSF, protease inhibitor cocktail (Sigma-Aldrich), 0.2% SDS, and 1% Nonidet P-40 at 4°C. Homogenates were then centrifuged at 12,000 g for 10 minutes at 4°C. Protein from the supernatants (20 μg) was resolved in 10% SDS-PAGE and
R E S E A R C H A R T I C L E
transferred to PVDF membranes (Millipore). Membranes were blocked with 5% BSA in PBS for 1 hour and then treated with antibodies against phospho-p44/42 MAPK (Thr202/Tyr204; Cell Signaling Technology, 9101), p44/42 MAPK (Cell Signaling Technology, 4695), phospho-STAT3 (Tyr705, Cell Signaling, 9131), or lipin-1 (16) at 1:1,000 dilution, or with antibodies against GAPDH (Ambion, 4300) or β-actin (Sigma- Aldrich, A5441) at 1:20,000 dilution in PBS with 5% BSA and 0.1% Tween. HRP-linked secondary antibod- ies (GE Healthcare) were then used at 1:5,000 dilution. Specific proteins were visualized using ECL chemilu- minescent substrate (GE Healthcare).
Cytokine determination in colon tissue and macrophages. Cytokine quantification in colon tissue was per- formed as previously described (60). Colon tissues from animals treated with DSS were homogenized in 2 volumes of the following buffer: 20 mM Tris-HCl pH 7.4, 150 mM NaCl, 4 mM EDTA, 100 μM Na2VO4, 1 mM PMSF, protease inhibitor cocktail (Sigma-Aldrich), and 0.5% Triton X-100 for 30 minutes at 4°C.
After centrifugation at 16,000 g for 10 minutes at 4°C, 500 μg of the homogenate was used for quantifi- cation of IL-1β, IL-6, IL-23, and TNF-α by specific ELISAs (Invitrogen) following the manufacturer’s instructions. Cell-associated cytokines were measured in macrophages isolated from colon after homog- enization with the above-mentioned buffer and 100 μg of the homogenate used for ELISA quantification.
PAP-1 activity. PAP-1 activity was measured exactly as described elsewhere (61). The [14C]DAG product was separated by thin layer chromatography, scraped, and quantified by scintillation counting (62).
Clinical data set analysis. GEOquery package was used to download GSE44076 (32), GSE41328 (33), GSE4183 (34) data sets and annotations related to colon cancer, and GSE9452 (36) and GSE6731 (37) data sets related to UC from the Gene Expression Omnibus. Differences in LPIN1 expression were assessed by Student’s t test without the assumption of equal variance. Pearson’s correlation coefficients between LPIN1 and other genes were calculated with the function cor implemented in the R Stats package (version 3.0.2). For survival analyses, a database comprising independent colon cancer data sets was set up as described previously (63). Cox propor- tional hazards regression was computed and Kaplan-Meier plots were drawn using relapse-free survival data. In this, patients were stratified into 2 cohorts by LPIN1 expression levels using the median expression as a cutoff.
The data were tested for significance using log-rank tests and are represented as Kaplan-Meier plots.
Statistics. Data are represented as mean ± SEM. Statistical significance was determined by 1-way or 2-way ANOVA with Tukey’s post hoc test or 2-tailed Student’s t test. For analysis of human databases, 1-way ANOVA with Holm-Sidak post hoc test or Pearson’s coefficient tests were performed to assess statis- tical significance. In Kaplan-Meier plots, P value was calculated by a log-rank test. P < 0.05 was considered statistically significant.
Study approval. This study was approved by the Bioethics Committee of the Spanish National Research Council (CSIC) prior to its commencement. All procedures involving animals were undertaken under the supervision of the Institutional Committee of Animal Care and Usage of the University of Valladolid, and are in accordance with the guidelines established by the Spanish Ministry of Agriculture, Food, and Environment and the European Union.
Author contributions
CM performed most of the experiments and analyzed the data. GGR, LP, GL, AC, and AO helped with experimentation. BG helped with the setup and analysis of colon cancer expression data. JB analyzed the data and wrote the manuscript. MAB designed the experimentation, analyzed the data, and wrote the manuscript.
Acknowledgments
We thank Montserrat Duque for excellent technical assistance. We also thank the staff at the Histology Core Facilities of CNIO (Madrid, Spain) and CiC (Salamanca, Spain), and the USAL Bioinformatics Core Facility (Salamanca, Spain) for their help. This work was supported by the Spanish Ministry of Economy, Industry and Competitiveness (grants SAF2013-48201-R and SAF2016-80883-R, to JB and MAB), and the Regional Government of Castile and Leon (BIO/VA03/14, BIO/VA22/15, to MAB), and the Hungarian National Research, Development and Innovation Office (grant NVKP_16-1-2016-0037, to BG). CIBER- DEM is an initiative of Instituto de Salud Carlos III.
Address correspondence to: María A. Balboa, Instituto de Biología y Genética Molecular, Calle Sanz y Forés 3, 47003 Valladolid, Spain. Phone: 34.983.184.833; Email: mbalboa@ibgm.uva.es.
1. Wang K, Karin M. Tumor-elicited inflammation and colorectal cancer. Adv Cancer Res. 2015;128:173–196.
2. Beaugerie L, Itzkowitz SH. Cancers complicating inflammatory bowel disease. N Engl J Med. 2015;372(15):1441–1452.
3. Langley RE, Rothwell PM. Aspirin in gastrointestinal oncology: new data on an old friend. Curr Opin Oncol. 2014;26(4):441–447.
4. Quail DF, Joyce JA. Microenvironmental regulation of tumor progression and metastasis. Nat Med. 2013;19(11):1423–1437.
5. Langowski JL, et al. IL-23 promotes tumour incidence and growth. Nature. 2006;442(7101):461–465.
6. Grivennikov SI, et al. Adenoma-linked barrier defects and microbial products drive IL-23/IL-17-mediated tumour growth.
Nature. 2012;491(7423):254–258.
7. Teng MW, et al. IL-12 and IL-23 cytokines: from discovery to targeted therapies for immune-mediated inflammatory diseases.
Nat Med. 2015;21(7):719–729.
8. Katoh H, Wang D, Daikoku T, Sun H, Dey SK, Dubois RN. CXCR2-expressing myeloid-derived suppressor cells are essential to promote colitis-associated tumorigenesis. Cancer Cell. 2013;24(5):631–644.
9. Wymann MP, Schneiter R. Lipid signalling in disease. Nat Rev Mol Cell Biol. 2008;9(2):162–176.
10. Casas J, Gijón MA, Vigo AG, Crespo MS, Balsinde J, Balboa MA. Phosphatidylinositol 4,5-bisphosphate anchors cytosolic group IVA phospholipase A2 to perinuclear membranes and decreases its calcium requirement for translocation in live cells.
Mol Biol Cell. 2006;17(1):155–162.
11. Ecker J, Liebisch G, Englmaier M, Grandl M, Robenek H, Schmitz G. Induction of fatty acid synthesis is a key requirement for phagocytic differentiation of human monocytes. Proc Natl Acad Sci USA. 2010;107(17):7817–7822.
12. Oshima M, et al. Suppression of intestinal polyposis in Apc delta716 knockout mice by inhibition of cyclooxygenase 2 (COX- 2). Cell. 1996;87(5):803–809.
13. Sheng H, et al. Inhibition of human colon cancer cell growth by selective inhibition of cyclooxygenase-2. J Clin Invest.
1997;99(9):2254–2259.
14. Valdearcos M, et al. Subcellular localization and role of lipin-1 in human macrophages. J Immunol. 2011;186(10):6004–6013.
15. Valdearcos M, et al. Lipin-2 reduces proinflammatory signaling induced by saturated fatty acids in macrophages. J Biol Chem.
2012;287(14):10894–10904.
16. Meana C, et al. Lipin-1 integrates lipid synthesis with proinflammatory responses during TLR activation in macrophages.
J Immunol. 2014;193(9):4614–4622.
17. Lordén G, et al. Lipin-2 regulates NLRP3 inflammasome by affecting P2X7 receptor activation. J Exp Med. 2017;214(2):511–528.
18. Corrotte M, et al. Dynamics and function of phospholipase D and phosphatidic acid during phagocytosis. Traffic.
2006;7(3):365–377.
19. Speranza F, Mahankali M, Henkels KM, Gomez-Cambronero J. The molecular basis of leukocyte adhesion involving phospha- tidic acid and phospholipase D. J Biol Chem. 2014;289(42):28885–28897.
20. Donkor J, Sariahmetoglu M, Dewald J, Brindley DN, Reue K. Three mammalian lipins act as phosphatidate phosphatases with distinct tissue expression patterns. J Biol Chem. 2007;282(6):3450–3457.
21. Neufert C, Becker C, Neurath MF. An inducible mouse model of colon carcinogenesis for the analysis of sporadic and inflam- mation-driven tumor progression. Nat Protoc. 2007;2(8):1998–2004.
22. De Robertis M, et al. The AOM/DSS murine model for the study of colon carcinogenesis: From pathways to diagnosis and therapy studies. J Carcinog. 2011;10:9.
23. Putoczki TL, et al. Interleukin-11 is the dominant IL-6 family cytokine during gastrointestinal tumorigenesis and can be targeted therapeutically. Cancer Cell. 2013;24(2):257–271.
24. Galamb O, et al. Dysplasia-carcinoma transition specific transcripts in colonic biopsy samples. PLoS One. 2012;7(11):e48547.
25. Bollrath J, et al. gp130-mediated Stat3 activation in enterocytes regulates cell survival and cell-cycle progression during colitis- associated tumorigenesis. Cancer Cell. 2009;15(2):91–102.
26. Strober W, Fuss IJ, Blumberg RS. The immunology of mucosal models of inflammation. Annu Rev Immunol. 2002;20:495–549.
27. Cooper HS, Murthy SN, Shah RS, Sedergran DJ. Clinicopathologic study of dextran sulfate sodium experimental murine coli- tis. Lab Invest. 1993;69(2):238–249.
28. Ahern PP, et al. Interleukin-23 drives intestinal inflammation through direct activity on T cells. Immunity. 2010;33(2):279–288.
29. Hue S, et al. Interleukin-23 drives innate and T cell-mediated intestinal inflammation. J Exp Med. 2006;203(11):2473–2483.
30. Munitz A, et al. Paired immunoglobulin-like receptor B (PIR-B) negatively regulates macrophage activation in experimental colitis. Gastroenterology. 2010;139(2):530–541.
31. Medina-Contreras O, et al. CX3CR1 regulates intestinal macrophage homeostasis, bacterial translocation, and colitogenic Th17 responses in mice. J Clin Invest. 2011;121(12):4787–4795.
32. Sanz-Pamplona R, et al. Aberrant gene expression in mucosa adjacent to tumor reveals a molecular crosstalk in colon cancer.
Mol Cancer. 2014;13:46.
33. Lin G, He X, Ji H, Shi L, Davis RW, Zhong S. Reproducibility Probability Score--incorporating measurement variability across laboratories for gene selection. Nat Biotechnol. 2006;24(12):1476–1477.
34. Galamb O, et al. Inflammation, adenoma and cancer: objective classification of colon biopsy specimens with gene expression signature. Dis Markers. 2008;25(1):1–16.
35. Sadanandam A, et al. A colorectal cancer classification system that associates cellular phenotype and responses to therapy. Nat Med. 2013;19(5):619–625.
36. Olsen J, et al. Diagnosis of ulcerative colitis before onset of inflammation by multivariate modeling of genome-wide gene expression data. Inflamm Bowel Dis. 2009;15(7):1032–1038.
37. Wu F, et al. Genome-wide gene expression differences in Crohn’s disease and ulcerative colitis from endoscopic pinch biopsies:
insights into distinctive pathogenesis. Inflamm Bowel Dis. 2007;13(7):807–821.
38. Jamieson T, et al. Inhibition of CXCR2 profoundly suppresses inflammation-driven and spontaneous tumorigenesis. J Clin Invest. 2012;122(9):3127–3144.
39. Sipos F, et al. MMP3 and CXCL1 are potent stromal protein markers of dysplasia-carcinoma transition in sporadic colorectal cancer. Eur J Cancer Prev. 2014;23(5):336–343.
40. He J, et al. Lipin-1 regulation of phospholipid synthesis maintains endoplasmic reticulum homeostasis and is critical for triple-
R E S E A R C H A R T I C L E
negative breast cancer cell survival. FASEB J. 2017;31(7):2893–2904.
41. Brohée L, Demine S, Willems J, Arnould T, Colige AC, Deroanne CF. Lipin-1 regulates cancer cell phenotype and is a potential target to potentiate rapamycin treatment. Oncotarget. 2015;6(13):11264–11280.
42. Balkwill F, Charles KA, Mantovani A. Smoldering and polarized inflammation in the initiation and promotion of malignant disease. Cancer Cell. 2005;7(3):211–217.
43. Bettelli E, et al. Reciprocal developmental pathways for the generation of pathogenic effector TH17 and regulatory T cells.
Nature. 2006;441(7090):235–238.
44. Hepworth MR, et al. Innate lymphoid cells regulate CD4+ T-cell responses to intestinal commensal bacteria. Nature.
2013;498(7452):113–117.
45. Sheibanie AF, et al. The proinflammatory effect of prostaglandin E2 in experimental inflammatory bowel disease is mediated through the IL-23-->IL-17 axis. J Immunol. 2007;178(12):8138–8147.
46. Rachmilewitz D, Karmeli F, Okon E, Bursztyn M. Experimental colitis is ameliorated by inhibition of nitric oxide synthase activity. Gut. 1995;37(2):247–255.
47. Dudhgaonkar SP, Tandan SK, Kumar D, Raviprakash V, Kataria M. Influence of simultaneous inhibition of cyclooxygenase-2 and inducible nitric oxide synthase in experimental colitis in rats. Inflammopharmacology. 2007;15(5):188–195.
48. Astudillo AM, Balgoma D, Balboa MA, Balsinde J. Dynamics of arachidonic acid mobilization by inflammatory cells. Biochim Biophys Acta. 2012;1821(2):249–256.
49. Finck BN, et al. Lipin 1 is an inducible amplifier of the hepatic PGC-1alpha/PPARalpha regulatory pathway. Cell Metab.
2006;4(3):199–210.
50. Bassaganya-Riera J, et al. Activation of PPAR gamma and delta by conjugated linoleic acid mediates protection from experi- mental inflammatory bowel disease. Gastroenterology. 2004;127(3):777–791.
51. Van den Bossche J, O’Neill LA, Menon D. Macrophage immunometabolism: Where are we (going)? Trends Immunol.
2017;38(6):395–406.
52. Osawa E, et al. Peroxisome proliferator-activated receptor gamma ligands suppress colon carcinogenesis induced by azoxymeth- ane in mice. Gastroenterology. 2003;124(2):361–367.
53. Xu M, Zuo X, Shureiqi I. Targeting peroxisome proliferator-activated receptor-β/δ in colon cancer: how to aim? Biochem Phar- macol. 2013;85(5):607–611.
54. Angevin E, et al. A phase I/II, multiple-dose, dose-escalation study of siltuximab, an anti-interleukin-6 monoclonal antibody, in patients with advanced solid tumors. Clin Cancer Res. 2014;20(8):2192–2204.
55. Jatoi A, et al. A placebo-controlled double blind trial of etanercept for the cancer anorexia/weight loss syndrome: results from N00C1 from the North Central Cancer Treatment Group. Cancer. 2007;110(6):1396–1403.
56. Kumar V, Abbas AK, Fausto N, Aster JC. Robbins and Cotran pathologic basis of Disease. 8th edition. Philadelphia,PA; Saunders Elsevier; 2009:763–832.
57. Harusato A, Geem D, Denning TL. Macrophage isolation from the mouse small and large intestine. Methods Mol Biol.
2016;1422:171–180.
58. Del Reino P, et al. Pro-oncogenic role of alternative p38 mitogen-activated protein kinases p38γ and p38δ, linking inflammation and cancer in colitis-associated colon cancer. Cancer Res. 2014;74(21):6150–6160.
59. Roche JK. Isolation of a purified epithelial cell population from human colon. Methods Mol Med. 2001;50:15–20.
60. Kim JJ, Shajib MS, Manocha MM, Khan WI. Investigating intestinal inflammation in DSS-induced model of IBD. J Vis Exp.
2012;60(60):3678.
61. Manmontri B, et al. Glucocorticoids and cyclic AMP selectively increase hepatic lipin-1 expression, and insulin acts antagonisti- cally. J Lipid Res. 2008;49(5):1056–1067.
62. Balboa MA, Balsinde J, Dennis EA, Insel PA. A phospholipase D-mediated pathway for generating diacylglycerol in nuclei from Madin-Darby canine kidney cells. J Biol Chem. 1995;270(20):11738–11740.
63. Szász AM, et al. Cross-validation of survival associated biomarkers in gastric cancer using transcriptomic data of 1,065 patients.
Oncotarget. 2016;7(31):49322–49333.