–20 –15 –10 –5 0
Discrmination Median diff.
Mean diff.
2016 2014 2012 2010 2008 2006 2004 2002 2000 1998 1996
10 ClassiC labour market disCrimination
177
Gregor, A.–Kováts, E. (2018): Nőügyek, 2018. Társa- dalmi Problémák és megoldási stratégiák.
(Women’s Affairs 2018. Societal Problems and Solu- tion Strategies in Hungary) Friedrich-Ebert-Stiftung, Budapest.
Loury, G. C. (2002): The Anatomy of Racial Inequality, Harvard University Press, Cambridge.
Sik, E.–Simonovits, B. (2008): Egyenlő bánásmód és diszkrimináció. (Equal Opportunities and Discrim-
ination) In: Kolosi, T.–Tóth, I. Gy. (eds.): Társadal- mi Riport. (Social Report) 2008. Tárki, Budapest, pp.
363–386.
Sik, E.–Simonovits, B. (2010): Measuring Discrimina- tion: Questionnaires and tests. In focus. In: Károly Fazekas– Anna Lovász–Álmos Telegdy (ed.): The Hun- garian Labour Market, 2010. MTA Közgazdaságtu- dományi Intézet – Országos Foglalkoztatási Közala- pítvány. pp. 121–134.
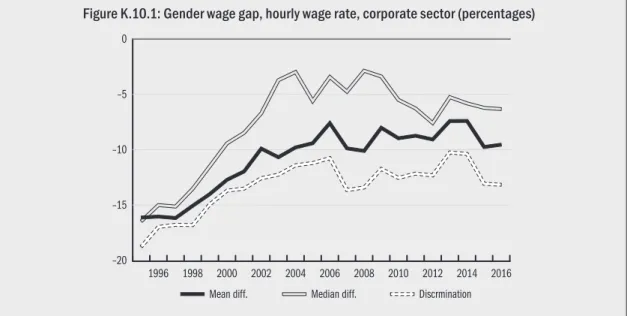
K10.1 Labour market discrimination, 1995–2016 Gábor Kőrösi
The wage survey data is available annually since the 1990’s in a mostly comparable structure. Thus, the wage model can be estimated for two decades with a slight modification. It is eminently interesting how the gender wage gap changed over this period.
A model very similar to Model 4 in Table 10.1 was estimated for the period between 1995 and 2016.
The labour contract type had to be omitted from the regression. Figure K.10.1 presents these esti- mates, together with the raw wage gap.
The gender wage gap declined until 2006, and stagnated afterwards. It is clear that the raw wage gap was not only smaller than the true discrimina-
tion, measured in a wage model, but the ‘true’ dis- crimination decreased less than one would guess from the raw gender wage gap.1 Figure K.10.1 also presents the difference in the gender specific me- dian wages: the difference between a ‘typical’ fe- male and a ‘typical’ male employee is significant- ly smaller than the average difference, indicating that the two wage distributions are different. That also means that the gender wage gap is not uni- form for all.
1 The raw gender wage gap is given by Model 1 in Ta- ble 10.1.
Figure K.10.1: Gender wage gap, hourly wage rate, corporate sector (percentages)