sustainability
Article
Estimating the Market Share and Price Premium of GI Foods—The Case of the Hungarian Food Discounters
Lili Jantyik * andÁron Török
Department of Agricultural Economics and Rural Development, Corvinus University of Budapest, 1093 Budapest, Hungary; aron.torok@uni-corvinus.hu
* Correspondence: lili.jantyik@uni-corvinus.hu
Received: 20 December 2019; Accepted: 30 January 2020; Published: 4 February 2020 Abstract:The food security of the European Union heavily relies on the food quality systems where Geographical Indications (GI) play an important role. European food is considered world-wide secure and high quality, therefore European food names and designations represent value that should be protected as intellectual property. Despite the importance of GIs in Europe, the availability of the related economic data is very limited, and the only available comprehensive database (in the case of GI foods, the Database of Origin and Registration (DOOR)) details only some very basic and mainly administrative characteristics of such products. From an economic perspective, market size and price premium of these products are the most important in order to assess the economic sustainability of European GI foods. Empirical datasets describing these characteristics of GI products are scarcely available and can be collected only case by case. Therefore, the purpose of this study is to estimate the market size for food products with geographical indications available in Hungary (excluding wines and spirits) and their price premium compared to their direct substitute products, based on empirical data. We conducted monthly mystery shopping for one year (January–December 2018) at three food discount stores (Lidl, Aldi, and Penny Market) operating in Budapest. We collected data on all the GI products available in the stores and their closest substitutes; then the dataset was subsequently analysed and compared to the main characteristics of the DOOR database. The reason for choosing the discounters is that these stores have expanded spectacularly in recent years and are mostly available to average consumers, both in Hungary and across Europe, and based on the main characteristics of this type of retail (limited product portfolio targeting price-sensitive consumers), the data collected here can be considered to indicate the minimum level of market share and price premium. Our results show that currently, GIs have only limited importance in the Hungarian food market, in terms of both the number of products and their market share, as only a small number of such products appear in the food discounters’ supply. As regards the premium achievable with consumer prices, the average price premium is remarkably high (43% on average), even in the case of discounters. Our empirical results also suggest that in Hungary, there is an opportunity to increase the importance of GI foods, both in terms of availability and market share. For Hungarian GI food producers and processors, the level of price premium achievable in discounters might be attractive enough to stimulate their presence in the market.
Keywords: geographical indication; PDO; PGI; price premium; market share; Hungarian discounters
1. Introduction
The quality of food is significantly determined by the place of production, which in some cases also ensures the reputation of the products. This attachment is recognized and regulated in almost all parts of the world as a form of intellectual property [1]. Globally, the European Union plays an important role in the system of protection of origin, which has defined the system of geographical indications at
Sustainability2020,12, 1094; doi:10.3390/su12031094 www.mdpi.com/journal/sustainability
Sustainability2020,12, 1094 2 of 15
Community level under asui generisregulatory framework since 1992 [2]. The European system of geographical indications (GI) distinguishes between two types of products: Protected Designation of Origin (PDO) and Protected Geographical Indication (PGI). The high quality of PDO is due to the fact that the production is wholly linked to a specific geographical area, while in the case of PGI, reputation derives mainly from the fact that at least a significant part of the production is linked to a specific location [3].
However, in many countries (e.g., USA, Canada, Australia) GIs are treated as trademarks, and although multilateral agreements have governed this issue since the World Trade Organization’s TRIPS Agreement, there is considerable disagreement over this topic between some countries and the European Union [4].
Although GIs have little influence on international trade agreements [5], these products play a central role for the European Union—not only in EU food quality policy but also in international trade [6]. For the von der Leyen Committee, which was formed at the end of 2019, will also be a key priority, as they are the depository of high-quality food that “is a key part of maintaining high food quality and standards and ensuring that our cultural, gastronomic and local heritage is preserved and certified as authentic across the world” [7].
Despite the importance of GIs being highlighted by the European Commission in several forums, the quantity and quality of data related to and available in the field is rather limited (see [8] for details), and the lack of comprehensive data is a major problem, impeding our understanding of the economic and social importance of geographical indications [9]. Only a little technical information is available from the official GI register of the European Commission (DOOR), and comprehensive market data from other sources is only available in the largest GI producer countries (e.g., in Italy and France).
In order to understand the importance of GI foods, it is essential to get an overview of the market size and price premium for such products. The number of GI products available for an average consumer could highly influence their recognition and demand. On the other side, an important objective of GI policy is to increase net producer income. This could be achieved through the price premium these products can attract due to their higher quality. Nevertheless, production costs can also be higher, both to achieve higher quality and to conform to GI regulations (e.g., additional costs due to the GI requirements). Also, GI products compete with similar food products on the same market;
therefore, their prices relative to those consumers perceive similar is important [8].
In 2015, the Hungarian government announced the Geographical Indications Programme, which aims to significantly increase the number of Hungarian food products with geographical indication recognized by the EU and to make better use of the opportunities offered by geographical indications for products already protected in this way [10]. By 2015, a total of 13 Hungarian agricultural and food products had been registered in the EU official register, and since then, one more product has been registered, while another 14 product registration applications are in process thanks to the government programme [11].
1.1. Market Share of GI Foods in Europe
Limited data on the actual market share of GI foods is available in the studies published so far.
The official EU database (DOOR) does not provide this type of information, only detailing some basic descriptions (e.g., registration process, product description, producer group etc.). According to the DOOR database, most GI products come from Mediterranean EU Member States (in descending order: Italy, France, Spain, Portugal, and Greece), and most of them are vegetables and fruits, cheese, processed or raw meat, and olive oil [12].
Several studies have been prepared for the European Commission about the situation of GI products. They are quite old, but since 2012, no comprehensive study has been released that includes empirical evidence for the whole EU GI market [8]. One of these studies was conducted by London Economics [9], which found that Italy was the most interested in the system in terms of the number of producers and processors of GI products, accounting for 3.4% of farmers and 17% of processors. In
Sustainability2020,12, 1094 3 of 15
France, 14.7% of farmers were PDO, and 2.9% were PGI food producers. In terms of sales, in France, Germany, Italy, and Spain, PDO/PGI products accounted for between 1% and 5% (around€10 billion) of total food product turnover in 2008.
The report of AND International [13] gives an even more comprehensive picture, also delivered to the European Commission, using both primary and secondary data. GIs represented 5.7% of European food and beverage sales in 2010. The share of GI production in total food production was more than 10% only in France (14.5%). In Italy, Greece, and Portugal, this proportion ranged from 8% to 10%, while in the case of 15 Member States, it was under 4%.
In 2010, 19.5% of all GI production was exported to markets outside of the EU, while 20.4%
was sold within the EU but outside the producing country, and the most important market for these products is, therefore, the domestic market of the country of production.
Market studies in some countries show high levels of concentration: In Italy, out of nearly 300 GI products, only 15 (mainly cheeses and meat products) accounted for 90% of total production [14].
Tibério and Francisco [15] estimated the Portuguese GI market as being worth around€70 million in 2007 but pointed out that only 68% of these products were sold on the market, the rest being used for own consumption or barter. Analysing the Italian cheese market, Galli et al. [16] found substantial differences in both production and export: Some large-market cheeses generated significant foreign sales, but domestic and local markets were overwhelmingly the destination of products with lower production volumes. Examining international trade, Leufkens [17] found that, in particular, PGI products have a positive effect on exports. A similar finding was made by Belletti et al. [18] for Tuscan olive oils: In markets outside Europe, PGI products were present, whereas, in Italian and EU markets, PDO products were more typical. In Hungarian case studies, it is also highlighted that Hungarian GI products do not really travel far away, and producers are mostly focusing on the domestic market (e.g.,: [19–21]).
Based on the above, it can be stated that GI products are dominant only in some European countries, but their market share is not significant. Most of the products are sold domestically, and it is mainly PGI products that are exported.
1.2. Price Premium for GI Foods in Europe
In addition to the market size of GI foods, our research also focuses on price premiums. Various studies have been conducted on this topic before.
In terms of methodology, questionnaires and interviews were most often used to find out whether consumers were willing to pay more for PDO/PGI labelled products. The results of these studies show that in most cases, respondents were willing to pay a premium for PDO or PGI products (among others: [22–27]). However, the opposite is true in the study of Simioni and Bonnet [28]; in their research on cheeses in France, they concluded from panel data that consumers were unwilling to pay more for PDO labelled products.
Aprile et al. [29] used experimental selection, and a random logit model to determine how much Italian consumers are willing to pay for different quality labelled olive oils. The research found that consumers were willing to pay the highest price premium for the PDO label, followed by the organic label, then the term “extra virgin” olive oil, and finally the PGI label. Menapace et al. [30] also examined olive oil using an elective model to map Canadian consumers’ relationship with GI products. Using a discrete choice model and a multinomial mixed logit model, they found that both country of origin and GI labels are important, but Canadian buyers value the country origin information more than GIs. Vecchio and Annunziata [31] used an experimental selection based on appearance, price, and origin in their Italian research to explore the knowledge of GIs in the ham and cheese industry and the willingness of consumers to pay extra. Despite there being a lack of knowledge of PDO and PGI labels, the results showed that nearly 58% of respondents were willing to pay a premium price of more than 20% for these products, and another 27% of consumers are willing to pay a 10% extra price. Of those who knew the PDO label well, 37.5% were willing to pay a premium of up to 40%, and of those
Sustainability2020,12, 1094 4 of 15
who were unfamiliar with these labels, 34.5% said they would pay a maximum premium of 10% for these products.
The analysis of the consumer side shows that consumers are typically willing to pay more for GI products, but the size of the premium may show differences.
Based on the above, we aim to estimate the market size of food products with geographical indications available in Hungarian discounters (excluding wines and spirits) and their price premium compared to their direct substitute products, and thus empirically contribute to the literature, which is rather incomplete in this regard.
2. Materials and Methods
In order to have real market data, we conducted monthly mystery shopping for one year (January–December 2018) at three food discount stores (Lidl, Aldi, and Penny Market) operating in Budapest, the capital of Hungary. Mystery shopping is a form of participant observation used for a long time for explanatory research [32]. This approach can avoid the potential weaknesses of interviewing and survey methods, first of all, the discrepancy between real and reported behavior of consumers [33]. Mystery shopping is usually used for evaluating services (for example, Liu et al. [34]
evaluated restaurants or Yaoyuneyong et al. [35] hotels) because this method allows the researcher to see the services (and also the products) from the consumers’ perspective. This kind of observation research also has other advantages over personal and/or mall intercept interviews, mainly in terms of cost- and time-effectiveness [36]. The low level of awareness of the EU GI system among Hungarian consumers indicated in previous studies (e.g.,: [37,38]) also confirms that end-consumer prices should be investigated through the participant observation of experts conducting mystery shopping.
In our research, we tried to get an overview of the GI food-related services of the Hungarian food discounters (in particular whether they have any GI foods on their selves) and also wanted to measure the price levels. In order to get comparable results, we visited the same store on the same day each month (every third Thursday of the month, since the promotional period begins in every chain on Thursday). First, we collected data on all the GI products available in the store and their closest substitutes.
In order to find the GI food’s closest substitute, we used the following guidelines:
• First, we searched for a substitute product with almost the same physical characteristics (e.g., for Italian PGI apple “Mela Alto Adige”, we selected Hungarian Granny Smith or Golden apple),
• second, if the first option did not exist, we searched for a substitute product with very similar characteristics (e.g., for Dutch PGI cheese “Gouda Holland”, we selected Austrian gouda cheese),
• third, if the first two options did not exist, we searched for a substitute product from the same product category with similar characteristics (e.g., for Greek PDO cheese “Feta”, we chose Danish white cream cheese),
• in cases where the GI food had some very unique characteristics, and no other products had a similar attribution, we chose no substitute product, and that GI food was not included to our price premium calculations (e.g., no other cheese had similar characteristics like Italian PDO cheese
“Grana Padano”; in particular, there was no other hard, crumbly-textured cheese available).
Then we monitored their availability, and special attention was given to price developments, and the level of price premium was calculated as follows:
Price premium(%) = PriceGI−PriceNonGI PriceNonGI
× 100
wherePriceGIis the price of the identified GI food andPriceNonGIis the price of the identified GI food’s direct substitute, both measured in Hungarian Forints per kilogram, or in case of liquid foods (e.g., olive oil) in Hungarian Forints per litre.
Sustainability2020,12, 1094 5 of 15
The resulting time-series data were subsequently analysed. With the method presented, we managed to create a database of 816 observations for further studies and analyses.
Characteristics of Discounters
Our research was carried out in discount stores operating in Hungary. The primary reason for this was that these stores had expanded spectacularly in recent years, both in Hungary and across Europe, making them accessible to the average consumer almost everywhere. According to a study by Hökelekli et al. [39], more than half (51%) of UK shoppers visited a discount store in 2014, and over the previous two years, the number of consumers who have done their “main shopping” in a discounter has more than doubled, from 5% to 12%. Aldi and Lidl were active in 28 European countries in 2016, with an average market share of 10%, but in Germany and Austria, for example, this figure was towards 35% and had been increasing since then [40]. In Belgium, a survey in 2013 showed that the discount stores possessed 42.6% of the food retail trade in the country [41].
Another impressive change in recent years was that discount stores had repositioned themselves, and they are no longer necessarily looking to be the cheapest store on the market. In the early years, the Albrecht brothers (the founders of Aldi and Hofer) decided not to follow the trend of diversifying their product range, but to continue to focus on a limited range in the Fast Moving Consumer Goods (FMCG) market since they can be purchased in large quantities and sold at low prices. The rapid growth of Aldi, Lidl, and similar discounters in Germany was promoted by the country’s retail planning policy, originally developed in 1968, which protects small or mid-size retailers by limiting the size of out-of-town stores. Since 1986, grocery stores have in most places been limited to sales areas of about 800 m2[42]. In recent years, however, discounters have repositioned themselves, and there is a new tendency: Fresh goods, organic products, quality wines, and high-quality private labelled products are available in a wide range of shops [43]. Discount stores offer fewer products, around 1300–1400 items, as opposed to the average 30,000 available in supermarkets [39], but the supply of these discounters is constant and changes less frequently than other types of stores. Another important feature of discount stores is that a significant part of their supply is private labelled product [41,44].
Discounters can have a better influence on the retail price of the private labelled products, which contributes to a different pricing strategy for discount stores [45]. Retailers prefer private labelled products because they usually have a higher gross margin on these products and can help them differentiate themselves from competitors, as these brands are not available in other stores [46]. Several studies have investigated that the market for private labelled products was anti-cyclical, grew during the recession, but maintained its profitability even after the recession [46]. Private labelled products are expanding rapidly, with a market share of around 30% in 2014 [47]. In the study of Larson [46], the profile of potential buyers of private labelled products was identified. The author analysed the results of an online panel survey of 605 US participants with binary logistic regression. Based on these, he concluded that consumers of private labelled products are university-educated and hedonistic buyers. Gender, income, and time preference variables were significant, allowing retailers to target men, higher-income households, and people who focus on the present.
In terms of Hungarian food retailing, based on the number of stores, COOP, CBA, and Real dominate the most. Among the discounters, Penny Market had the biggest number of sales units, with 218 stores, so it was the fifth-largest in Hungary. At the end of 2018, the three discount chains had a total of 534 stores. At the same time, looking at the growth rate of stores over the past ten years, we can see that all three discounters are among the most dynamically expanding chains. Aldi stores’ number grew on average by more than 10% on an annual basis, while Lidl increased on average by 4.3%, and Penny Market by 2.3% (see Figure1).
Sustainability2020,12, 1094 6 of 15
Sustainability 2020, 12, x FOR PEER REVIEW 6 of 15
Figure 1. Food retail units in Hungary in 2018 and the average annual growth rate 2009-2018 (%).
Source: Own compilation based on [48].
Considering the turnover, Tesco, Coop, and Spar had the biggest turnover in absolute terms in 2018, but in terms of annual sales growth in Hungary, in the last ten years, the discount stores increased the most. Aldi grew most dynamically, Lidl ranked second, but Penny Market also grew more than 5% between 2009 and 2018 (see Figure 2).
Figure 2. Annual sales of the food-related Fast Moving Consumer Goods (FMCG) sector in Hungary in 2018 (HUF billion) and average annual growth rate between 2009 and 2018 (%). Source: Own compilation based on [48].
From these data, we can see that discounters in Hungary are also following European trends, growing steadily and gaining more and more share in the retail sector.
Figure 3 clearly shows that while the number of stores in 2018 was only 6% of the Hungarian market covered by the dynamically growing discount stores, if we instead look at the turnover, it owned more than a quarter of the whole segment. From the data above, we can see that by examining the Hungarian discounters, we can get an excellent picture of the current processes describing the
-6%
-4%
-2%
0%
2%
4%
6%
8%
10%
12%
0 500 1000 1500 2000 2500 3000 3500 4000 4500 5000
Coop CBA Reál Spar Penny
Market
Tesco Lidl Aldi Auchan
number of units (pcs, 2018) average change in number of units (%, 2009-2018)
-5%
0%
5%
10%
15%
20%
25%
0 100 200 300 400 500 600 700 800 900
Tesco Coop Spar Lidl CBA Reál Auchan Penny
Market
Aldi
annual turnover in 2018 (HUF billion) average change in annual turnover (%, 2009-2018) Figure 1. Food retail units in Hungary in 2018 and the average annual growth rate 2009-2018 (%).
Source: Own compilation based on [48].
Considering the turnover, Tesco, Coop, and Spar had the biggest turnover in absolute terms in 2018, but in terms of annual sales growth in Hungary, in the last ten years, the discount stores increased the most. Aldi grew most dynamically, Lidl ranked second, but Penny Market also grew more than 5%
between 2009 and 2018 (see Figure2).
Sustainability 2020, 12, x FOR PEER REVIEW 6 of 15
Figure 1. Food retail units in Hungary in 2018 and the average annual growth rate 2009-2018 (%).
Source: Own compilation based on [48].
Considering the turnover, Tesco, Coop, and Spar had the biggest turnover in absolute terms in 2018, but in terms of annual sales growth in Hungary, in the last ten years, the discount stores increased the most. Aldi grew most dynamically, Lidl ranked second, but Penny Market also grew more than 5% between 2009 and 2018 (see Figure 2).
Figure 2. Annual sales of the food-related Fast Moving Consumer Goods (FMCG) sector in Hungary in 2018 (HUF billion) and average annual growth rate between 2009 and 2018 (%). Source: Own compilation based on [48].
From these data, we can see that discounters in Hungary are also following European trends, growing steadily and gaining more and more share in the retail sector.
Figure 3 clearly shows that while the number of stores in 2018 was only 6% of the Hungarian market covered by the dynamically growing discount stores, if we instead look at the turnover, it owned more than a quarter of the whole segment. From the data above, we can see that by examining the Hungarian discounters, we can get an excellent picture of the current processes describing the
-6%
-4%
-2%
0%
2%
4%
6%
8%
10%
12%
0 500 1000 1500 2000 2500 3000 3500 4000 4500 5000
Coop CBA Reál Spar Penny
Market
Tesco Lidl Aldi Auchan
number of units (pcs, 2018) average change in number of units (%, 2009-2018)
-5%
0%
5%
10%
15%
20%
25%
0 100 200 300 400 500 600 700 800 900
Tesco Coop Spar Lidl CBA Reál Auchan Penny
Market
Aldi
annual turnover in 2018 (HUF billion) average change in annual turnover (%, 2009-2018)
Figure 2.Annual sales of the food-related Fast Moving Consumer Goods (FMCG) sector in Hungary in 2018 (HUF billion) and average annual growth rate between 2009 and 2018 (%). Source: Own compilation based on [48].
From these data, we can see that discounters in Hungary are also following European trends, growing steadily and gaining more and more share in the retail sector.
Figure3clearly shows that while the number of stores in 2018 was only 6% of the Hungarian market covered by the dynamically growing discount stores, if we instead look at the turnover, it owned more than a quarter of the whole segment. From the data above, we can see that by examining the Hungarian discounters, we can get an excellent picture of the current processes describing the
Sustainability2020,12, 1094 7 of 15
Hungarian food retail sector. These chains are mostly available to average consumers in Hungary and Europe, and with the growth in their stores and sales, we can expect more and more customers to enter these stores, so they are expected to play an even greater role in retail. Our choice is also justified by the fact that according to the results of a recent consumer survey [49], products branded with a national food quality label of Traditions, Flavours, Regions—which are considered to be the “preschool” of GIs—are mostly open to consumers who purchase their food primarily at discount stores, and these consumers are also likely to become regular buyers of these products.
Sustainability 2020, 12, x FOR PEER REVIEW 7 of 15
Hungarian food retail sector. These chains are mostly available to average consumers in Hungary and Europe, and with the growth in their stores and sales, we can expect more and more customers to enter these stores, so they are expected to play an even greater role in retail. Our choice is also justified by the fact that according to the results of a recent consumer survey [49], products branded with a national food quality label of Traditions, Flavours, Regions—which are considered to be the
“preschool” of GIs—are mostly open to consumers who purchase their food primarily at discount stores, and these consumers are also likely to become regular buyers of these products.
Figure 3. Sales (left figure) and the number of sale points (right figure) of food-related FMCG sector in 2018. Source: Own compilation based on [48].
In this study, we examine the retail availability and prices of GI food products in discount stores.
Based on the characteristics of the discounts described above, we expect the results obtained here to allow us to estimate the characteristics of the Hungarian market in terms of both the minimum price premium (Hungarian food discount continues to target primarily price-sensitive consumers) and the minimum market size (the supply of the discounts are rather limited). Based on the literature and preliminary results, we expected that the Hungarian GI supply of discounters would be rather scarce, with typically high levels of processed (cheese and meat) PGI products from the major South- European producing countries (Italy, France, and Spain), followed by Hungarian and German products (all three investigated food chains are German-owned).
3. Results
3.1. Market Size in Hungary
Our observations based on mystery shopping show several clear results. First, the number of GI products available in Hungarian discounts is limited, with 8-16 GI products available in the basic food supply (see Figure 4). Second, the supply is quite permanent, and although only a limited number of products bears these labels, they are always available to consumers and are part of the basic product portfolio of chains. The number of GI products increased significantly only during thematic promotions, for example in the Aldi and Lidl chains, which organised a special “Italian week”. Third, it is important to note that the number of private labelled products is also significant for GIs, in the case of Lidl and Penny Market, whose share was 80–90%, while in Aldi it was only 50%.
26%
74%
Discounters Other types of grocery
6%
94%
Discounters Other types of grocery
Figure 3.Sales (left figure) and the number of sale points (right figure) of food-related FMCG sector in 2018. Source: Own compilation based on [48].
In this study, we examine the retail availability and prices of GI food products in discount stores.
Based on the characteristics of the discounts described above, we expect the results obtained here to allow us to estimate the characteristics of the Hungarian market in terms of both the minimum price premium (Hungarian food discount continues to target primarily price-sensitive consumers) and the minimum market size (the supply of the discounts are rather limited). Based on the literature and preliminary results, we expected that the Hungarian GI supply of discounters would be rather scarce, with typically high levels of processed (cheese and meat) PGI products from the major South-European producing countries (Italy, France, and Spain), followed by Hungarian and German products (all three investigated food chains are German-owned).
3. Results
3.1. Market Size in Hungary
Our observations based on mystery shopping show several clear results. First, the number of GI products available in Hungarian discounts is limited, with 8-16 GI products available in the basic food supply (see Figure4). Second, the supply is quite permanent, and although only a limited number of products bears these labels, they are always available to consumers and are part of the basic product portfolio of chains. The number of GI products increased significantly only during thematic promotions, for example in the Aldi and Lidl chains, which organised a special “Italian week”. Third, it is important to note that the number of private labelled products is also significant for GIs, in the case of Lidl and Penny Market, whose share was 80–90%, while in Aldi it was only 50%.
Sustainability2020,12, 1094 8 of 15
Sustainability 2020, 12, x FOR PEER REVIEW 8 of 15
Figure 4. GI products available in the different food discounters (pcs). Source: Own editing.
Compared to the DOOR database, the supermarkets in question had a higher proportion of PDO products than PGI products, as opposed to the DOOR database, where it has just the opposite distribution (see Figure 5).
Figure 5. Comparison of the share of PDO (Protected Designation of Origin) and PGI (Protected Geographical Indication) products in the DOOR database (figure on the left) and the Hungarian discounters (figure on the right). Source: Own editing.
The distribution of country of origin and food categories in the domestic discount stores compared to the DOOR database clearly shows first (see Table 1) that most of the available products (82%) are imported, and next, that both in the DOOR database and in Hungary, Italian products were found in the greatest numbers. At the same time, while French, Spanish, and Portuguese products are present in large numbers in the DOOR database, these products are entirely unavailable on the shelves of Penny, Lidl, and Aldi in Hungary. Greek and German products also had a relatively large
0 2 4 6 8 10 12 14 16 18
Aldi Lidl Penny Market
Private label product Products with commercial brand
PDO 46%
PGI
54% PDO
60%
PGI 40%
Figure 4.GI products available in the different food discounters (pcs). Source: Own editing.
Compared to the DOOR database, the supermarkets in question had a higher proportion of PDO products than PGI products, as opposed to the DOOR database, where it has just the opposite distribution (see Figure5).
Sustainability 2020, 12, x FOR PEER REVIEW 8 of 15
Figure 4. GI products available in the different food discounters (pcs). Source: Own editing.
Compared to the DOOR database, the supermarkets in question had a higher proportion of PDO products than PGI products, as opposed to the DOOR database, where it has just the opposite distribution (see Figure 5).
Figure 5. Comparison of the share of PDO (Protected Designation of Origin) and PGI (Protected Geographical Indication) products in the DOOR database (figure on the left) and the Hungarian discounters (figure on the right). Source: Own editing.
The distribution of country of origin and food categories in the domestic discount stores compared to the DOOR database clearly shows first (see Table 1) that most of the available products (82%) are imported, and next, that both in the DOOR database and in Hungary, Italian products were found in the greatest numbers. At the same time, while French, Spanish, and Portuguese products are present in large numbers in the DOOR database, these products are entirely unavailable on the shelves of Penny, Lidl, and Aldi in Hungary. Greek and German products also had a relatively large
0 2 4 6 8 10 12 14 16 18
Aldi Lidl Penny Market
Private label product Products with commercial brand
PDO 46%
PGI
54% PDO
60%
PGI 40%
Figure 5. Comparison of the share of PDO (Protected Designation of Origin) and PGI (Protected Geographical Indication) products in the DOOR database (figure on the left) and the Hungarian discounters (figure on the right). Source: Own editing.
The distribution of country of origin and food categories in the domestic discount stores compared to the DOOR database clearly shows first (see Table1) that most of the available products (82%) are imported, and next, that both in the DOOR database and in Hungary, Italian products were found in the greatest numbers. At the same time, while French, Spanish, and Portuguese products are present in large numbers in the DOOR database, these products are entirely unavailable on the shelves of Penny, Lidl, and Aldi in Hungary. Greek and German products also had a relatively large share in our country and, not surprisingly, Hungarian products were in a much larger proportion (18%) than would be justified by their incidence in the DOOR database.
Sustainability2020,12, 1094 9 of 15
Table 1.GI foods by origin in the DOOR database and in the Hungarian discount stores.
Country DOOR (%) Hungarian Discounters (%) Difference (p.p.)
Italy 21 41 20
France 18 0 −18
Spain 14 0 −14
Portugal 10 0 −10
Greece 8 18 10
Germany 7 15 8
Hungary 1 18 17
Other 21 8 −13
Source: Own editing.
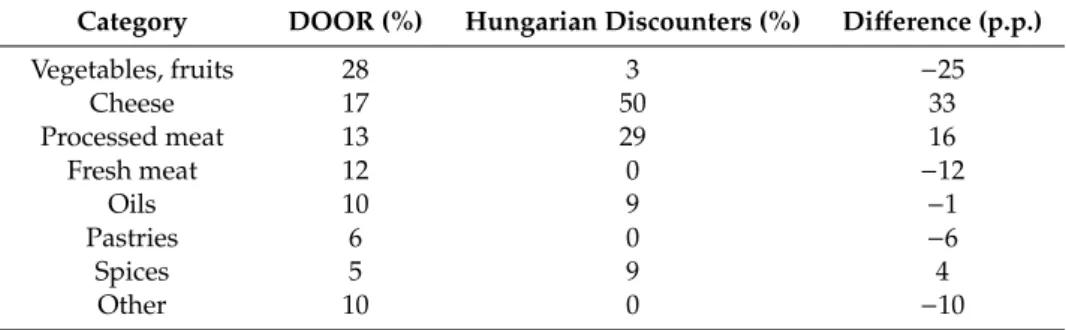
When analysing the supply by product categories, we can see that while in the DOOR database the category of fruits and vegetables contains the most products, in the Hungarian discounts the cheeses (50%) and processed meats (29%) dominate (Table2).
Table 2.GI foods by category in the DOOR database and in the Hungarian discount stores.
Category DOOR (%) Hungarian Discounters (%) Difference (p.p.)
Vegetables, fruits 28 3 −25
Cheese 17 50 33
Processed meat 13 29 16
Fresh meat 12 0 −12
Oils 10 9 −1
Pastries 6 0 −6
Spices 5 9 4
Other 10 0 −10
Source: Own editing.
3.2. Price Premium in Hungary
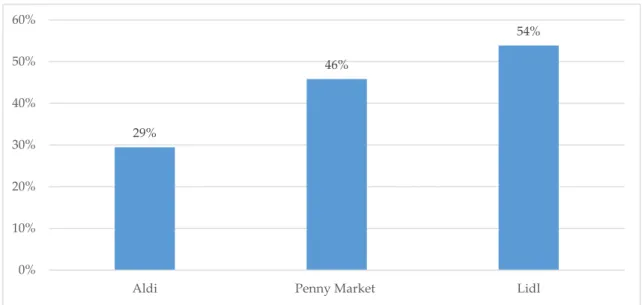
There is also a significant difference in the average price premium for GI products (see Figure6):
Aldi had 29%, Penny Market had 46%, and the highest was in Lidl (54%). Overall, the average premium was around 43%, but it is important to note that only products which had an available direct substitute product in the same supply were included in our calculations. It should be emphasized that prices did not really change during the observations, only occasionally were these products featured at a lower price in the promotional offer. In the calculation of the price premium, the most representative prices for the 12 months have been used for both GI and substitute products. Although prices did not change, there was some variation in supply, month by month, but we did not exclude products that were not available for a month. GIs with unique characteristics (e.g., Grana Padano cheese) which there was no direct alternative to were not included in our calculations.
If we look at the PDO and PGI products separately in each of the discount stores (see Figure7), we can see that while in Aldi there is no big difference in the average price premium for GI products, Lidl has a higher price premium (69%) for PDOs, while Penny Market has higher average for PGI (62%).
Sustainability2020,12, 1094 10 of 15
Sustainability 2020, 12, x FOR PEER REVIEW 10 of 15
Figure 6. GI products’ average price premium in the different discounters. Source: Own editing.
If we look at the PDO and PGI products separately in each of the discount stores (see Figure 7), we can see that while in Aldi there is no big difference in the average price premium for GI products, Lidl has a higher price premium (69%) for PDOs, while Penny Market has higher average for PGI (62%).
Figure 7. PDO and PGI products’ average price premium. Source: Own editing.
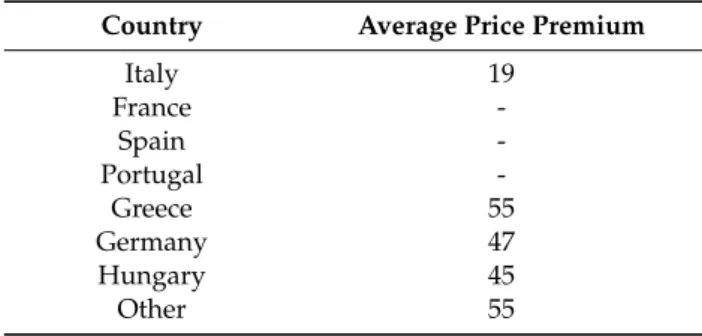
By country of origin, the average price premium was highest for Greek and Austrian food (55%), but German and Hungarian products are also only a few percent behind (Table 3).
29%
46%
54%
0%
10%
20%
30%
40%
50%
60%
Aldi Penny Market Lidl
26%
39%
62%
26%
69%
38%
0%
10%
20%
30%
40%
50%
60%
70%
80%
Aldi Lidl Penny Market
PGI PDO
Figure 6.GI products’ average price premium in the different discounters. Source: Own editing.
Sustainability 2020, 12, x FOR PEER REVIEW 10 of 15
Figure 6. GI products’ average price premium in the different discounters. Source: Own editing.
If we look at the PDO and PGI products separately in each of the discount stores (see Figure 7), we can see that while in Aldi there is no big difference in the average price premium for GI products, Lidl has a higher price premium (69%) for PDOs, while Penny Market has higher average for PGI (62%).
Figure 7. PDO and PGI products’ average price premium. Source: Own editing.
By country of origin, the average price premium was highest for Greek and Austrian food (55%), but German and Hungarian products are also only a few percent behind (Table 3).
29%
46%
54%
0%
10%
20%
30%
40%
50%
60%
Aldi Penny Market Lidl
26%
39%
62%
26%
69%
38%
0%
10%
20%
30%
40%
50%
60%
70%
80%
Aldi Lidl Penny Market
PGI PDO
Figure 7.PDO and PGI products’ average price premium. Source: Own editing.
By country of origin, the average price premium was highest for Greek and Austrian food (55%), but German and Hungarian products are also only a few percent behind (Table3).
In terms of product categories (Table 4), spices realized the highest mark-up (111%), while vegetables and fruits ranked second highest with an average price premium of 55%. Other product groups available had similar average price margins (33–37%).
Sustainability2020,12, 1094 11 of 15
Table 3.The average price premium of GI food products depending on the origin, %.
Country Average Price Premium
Italy 19
France -
Spain -
Portugal -
Greece 55
Germany 47
Hungary 45
Other 55
Source: Own editing.
Table 4.The average price premium of GI food products depending on the food category, %.
Category Average Price Premium
Vegetables, fruits 55
Cheese 33
Processed meat 37
Oils 33
Spices 111
Source: Own editing.
4. Discussion
It is clear from the literature and the observed market processes of the last decade that the spread of discounters in the food retail sector has undeniably been remarkable both in Europe and in Hungary.
In recent years, these types of stores have achieved the fastest growth in store numbers and sales, which is why the trends observed here can be a good indicator of the Hungarian food retailing processes, even if the research on discounters is not representative for the whole industry.
Our results show that currently, GIs have only limited importance in the Hungarian food market, both in terms of the number of products and their market share. Only a small number of this type of products are included in the food discounters’ offer, and the number of GI products in each discounter was less than 1% (in terms of the number of items) of their total food supply. At the same time, the fact that they have a limited supply and the majority of GI products available at discount prices are private labelled; all indicate that the products included in the supply are stable there. This also provides an opportunity for those current and future Hungarian GI products that can meet the strict delivery conditions required by the discounters.
If we consider the DOOR database as a benchmark, we can say that the proportion of PDO products is much higher in the Hungarian food discounters. This is also surprising because, according to Leufkens [17] and to Belletti, Burgassi, Manco, Marescotti, Pacciani, and Scaramuzzi [18], international trade of PGI products is more common. This phenomenon may be explained by the fact that most of the limited supply is made up of those PDO products, which international trade can be regarded as highly dominant (e.g., Italian and Greek cheeses). Based on the origin of the products, most of the food comes from imports; however, 18% of Hungarian products significantly exceed the share of Hungarian products in the DOOR database. Local sourcing becomes increasingly important for discounters, so the role of domestic GI products is also increasing. In addition to domestic products, Italian, Greek, and German products are overrepresented. However, the 41% share of Italian products is not surprising, given that Italy is the most important producer of GIs worldwide, while the high proportion of German products is explained by the fact that the examined discounters are all German-owned, which may influence their purchasing policies. However, the total shortage of products from other Mediterranean countries (France, Spain, and Portugal) is surprising because they represent a large number of products in the DOOR database [8]. It can be explained by the fact that the products of these countries are mainly
Sustainability2020,12, 1094 12 of 15
focusing on their domestic markets and that access to price-sensitive foreign consumers is not a priority for these products. In terms of product categories, processed products (mainly cheeses and meat products) are significantly over-represented in the available supply, while fresh products (vegetables, fruit, fresh meat) play a marginal role or do not even appear at all. Logistic explanations may be the main reason for this: Due to the additional cost of perishability, fresh GI products are not really determinative for discounters. As regards the premium achievable in consumer prices, the average price premium is remarkably high (43% on average) in the case of discounters, which are focusing on reaching price-sensitive consumers, indicating that there is a perceptible price premium for GI products in the Hungarian market. The difference between the individual discounters is significant, in Penny Market and Lidl, which sells most GIs as private labelled products, the average price premium is higher than in Aldi, which sells more commercial branded products. Our results are in line with those of previous literature, where they examined the premium price from the consumer side and found that consumers were willing to pay more for GI products (among others: [22–27]). Examining the relationship between the country of origin and the price premium, it can be pointed out that while most countries have a 45–55% mark-up, the price premium of the most important exporting Italian products is the lowest (19%). This also means that the price level of substitutes for Italian products is the closest to them, so Italian GI products have to compete with their prices. This also coincides with the fact that one of the lowest per product price premiums was found for GI cheeses coming from Italy, while for lower processed (though less available) vegetables, the same value is much higher, and the most significant premium is realized for spices according to our results.
It is important to consider the limitations of the study when interpreting the aforementioned results. Although food discounters represent key trends, they are not representative of the whole food retail trade. With the market size and price premium in the discounters, we can probably give an appropriate lower estimate for both of the attributes, since a food retailer with a much greater variety of supply and/or focusing on food specialties and less price-sensitive customers may have a much higher share and price premium of GI foods. Therefore, the topic will require further research in the future involving other types of stores (e.g., hypermarkets, online webshops) or involving discounters located in other countries, in order to gain a more comprehensive view of the GI food market.
5. Conclusions
Although GI foods play a key role in the European Union’s food quality policy and in its international trade agreements, the data needed for a comprehensive analysis of the sector is very limited. The economic data available to investigate the role of GIs in Hungary is also very limited.
Therefore, the primary purpose of the study is to estimate the market size of the sector and the price premium at consumer prices through the example of Hungarian food discounters. Through a 12 months long mystery shopping investigation involving three food discounter chains operating in Hungary, we created a database of 816 observations. Based on this analysis, the majority of GI products available in these discounters are imported (mainly Italian), with most products being private labelled and processed (cheese and meat) products. On the one hand, this shows that a few well-known Italian products dominate the Hungarian GI food market while many domestic products are not available.
On the other hand, GI foods are attractive enough for discounters to include them into their private labelled product portfolio.
The average price premium for GIs relative to their closest substitute products is 43%, which is particularly significant since discounters are traditionally aimed at price-sensitive consumers. Products from Italy and products with higher levels of processing had the lowest price premium, which also means that these products have to compete the most. These results could also encourage Hungarian producers to try to supply discounter chains, where they can achieve more favourable prices, compared to generic substitutes.
All in all, our study shows that the number of GI products in the Hungarian food discounters supply is currently relatively limited, but at the same time, it has a remarkable price premium. Based on
Sustainability2020,12, 1094 13 of 15
this, we were able to provide a lower estimate of the market size and price premium for these products in Hungary, which is expected to be higher in the case of food chains targeting less price-sensitive consumers of food retailing; however, this requires further research. Our results, therefore, enrich the limited empirical economic literature of the GI food sector.
Author Contributions:Conceptualization,Á.T.; Methodology,Á.T.; Formal Analysis, L.J. andÁ.T.; Resources, L.J.
andÁ.T.; Investigation, L.J.; Writing-Original Draft Preparation, L.J. andÁ.T.; Writing-Review & Editing,Á.T.;
Visualization, L.J. andÁ.T.; Supervision,Á.T.; Project Administration,Á.T.; Funding Acquisition,Á.T. All authors have read and agreed to the published version of the manuscript.
Funding: This paper was supported by the János Bolyai Research Scholarship of the Hungarian Academy of Sciences, by theÚNKP-19-4-BCE-01 New National Excellence Program of the Ministry for Innovation and Technology, and by the National Research, Development and Innovation Office projects of FK124800 and PD124791
“Economical and Social Impacts of Food Quality Schemes and Short Food Supply Chains in Hungary”.
Conflicts of Interest:The authors declare no conflict of interest.
References
1. Gangjee, D.S. Proving provenance? Geographical indications certification and its ambiguities.World Dev.
2017,98, 12–24. [CrossRef]
2. Giovannucci, D.; Josling, T.; Kerr, W.; O’Connor, B.; Yeung, M.T. Guide to Geographical Indications: Linking Products and Their Origins. 2009. Available online:https://www.origin-gi.com/images/stories/PDFs/English/
E-Library/geographical_indications.pdf(accessed on 31 January 2020).
3. Gangjee, D.S. Melton Mowbray and the GI pie in the sky: Exploring cartographies of protection.Intellect.
Prop. Q.2006,3, 291.
4. Moir, H.V.J. Understanding EU trade policy on geographical indications.J. World Trade2017,51, 1021–1042.
[CrossRef]
5. Jámbor, A.; Török,Á. A regionális kereskedelmi egyezmények létrejöttét meghatározótényez˝ok.Közgazdasági Szle2019,65, 428–433.
6. Engelhardt, T. Geographical indications under recent EU trade agreements.Int. Rev. Intellect. Prop. Compet.
Law2015,46, 781–818. [CrossRef]
7. von der Leyen, U. Mission Letter for The Commissioner-Designate for Agriculture. 2019. Available online:https://ec.europa.eu/commission/sites/beta-political/files/mission-letter-janusz-wojciechowski_en.
pdf(accessed on 31 January 2020).
8. Török,Á.; Moir, H.V.J. Understanding the Real-World Impact of Gis: A Critical Review of The Empirical Economic Literature. 2018. Available online:https://politicsir.cass.anu.edu.au/sites/default/files/docs/2018/7/
Briefing_Paper_GeographicalIndications_Vol.9_No.3.pdf(accessed on 31 January 2020).
9. London Economics. Evaluation of the Cap Policy on Protected Designations of Origin (PDO) and Protected Geographical Indications (PGI). 2008. Available online:http://londoneconomics.co.uk/wp-content/uploads/
2011/09/45-Evaluation-of-the-CAP-policy-on-protected-designations-of-origin-PDO-and-protected- geographical-indications-PGI.pdf(accessed on 31 January 2020).
10. Hungarian Ministry of Agriculture. Gi Program. Available online:http://gi.gov.hu/eredetvedelmi-program/
(accessed on 30 November 2019).
11. European Commission. Door Database. Available online:http://ec.europa.eu/agriculture/quality/door/list.
html?locale=en(accessed on 31 January 2020).
12. Török,Á.; Moir, H.V.J. The market size for gi food products–evidence from the empirical economic literature.
Stud. Agric. Econ.2018,120, 134–142. [CrossRef]
13. AND International. Value of Production of Agricultural Products and Foodstuffs, Wines, Aromatised Wines and Spirits Protected by A Geographical Indication (GI). 2012. Available online: https://ec.
europa.eu/agriculture/sites/agriculture/files/external-studies/2012/value-gi/final-report_en.pdf(accessed on 31 January 2020).
14. Arfini, F.; Capelli, M.G. The resilient character of PDO/PGI products in dynamic food markets. In Proceedings of the 113th EAAE Seminar “A Resilient European Food Industry and Food Chain in a Challenging World”, Chania, Crete, Greece, 3–6 September 2009.
Sustainability2020,12, 1094 14 of 15
15. Tibério, L.; Francisco, D. Agri-food traditional products: From certification to the market—Portuguese recent evolution.Reg. Sci. Inq.2012,4, 57–86.
16. Galli, F.; Carbone, A.; Caswell, J.A.; Sorrentino, A. A multi-criteria approach to assessing PDOs/PGIs: An Italian pilot study.Intl. J. Food Syst.2011,2, 219–236.
17. Leufkens, D. Eu’s regulation of geographical indications and their effects on trade flows.Ger. J. Agric. Econ.
2017,66, 223–233.
18. Belletti, G.; Burgassi, T.; Manco, E.; Marescotti, A.; Pacciani, A.; Scaramuzzi, S. The roles of geographical indications in the internationalisation process of agri-food products. InInternational Marketing and Trade of Quality Food Products; Canavari, M., Cantore, N., Castellini, A., Pignatti, E., Spadoni, R., Eds.; Wageningen Academic Publishers: Wageningen, The Netherlands, 2009; pp. 337–354.
19. Csillag, P.; Török,Á. PGI Gyulai sausage in Hungary. InSustainability of European Food Quality Schemes;
Arfini, F., Bellasen, V., Eds.; Springer: Cham, Switzerland, 2019; pp. 337–354.
20. Csillag, P.; Török,Á. PDO Kalocsai paprika powder in Hungary. InSustainability of European Food Quality Schemes; Arfini, F., Bellasen, V., Eds.; Springer: Cham, Switzerland, 2019; pp. 151–170.
21. Tregear, A.; Török,Á.; Gorton, M. Geographical indications and upgrading of small-scale producers in global agro-food chains: A case study of the makóonion protected designation of origin.Environ. Plan. A2016,48, 433–451. [CrossRef]
22. Aprile, M.C.; Gallina, G. Quality perception using signals on food labels: An analysis on Italian consumers.
In Proceedings of the 18th Annual IAMA Symposium, Monterey, CA, USA, 14–17 June 2008; International Food and Agribusiness Management Association: Monterey, CA, USA, 2008.
23. Bryła, P. The perception of EU quality signs for origin and organic food products among polish consumers.
Qual. Assur. Saf. Crop. Foods2017,9, 345–355. [CrossRef]
24. Fotopoulos, C.; Krystallis, A.; Anastasios, P. Portrait value questionnaire’s (pvq) usefulness in explaining quality food-related consumer behavior.Br. Food J.2011,113, 248–279. [CrossRef]
25. Groot, E.; Albisu, L.M. Maxdiff Approaches for PDO “Calanda” Peaches (Spain). Available online:https://pdfs.semanticscholar.org/3671/ebac9b608063aedcf4a5aa4bc6d2719fb95a.pdf?_ga=2.42999141.
150210048.1580714003-2105981417.1569298795(accessed on 31 January 2020).
26. Sahelices, A.; Mesias, F.J.; Escribano, M.; Gaspar, P.; Elghannam, A. Are quality regulations displacing PDOs?
A choice experiment study on Iberian meat products in Spain.Ital. J. Anim. Sci. 2017,16, 9–13. [CrossRef]
27. Urbano, B.; González-Andrés, F.; Casquero, P. Market research for the optimization of the consumers response to the recent award of a protected geographical indication to a local product, beans from “La Bañeza-León”
(Spain).J. Int. Food Agribus. Mark.2008,20, 7–32. [CrossRef]
28. Simioni, M.; Bonnet, C. Assessing consumer response to protected designation of origin labelling: A mixed multinomial logit approach céline bonnet.Eur. Rev. Agric. Econ.2001,28, 433–449.
29. Aprile, M.C.; Caputo, V.; Nayga, R.M. Consumers’ valuation of food quality labels: The case of the European geographic indication and organic farming labels.Int. J. Consum. Stud.2012,36, 158–165. [CrossRef]
30. Menapace, L.; Colson, G.; Grebitus, C.; Facendola, M. Consumers’ preferences for geographical origin labels:
Evidence from the Canadian olive oil market.Eur. Rev. Agric. Econ.2011,38, 193. [CrossRef]
31. Vecchio, R.; Annunziata, A. The role of pdo/pgi labelling in italian consumers’ food choices.Agric. Econ. Rev.
2011,12, 80–98.
32. Wilson, A.M. Mystery shopping: Using deception to measure service performance.Psychol. Mark.2001,18, 721–734. [CrossRef]
33. Friedrichs, J.Participant Observation: Theory and Practice; Saxon House: Lexington, MA, USA, 1975; p. 257.
34. Liu, C.-H.S.; Su, C.-S.; Gan, B.; Chou, S.-F. Effective restaurant rating scale development and a mystery shopper evaluation approach.Int. J. Hosp. Manag. 2014,43, 53–64. [CrossRef]
35. Yaoyuneyong, G.; Whaley, J.E.; Butler, R.A.; Williams, J.A.; Jordan, K.L.; Hunt, L. Resort mystery shopping:
A case study of hotel service.J. Qual. Assur. Hosp. Tour.2018,19, 358–386. [CrossRef]
36. Lamb, C.W.; Hair, J.F.J.; McDaniel, C.Marketing, 11th ed.; Cengage Learning: Mason, OH, USA, 2011.
37. Hartmann, M.; Yeh, C.-H.; Amilien, V.; ˇCelikovi´c, Z.; Csillag, P.; Filipovi´c, J.; Giraud, G.; Gorton, M.;
Menozzi, D.; Quarrie, S.; et al. Quantitative Research Findings on European Consumers’ Perception and Valuation of eu Food Quality Schemes as Well as Their Confidence In Such Measures. 2018.
Available online:https://www.strength2food.eu/wp-content/uploads/2018/03/D8.1-Consumer-analysis-on- food-quality-schemes-compressed-protected.pdf(accessed on 31 January 2020).
Sustainability2020,12, 1094 15 of 15
38. Török, Á.; Maró, Z.M.; Jantyik, L. A magyar fogyasztók és az európai uniós földrajzi árujelzôs élelmiszercímkék viszonya.Stat. Szle.2019,97, 546–567. [CrossRef]
39. Hökelekli, G.; Lamey, L.; Verboven, F. The battle of traditional retailers versus discounters: The role of pl tiers.J. Retail. Consum. Serv.2017,39, 11–22. [CrossRef]
40. Gijsbrechts, E.; Campo, K.; Vroegrijk, M. Save or (over-)spend? The impact of hard-discounter shopping on consumers’ grocery outlay.Int. J. Res. Mark. 2018,35, 270–288. [CrossRef]
41. Willems, K.; Leroi-Werelds, S.; Swinnen, G. The impact of customer value types on customer outcomes for different retail formats.J. Serv. Manag.2016,27, 591–618. [CrossRef]
42. Geppert, M.; Williams, K.; Wortmann, M. Micro-political game playing in Lidl: A comparison of store-level employment relations.Eur. J. Ind. Relat.2015,21, 241–257. [CrossRef]
43. ´Smigielska, G.; Stefa ´nska, M. Innovative positioning as a marketing tool of retailers on the food market.
Entrep. Bus. Econ. Rev.2017,5, 77–90. [CrossRef]
44. Neumeier, S. Regional accessibility of supermarkets and discounters in Germany—A quantitative assessment.
Landbauforsch. Volkenrode2015,65, 29–46.
45. Liu, Y.; Chen, X.; Rabinowitz, A.N. The role of retail market power and state regulations in the heterogeneity of farm-retail price transmission of private label and branded products. Agric. Econ. 2019,50, 91–99.
[CrossRef]
46. Larson, R.B. Profiling prospective private-label buyers. Int. Rev. Retail Distrib. Consum. Res. 2018,28, 516–530. [CrossRef]
47. Monier-Dilhan, S. Food labels: Consumer’s information or consumer’s confusion.OCL Oilseeds Fatscrops Lipids2018,25, 1–4. [CrossRef]
48. Hermann, Z. FMCG Commercial Toplist. Trade Magazin. 2019. Available online:https://trademagazin.hu/
hu/megjelent-az-fmcg-piac-2018-evi-kereskedelmi-toplistaja/(accessed on 31 January 2020).
49. Török, Á. A HÍR Védjegy Ismertsége és Beágyazódottsága a Magyar Fogyasztók Körében.
Táplálkozásmarketing2019,6, 81–97. [CrossRef]
©2020 by the authors. Licensee MDPI, Basel, Switzerland. This article is an open access article distributed under the terms and conditions of the Creative Commons Attribution (CC BY) license (http://creativecommons.org/licenses/by/4.0/).