TERRITORIAL DISPARITIES IN HUNGARIAN TOURISM 2003 - 2013 Ágnes Béres-Virág1, Szergej Vinogradov2
1assistant lecturer; 2associate professor
1,2Faculty for Economics and Social Sciences, Szent István University E-mail: 1virag.agnes@gtk.szie.hu; 2vinogradov.szergej@gtk.szie.hu Abstract
In recent years the demand to Hungary has been increasing, the domestic and international tourism is more significant. During our survey we examined how smooth the touristic performance in our country, which are the most visited settlement and what rural areas could/can benefit from the operation of tourism. We also considered it important to examine whether the economic role of tourism can be detected along with statistical data.
Keywords: tourism, regional inequality, destination, Hoover index JEL: L83
LCC: G154.9-155.8 Introduction
After the change of regime in Hungary, parallel to the changes in the role of agriculture, unfavorable tendencies emerged, different spatial structures formed, increasing the extent of territorial inequality (Koós and Virág, 2010). The biggest losers of spatial restructuring were disadvantaged, peripheral rural areas. Opportunities for employment have typically decreased, local (economic, social) developments were weak or were not realized at all in many cases. As a result of global economic processes and spatial transformations, territorial policy became increasingly important. One of the most important objectives of the European Union's territorial and rural development policy is to help underprivileged regions catch up (Kassai and Ritter, 2011). Due to the rapidly changing economic and social processes in time and space, territorial imbalances are created, which need to be reduced by appropriate utilization and development of endogenous resources (Káposzta, 2014). Numerous literature deals with the economic and social problems of rural areas; and their future potential and development (Kombol, 1998;
Briedenhann – Wicken, 2004; Liu, 2006; Áldorfai, 2014; Ritter, 2014; Oláh et al., 2013; Nagy et. al, 2012; Némediné and Péli, 2017).
In rural areas, many people see tourism as a possibility for breakthrough, which can improve economic and social problems in smaller settlements (Nagy et al., 2017). Tourism can be an important tool for territorial and rural development as a means of economic convergence, conservation and sustainable use of natural and other resources, and can contribute to improving the quality of life of local residents. However, it is worth pointing out that only tourism cannot solve the economic and social problems of rural areas. Many other factors are needed for the proper functioning of tourism, such as the hospitable behavior of locals, common supply and program organization, public security, etc. (Hanusz, 2008).
Tourism is growing and setting new records both internationally and domestically in recent years. Its economic significance is well demonstrated by its increasing role in employment both on global and national levels as well as its contribution to the gross domestic product (GDP).
In 2016, tourism accounted for 10% of world GDP (UNWTO, 2017), while in Hungary its contribution to the GDP was 9.8% (KSH, Turizmus Szatellit Számla 2013, 2017). The role of
the sector in employment is strengthened by the fact that every 10th person's job is related to tourism (UNWTO, 2017), while tourism related employment in Hungary is 12% (KSH, Turizmus Szatellit Számla 2013, 2017). More than 22 million people visited Hungary as tourists in 2017, who spent 1386,2 billion HUF in total during their visit. Those who spent more than one day here were likely to visit the Nyugat-Dunántúl and Dél-Alföld regions, besides Budapest. If take a look at the list of cities where most of the guest nights were spent at commercial accommodations then we will find that Budapest, Hévíz, Hajdúszoboszló, Bük and Siófok are the top five. Beside the economic indicators, the performance indicators of tourism have also risen; the number of guests, the occupancy rate of accommodations and income have been increasing dynamically. However, there are significant territorial differences behind the national record numbers, which are due to be mitigated by the National Development 2030 and the National Tourism Development Strategy 2030 plans. In our survey we rely on data from 2003 and 2013, but we also considered it important to show the latest statistic data as well. This way one can compare the data with the intention to check if there was a change of participants during the touristic expansion or the same settlements rule and profit from the tourist market.
A common concern of Europe and Hungary is to promote rural areas with major economic and social problems, so one of the priorities of the European Union and Hungary's rural development policy is to support disadvantaged areas via endogenous resource-based developments. Economic diversification is a highly important factor in which tourism can play a significant role in the development of agricultural areas. In addition to the decline in agricultural employment, multifunctionality is becoming more and more important. For example, many secondary goods are created besides the production of food during agricultural work, which could be used for developing peripheral regions (Fodor and Gemma, 2011). Since the change of regime, the touristic value of the countryside has been gradually appreciated (Forman, 2010). Rural areas are characterized by different social, economic and other problems, and in many cases associates are hoping to overcome disadvantages by developing tourism (Nagy et al., 2017). In our opinion, tourism is indeed a good option, but it is also worth paying attention to the development of other areas (human resources, living standards, job opportunities, infrastructure). From this point of view, it was important to examine whether the outstanding role of tourism in rural areas can be verified by statistical data. Tourism is growing and setting new records both internationally and domestically in recent years. Its economic significance is well demonstrated by its increasing role in employment both on global and national levels as well as its contribution to the gross domestic product (GDP). Beside the economic indicators, the performance indicators of tourism have also risen; the number of guests, the occupancy rate of accommodations and income have been increasing dynamically.
Material and method
In our research, we found it was important to examine the regional inequalities typical of the performance of domestic tourism, which settlements are among the most important tourist destinations. We have set the goal of examining the territorial disparity on national and local levels in terms of tourism. We chose the Hoover Index, which is one of the important measurements for quantifying territorial inequalities. By using the Hoover index, the difference in the territorial distribution of two quantitative criteria becomes measurable. On a scale of 0 to 100%, the Hoover index shows how many percent of the examined attribution should be redeployed between the territorial units (settlements) in order to make its spatial distribution exactly the same as that of the other attribution examined. There is no percentage threshold when speaking of small or large territorial inequalities. In spatial researches, the distribution of socio-economic characteristics are most often compared to the territorial distribution of the population (Nemes Nagy et al., 2005).
Based on the literature and related researches, 8 variables were selected using the settlement- level data available in the TEIR and KSH databases. During the study, the different criteria were compared with the territorial distribution of population. We compared the regional distribution of 7 touristic characteristics to the distribution of permanent population by settlements. Budapest was also part of the calculation of the Hoover index but due to its significant distortion, we excluded it from the final investigation. In our opinion, the tourism industry is concentrated only in a few domestic settlements.
Results
The selected touristic data showed significant territorial differences. In the following, we will analyze the inequalities related to tourism in detail, highlighting which settlements have distorted most the territorial distribution of indicators related to tourism performance. The most distorting settlements correspond to the best performing tourist destinations.
First we compared the territorial distribution of the permanent population of domestic settlements to the distribution of tourist tax (IFA) collected by settlements. Based on the Hoover index, significant territorial inequality emerged: in 2003 the value of the Hoover index was 79.3%, while in 2013 it was 73.03% (Table 1). Positive change is that the territorial difference has diminished, but the difference remained significant. This means that 73.03% of the IFA collected in 2013 should be redeployed between the territorial units in order to be equal to the characteristic of the permanent population, and thus to create territorial equality (all index figures shown in the following should be interpreted similarly, so we do not explain them in detail from this aspect in the following). By examining which settlements show the greatest difference in the distribution of the two examined characteristics, it can be concluded that the best performing settlements in 2003 were Hévíz, Hajdúszoboszló and Balatonfüred, while in 2013, the first two settlements of the leading field remained unchanged, and Siófok took third place.
Table 1: Settlement level territorial disparities (Hoover-index) in the case of tourist tax in 2003 and in 2013 (%)
Index compared to the permanent population Hoover-index 2003 (%)
Hoover-index 2013 (%)
Tourist tax 79.87 73.03
Source: My own research and editing, 2018.
Examining the territorial distribution of permanent population compared to housing capacities of commercial accommodations, significant territorial inequality was shown. The Hoover index was 60.51% in 2003, and the three settlements with the largest differences in the territorial distribution of the examined characheristics were Siófok, Balatonfüred and Hegykő. By 2013, the Hoover index grew to 63.43%, so the regional inequality increased, compared to 2003.
Mostly Zamárdi, Siófok and Balatonfüred contributed to creating significant regional differences in 2013.
We compared the population to the territorial distribution of guest nights spent at commercial accommodations. The territorial differences of the two examined aspects are characterized by a Hoover index of above 60% in both years: 63.72% in 2003 and 65.90% in 2013, which means that the level of inequality has increased in this case as well. The biggest differences were found in Hévíz, Siófok and Hajdúszoboszló in 2003, whereas in 2013 the biggest differences were shown in Hévíz, Hajdúszoboszló and Bük. If we examine the population compared to the territorial distribution of the number of guest nights spent by foreigners separately, we can
conclude that there are significant territorial inequalities along these two indicators. In 2003, the value of the Hoover index was 74.65%, then decreased to 70.09% by 2013. In 2003 the biggest difference in the territorial distribution of the two measured values was found in Hévíz, Siófok and Balatonfüred, while in 2013 the most significant difference was shown in Hévíz, Bük and Sárvár.
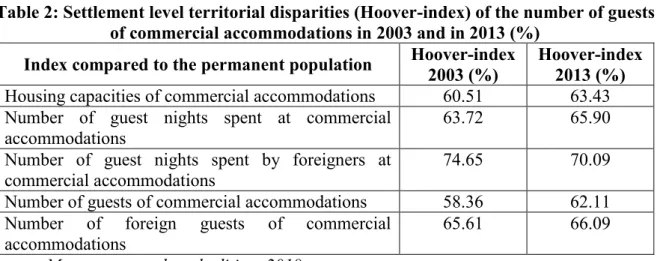
The territorial distribution of the population of Hungarian settlements was compared to the regional distribution of the number of guests of accommodations and in this case the value of the Hoover index was 58.36% in 2003, which increased to 62.11% in 2013, meaning that significant territorial disparity was shown in both years (Table 2). Siófok, Hévíz and Hajdúszoboszló showed the largest difference between the territorial distribution of the two data both in 2003 and in 2013. If we compare the territorial distribution of the number of foreign guests to the territorial distribution of the population at settlement level, we can speak of an even greater territorial imbalance, the Hoover index was 65.61% in 2003, and by 2013 the difference got even bigger (66.09%). Siófok, Hévíz and Balatonfüred showed the biggest difference between the two characteristic in 2003, while in 2013 the order was Hévíz, Sárvár and Bük.
Table 2: Settlement level territorial disparities (Hoover-index) of the number of guests of commercial accommodations in 2003 and in 2013 (%)
Index compared to the permanent population Hoover-index 2003 (%)
Hoover-index 2013 (%) Housing capacities of commercial accommodations 60.51 63.43 Number of guest nights spent at commercial
accommodations 63.72 65.90
Number of guest nights spent by foreigners at commercial accommodations
74.65 70.09
Number of guests of commercial accommodations 58.36 62.11 Number of foreign guests of commercial
accommodations 65.61 66.09
Source: My own research and editing, 2018.
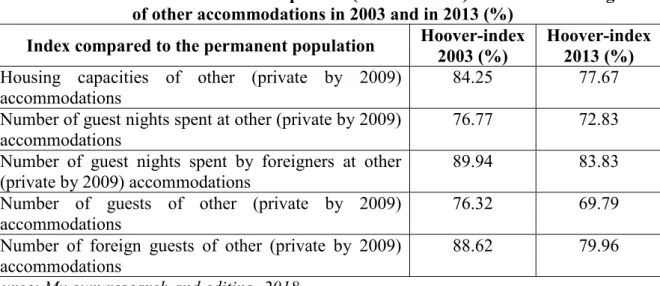
In addition to commercial accommodations, we also investigated how the population of settlements was related to the data of other (private) accommodations in the two years examined, how big regional inequalities can be detected. First, we compared the regional distribution of population to the settlement based distribution of housing capacities of other accommodations. From 2003 to 2013, the Hoover index decreased by more than 6 percentage (2003: 84.25%; 2013: 77.67%), but the difference was still significant in both years. In 2003 the order was Siófok, Balatonlelle and Fonyod, while in 2013 Siófok was followed by Hajdúszoboszló and Balatonlelle in showing the greatest difference in the territorial distribution of the two examined characteristic.
If we take the territorial distribution of the number of guest nights of other accommodations and the population, the Hoover index was 76.77% in 2003 and 72.83% in 2013, which is also a significant regional difference. In 2003, the biggest difference was shown in Balatonboglár, Zamárdi and Hajdúszoboszló, and in 2013 the most significant difference was found in Hajdúszoboszló, Siófok and Alsóörs.We also examined the territorial distribution of population compared to foreign guest nights, and in this case the Hoover index measuring the territorial difference between the two indicators was 89.94% in 2003 and 83.83% in 2013. In 2003, the biggest difference was in Zamárdi, Balatonboglár and Siófok, while in 2013 we measured it in Hajdúszoboszló, Bük and Alsóörs.
We compared the territorial distribution of permanent population of settlements to the regional distribution of the number guests of other accommodations (Table 3), which showed a significant difference as well (76.32% in 2003, 69.79% in 2013). In 2003 Balatonboglár, Hajdúszoboszló and Siófok settlements contributed the most to territorial inequality, while in 2013 the largest difference between the territorial distribution of the two criteria was measured in Hajdúszoboszló, Siófok and Alsóörs. If we look at the territorial distribution of the number of foreign guests compared to the permanent population, we can determine even more significant territorial differences. In 2003, the Hoover index was 88.62%, with the largest differences between the two characteristic found in Balatonboglár, Siófok and Zamárdi, while in 2013 the most significant deviation was measured in Hajdúszoboszló, Bük and in Siófok settlements.
Table 3: Settlement level territorial disparities (Hoover-index) of the number of guests of other accommodations in 2003 and in 2013 (%)
Index compared to the permanent population Hoover-index 2003 (%)
Hoover-index 2013 (%) Housing capacities of other (private by 2009)
accommodations 84.25 77.67
Number of guest nights spent at other (private by 2009) accommodations
76.77 72.83
Number of guest nights spent by foreigners at other (private by 2009) accommodations
89.94 83.83
Number of guests of other (private by 2009) accommodations
76.32 69.79
Number of foreign guests of other (private by 2009) accommodations
88.62 79.96
Source: My own research and editing, 2018.
It was also examined how the distribution of restaurants and confectioneries in settlements is related to the territorial distribution of the permanent population of settlements. In 2003 the Hoover index was 22.72%, while in 2013 it was 27.45% (Table 4), so the territorial inequality has increased, but it was not so significant like based on commercial and other accommodation.
The biggest difference between the territorial distribution of the two criteria was shown by Siófok, Nyíregyháza and Balatonalmádi in 2003, while in 2013 the order was Siófok, Nyíregyháza and Balatonfüred.
If we compare the territorial distribution of the number of catering facilities to the territorial distribution of the permanent population of settlements (Table 4), then based on the Hoover index values (2003: 16,16%; 2013: 19.36%) we can detect a small territorial imbalance. In 2003 Siófok, Nyíregyháza, Balatonfüred was the order; while in 2013 in the case of Siófok, Békéscsaba and Balatonfüred was the greatest difference between the territorial distributions of the two characteristics.
In the case of the territorial distribution of operating enterprises related to accommodation and catering services and the same related to the permanent population (Table 4), the index was 18,99% in 2003 and 18.07% in 2013, which is also a small regional difference. The largest difference between the two criteria was shown by Siófok, Hajdúszoboszló and Balatonfüred in 2003. In 2013 the greatest differences was in the case of Siófok, Eger and Balatonfüred.
Table 4: Settlement level territorial disparities (Hoover-index) in the case of restaurants, confectioneries, catering services and companies in 2003 and in 2013 (%)
Index compared to the permanent population Hoover-index 2003 (%)
Hoover-index 2013 (%) Number of restaurants and confectioneries 22.72 27.45
Number of catering services 16.46 19.36
Number of companies involved in accommodation and catering services
18.99 18.07
Number of operating businesses 18.16 17.15
Source: My own research and editing, 2018.
Based on the results of the studies on commercial and other accommodation data, the Hoover index was calculated from the aggregate data of the two (commercial, other) accommodation types (Table 5). Significant differences can be seen in the territorial distribution of the statistical data of the two accommodation types compared to the permanent population of settlements in the two years examined, so the question arises as to whether the aggregation of the same natural indicators of the two accommodation types result in a change in the level of territorial inequality. First we examined the regional distribution of every accommodation, the Hoover index was 68.07% in 2003 and 66.74% in 2013, indicating significant territorial differences at the settlement level. The largest difference between the two examined characteristics in 2003 were in Siófok, Hajdúszoboszló and Balatonfüred, while in 2013 it was the largest in Zamárdi, Siófok and Hajdúszoboszló.
Table 5: Settlement level territorial disparities (Hoover-index) in the case of total number of guests at all accommodation types (commercial and other) in 2003 and in
2013 (%)
Index compared to the permanent population Hoover-index 2003 (%)
Hoover-index 2013 (%)
Total number of housing capacity 68.07 66.74
Total number of guest nights 64.53 65.48
Total number of guest nights spent by foreigners 77.05 70.96
Total number of guests 58.59 61.57
Total number of foreign guests 67.84 66.57
Source: My own research and editing, 2018.
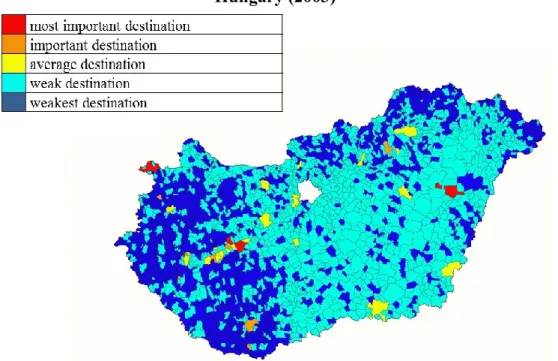
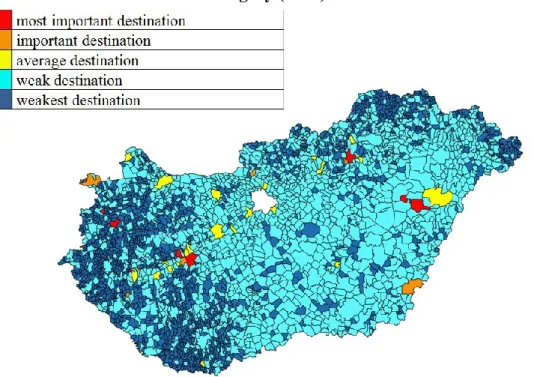
If the regional distribution of the number of guest nights of all accommodation types is compared to the regional distribution of the permanent population, then the Hoover index was 63.72% in 2003, so significant territorial difference can be seen. The most significant differences in the territorial distribution of the two characteristics was shown in Hévíz, Siófok and Hajdúszoboszló. To illustrate the regional inequalities, we have classified the settlements into five groups based on the absolute deviation of their percentage shares when the number of guest nights is compared to the number of permanent population. Based on the size of the absolute differences in the territorial distribution of the two characteristics, tourist destinations were classified to five groups: the highest level (above 2.00%), high level (1.00-2.00%), medium level (0.50-0.99%), low level (0.01-0.49%), and the lowest level (0.01%) territorial inequality. The following relationship can be established between the contribution to territorial inequality and the performance in tourism: the settlements with the highest levels of territorial disparity are the most significant, while the weakest tourist destinations are those with the lowest level of territorial differences; accordingly, the five groups were referred to as the
following: the most significant, significant, average, weak and weakest tourist destinations.1 All in all, apart from a few settlements in the country, a significant territorial inequality can be established based on this study. The number of the most significant and significant destinations is extremely low, but the average number of destinations was quite low as well in 2003, while the number of weak and weakest tourist areas was extremely large (Figure 1).
Figure 1: Territorial disparities of guest nights of all types of accommodations in Hungary (2003)
Source: My own research and editing, 2018.
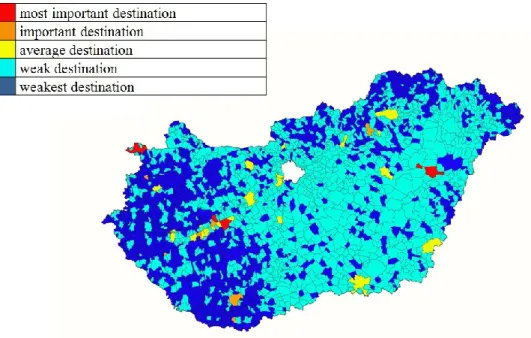
We also examined the distribution of the number of guest nights of all accommodation types relative to the number of permanent population for 2013. This year, the Hoover index was 65.48% and Hévíz, Hajdúszoboszló and Siofok showed the largest territorial distribution. The most significant destinations have remained the same, but tourist destinations that were considered significant in 2003 has become average tourist destinations by 2013. At the same time, the number of weak and weakest tourist areas remains high in Hungary (Figure 2).
We have also examined the settlement-level distribution of foreign guest nights spent at all types of accommodations compared to the permanent population, the Hoover index exceeded 70% in both years: 77.05% in 2003 and 70.96% in 2013. The biggest difference in 2003 was shown in Hévíz, Siófok and Bük, while in 2013 Hévíz, Bük and Hajdúszoboszló was the order.
We compared the total number of guests and the number of foreign guests separately to the regional distribution of the permanent population of the settlements, and the Hoover index was close to 60%. In the case of the total number of guests, the Hoover index was 58.59% in 2003, which means a significant territorial imbalance. The biggest differences were found in Siófok, Hévíz and Hajdúszoboszló in 2003, so the tourism performance was best in these settlements based on the territorial distribution of the two characteristics. Both when the number of guest nights and when the number of guests was compared to the population the numbers of the most
1 The same groups or tourist destination classifications were defined on the basis of the same values in the case of the figures illustrating the regional inequalities of domestic tourism (Figures 1 to 4) as well.
significant, significant and average tourist destinations were extremely low, so most of the destinations belong in the weak and weakest category (Figure 3.)
Figure 2: Territorial disparities of guest nights of all types of accommodations in Hungary (2013)
Source: My own research and editing, 2018.
Figure 3: Territorial disparities of the number of guests of all types of accommodations in Hungary (2003)
Source: My own research and editing, 2018.
For the year 2013 we also compared the territorial distribution of the total number of guests to the regional distribution of the permanent population of settlements, and the high value of the Hoover index (61.57%) again indicates significant regional inequalities. The most significant difference was found in Siófok, Hajdúszoboszló and Hévíz, which means that these were the
"top" destinations. When the number of guests was compared to the population, the numbers of
the most significant, the significant and the average tourist destinations were even less by 2013, while the weak and the weakest destinations are still in majority (Figure 4).
Figure 4: Territorial disparities of the number of guests of all types of accommodations in Hungary (2013)
Source: My own research and editing, 2018.
The number of foreign guests also showed significant regional inequality on the basis of the Hoover index: the difference in the territorial distribution of the examined indicators was characterized by 67.84% in 2003 and 66.57% in 2013. The territorial difference of the number of foreign guest nights compared with the permanent population was the most significant in the case of Siófok, Hévíz and Balatonfüred in 2003, while in 2013 Hévíz, Bük and Sárvár settlements showed the largest territorial difference between the two examined criteria.
Conclusion
Overall, it can be stated that when the territorial distribution of the permanent population of domestic settlements is compared to touristic variables significant territorial inequalities can be identified. The size of the territorial differences has decreased in some cases, but overall a very small change can be measured from 2003 to 2013. The institutionalized forms of tourism co- operation, the activities of the destination management organizations did not really increase tourist turnover based on statistical data in the examined years. Based on the research carried out with the exclusion of Budapest, Hévíz, Siófok, and Hajdúszoboszló settlements contributed to the greatest territorial differences in the years under review, which means that they were the most important tourist destinations both in 2003 and in 2013. It can also be concluded that domestic tourism is mostly concentrated in the settlements of Lake Balaton and major spa towns. On the basis of the results of the research carried out at the national level, the Hoover index calculations also revealed that the settlements of rural areas were among the weak and the weakest tourist destinations, so their performance in tourism is far behind the top destinations.
Sources
1. Áldorfai Gy. (2014): Methodoiogy examination of the local economic development based on subjective factors. VESTNIK APK STAVROPOLYA / AGRICULTURAL BULLETIN OF STAVROPOL REGION 1 (13): pp. 4-7.
2. Briedenhann J. – Wickens E. (2004): Tourism routes as a tool for the economic development of rural areas—vibrant hope or impossible dream? Tourism Management 25 pp. 71–79.
3. Fodor K. – Gemma F. (2011): A mezőgazdaság árbefolyásoló szerepe a falusi
turizmusban. A Falu. 2011. február 8. download:
http://www.afalu.hu/cikkek/a_falu/a_mezogazdasag_arbefolyasolo_szerepe_a_falusi _turizmusban (2014.02.05.)
4. Forman B. (2010): Borturizmus és a vidékfejlesztés. A Falu. 2010. február 24. letöltve:
http://www.afalu.hu/cikkek/borturizmus_es_a_videkfejlesztes (2014.02.05.)
5. Hanusz Á. (2008): Turisztikai programok, mint a vidékfejlesztés lehetséges eszközei Szabolcs-Szatmár-Bereg megyében. In: Hanusz Á (szerk): A turizmus szerepe a kistérségek és a régiók gazdasági felzárkóztatásában. Nyíregyháza Város és a Nyíregyházi Főiskola Nyíregyháza, pp. 63-79.
6. Káposzta J. (2014): Területi különbségek kialakulásának főbb összefüggései, Gazdálkodás 58. évfolyam, 2014/5. szám, pp. 399-412
7. Kassai Zs. - Ritter K. (2011): Helyi vidékfejlesztési programok a hátrányos helyzetű vidéki kistérségekben. Gazdálkodás55 (4) pp. 337-346. ISSN 0046-5518.
8. Kombol, T. P. (1998). Rural Tourism and Croatia’s Islands. Paper Presented at the Rural Tourism Management: Sustainable Options International Conference, Auchincruive, Scotland, 1998.
9. Koós B. – Virág T. (2010): Nyertesek és vesztesek – A magyar településhálózat polarizálódása. In: Barta Gy – Beluszky P. – Földi Zs. – Kovács K. (szerk.): A területi kutatások csomópontjai Pécs: MTA Regionális Kutatások Központja, 2010. pp. 32-54.
10. KSH (2017): Turizmus Szatellit Számlák, 2013.
11. Liu A. (2006): Tourism in rural areas: Kedah, Malaysia. Tourism Management 27pp.
878–889.
12. Nagy H. – Tóth T. – Oláh I (2012): The role of local markets in the sustainable economic development of Hungarian rural areas. Visegrad Journal On Bioeconomy And Sustainable Development 1:(1) pp. 27-31.
13. Nagy H. – Varga-Nagy A. – Káposzta J. (2017): The potentials of special forms of tourism in catching up of rural areas of Hungary. In: Kamila Borseková , Anna Vanová, Katarína Vitálisová (szerk.): 6th Central European Conference in Regional Science "Engines of Urban and Regional Development": Conference Proceedings.
Banská Bystrica, Szlovákia, pp. 169-178.
14. Nemzeti Fejlesztés 2030/National Development 2030
15. Nemzeti Turizmusfejlesztési Stratégia 2030/National Tourism Development Strategy 2030
16. Némediné Kollár K. – Péli L. (2017): A hungarikumok vidékgazdasági szerepének főbb aspektusai. In: Ritter K. (szerk.): Vidékgazdasági tanulmányok. Gödöllő, Szent István Egyetemi Kiadó, pp. 23-32. ISBN 978-963-269-604-1
17. Nemes Nagy J. (szerk.) (2005): Regionális elemzési módszerek. Regionális Tudományi Tanulmányok 11. kötet. ELTE Regionális Földrajzi Tanszék – MTA- ELTE Regionális Tudományi Kutatócsoport, Budapest, 284 p.
18. Ritter K. (2008): A helyi fejlesztés esélyei – agrárfoglalkoztatási válság és területi egyenlőtlenségek Magyarországon. Területi statisztika 48. (5) pp. 554-572.
19. Ritter K. (2014): Possibilities of local economic development (led) in lagging rural areas. Acta Carolus Robertus 4 (1) pp. 101 – 107.
20. UNWTO (2017): Tourism Highlights. Spain, 14 p.
21. Wachtler I. (2003): Falusi turizmus. In: Magda S. – Marselek S. (szerk.): Észak- Magyarország agrárfejlesztéseinek lehetőségei. Agroinform Kiadó, Gyöngyös, pp.
189-200.