THE KEY TO INCREASING COMPETITIVENESS IS INVESTING INTO HUMAN RESOURCES
Magdolna Csath professor emeritus
Faculty of Economics and Social Sciences, Szent István University E-mail: Csath.Magdolna@gtk.szie.hu
Abstract
This paper focuses attention on the fact that the V4 (Visegrád) countries are not equally well prepared to capitalize on the opportunities offered by the fourth industrial revolution because of the differences in the quality and skills of their human resources. On top of this they lag behind the more developed competitor countries in Western Europe in almost all major human indicators. Nine indicators describing human and knowledge characteristics are analyzed for the V4 and 5 developed countries.
In some cases Poland stands out with a slightly better result, but together as a group the V4 countries lag behind for all the analyzed indicators compared to the 5 developed countries.
Figure 10 which summarizes the results of 5 key indicators proves this problem. The article ends by suggesting that unless the V4 countries start putting stronger emphasis on developing human and knowledge resources they will lose a historic opportunity for becoming a successful actor in the ongoing processes of the fourth industrial revolution.
Keywords: Fourth industrial revolution, human resources, intangibles, education, life-long learning, multidimensional skills
JEL besorolás: R10, R11 LCC: HD72-88
Introduction
We live now in the age of emerging opportunities created by the fourth industrial revolution.
Using a management term this is a game changing time, which will alter seriously how we live, and how we work.
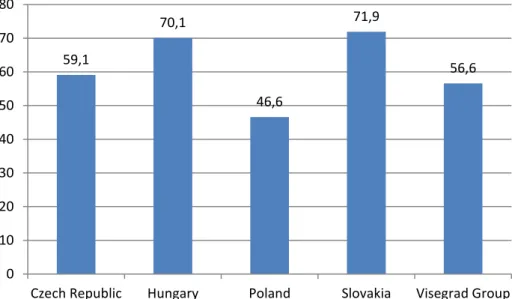
A recent OECD report (2018) has warned that in a sample of 32 countries 14 percent of the present jobs will perfectly disappear, and another 33 percent will be dramatically altered. The OECD report suggests that the highest risk of job automation will happen in the Eastern European and Southern European countries due to the large proportion of low-skilled manufacturing jobs. The Slovak and Hungarian jobs are at the highest risk of automation, as the share of assembly type manufacturing in value added is high. (Figure 1.)
Scandinavian jobs are at the lowest risk, due to the low percentage of easily automatable manufacturing jobs.
Figure 1. Share of foreign manufacturing affiliates in value added (at factor cost, 2015) Source: Based on Eurostat data
Governments and businesses are equally responsible for creating new and complex education and training systems to prepare not only the future workforce, but the present working population, as well, in order to meet the knowledge and skills requirements of this new world.
Those countries which will fail to adjust human resources in time will find themselves to be left out, and left behind. This paper presents a comparative analysis of the so-called V4 countries in term of how well prepared their human and knowledge resources are for capturing the opportunities of the fourth industrial revolution. The human resource characteristics of these countries will also be measured against those of three Scandinavian countries within the EU, as all relevant research findings suggest that these are the countries which will benefit the most from the fourth industrial revolution. Therefore it is interesting to contrast how far behind the V4 countries are from these probable frontrunners. Also two additional countries, Austria and Germany are included in the sample because of their strong economic relationships with the V4 countries. Finally the key characteristics of the V4 countries are also measured against the EU28 averages. The paper concludes by proving that unless the V4 countries will invest a lot more into education, life-long learning and reskilling their population they will lose economic vitality, the ability of becoming a successful economic player in the changing world economy.
Consequently their living standards will also deteriorate.
What do we mean by the fourth industrial revolution?
Industrial revolutions bring landslide changes in how production is organized and performed.
The first industrial revolution (end of the 18th century) introduced water and steam power to speed up production operations. During the second one (start of the 20th century) electric energy was utilized for mass production processes improving productivity considerably. Then the third industrial revolution (the beginning of the 70-ies) started automating production with the help of electronic and information technology. And now we are in the process of the fourth industrial revolution, which will bring digitalization, automation, artificial intelligence, machine learning and many more sophisticated technologies into our business and everyday life. The great question is: how to adjust to, how to take advantage of these disruptive technologies? The key challenge will probably be how to offer efficient and timely education, training, retraining and reskilling to the largest possible segment of society. Without such a mass investment into the
59,1
70,1
46,6
71,9
56,6
0 10 20 30 40 50 60 70 80
Czech Republic Hungary Poland Slovakia Visegrad Group
economic and social troubles. Especially if all the warning forecasts will turn out to be correct.
One of the most pessimistic forecasts comes from Guthrie-Jensen Consultants (2018) who believes that by 2020 about 5 million jobs will be replaced by automated machines. Also disruptive changes will create new markets and new jobs that didn’t exist before. The authors emphasize that to be prepared for the new opportunities require proper skills, capabilities and attitudes, which can be achieved by investing in intangible resources: human, psychological and organizational capabilities.
The effects of the fourth industrial revolution on demand for new knowledge and skills Different studies suggest that the highest probability of easy automation characterizes those sectors of the economy which mainly employ low-or medium skilled employees performing manual and routine tasks. Therefore OECD (2018) predicts that the highest probability of job losses can be expected in manufacturing, agriculture, mining and quarrying. It is less likely that jobs requiring creativity, human and social skills, like healthcare, education, legal, accounting, computer and information services or management consultancy will be automated soon.
However these types of jobs will also be undergone changes that will require a new set of skills and capabilities soon, and of course also from the workforce of tomorrow.
Different studies try to describe those typical soft skills which will be in high demand. One of the institutions heavily involved in research related to the effects of the fourth industrial revolution is the World Economic Forum (WEF 2016) has listed the 10 most important skills which will be needed to thrive in the fourth industrial revolution. These are the following:
- complex problem solving - critical thinking
- creativity
- people management - coordinating with others - emotional intelligence
- judgement and decision making - service orientation
- negotiation
- cognitive flexibility.
But of course the question is: are the present educational systems prepared to offer these soft skills? Are educators themselves properly trained and empowered to create innovative learning experiences for students and adults? Are they able and willing to follow Alfred Einstein’s (1879-1955) philosophy who once said: I never teach my pupils, I only provide the conditions in which they can learn. An interesting study by the Economist Intelligence Unit (EIU 2018) stresses the different problems in the various educational fields. It argues: in an age when technological changes have strong, sometime even fundamental impact on how individuals work, life-long learning for everyone may be a crucial educational form.
EIU also calls attention to the importance of proper basic education, including early education programs, 21st century skills programs, modern technology and data literacy education programs.
Improving the quality of vocational and on-the-job training is also of great importance. It has to enable employees, especially workers, younger and older ones as well, to participate in reskilling programs. Becker (1964), a representative of human capital theory points out that on- the-job training is an important future oriented investment into human resources. However
companies may be hesitant to spend money on workers who are employed in jobs that will be automated in the near future. Therefore the governments should also be responsible for offering training to these people, and also to those who need upgrading of skills in any segment of society. Needs for learning and unlearning will also be present at the same time.
Alvin Toffler (1970) writer and futurist summarized the essence of learning requirements quite early in the following way: the illiterate of the 21st century will not be those who cannot read and write, but those who cannot learn, unlearn and relearn.
Therefore the most important task of business along with government should be to invest in human resources. Different studies direct attention to the same issues: success or failure of economies and societies will be determined in the age of the fourth industrial revolution based on how much they will invest in human knowledge, skills and innovation. Earlier competitiveness studies mostly concentrated on measurable economic and financial indicators.
Nowadays countries have to change their approach to measuring competitiveness. Soft factors, investments into intangibles will determine their success or failure in the future. Haskel and Weslake (2018) explain this the following way: “Economy does not run on tangible investment alone. Intangible investment has become increasingly important. It is related to the changing balance of services and manufacturing in the economy, developments in IT, and management technologies (pages 3, 35). The typical investments into intangibles are related to investing into education, training, lifelong learning, R&D and innovation. In the following points we measure the achievements of the V4 countries in terms of how much they invest into the most important intangibles compared to 5 developed countries and the EU28 average.
The achievements of the V4 countries in investing into intangibles.
Characteristics of industrial structures
Figure 1 illustrates a very important weakness of the V4 economies, which is the large share of value added created by affiliates of foreign manufacturing enterprises which perform mostly assembly line operations in the V4 countries. The highest share can be found in Slovakia and Hungary. These foreign affiliate assembly line operations are the most easily automatable ones.
Within the V4 countries Poland is in the best position in this aspect.
However the average value of the indicator is not too good for the V4 countries: the share of foreign manufacturing affiliates is rather high, 56.6 percentage in value added. This establishes vulnerability for the group, unless the countries are ready to invest in those people who will lose their jobs, and also into the young generations, as well as into the entire population in order to make them ready for the new jobs, new opportunities. Now let us examine the additional characteristics of educational achievements in our sample of countries.
Population by educational attainments in the V4 countries compared to those of the other selected countries
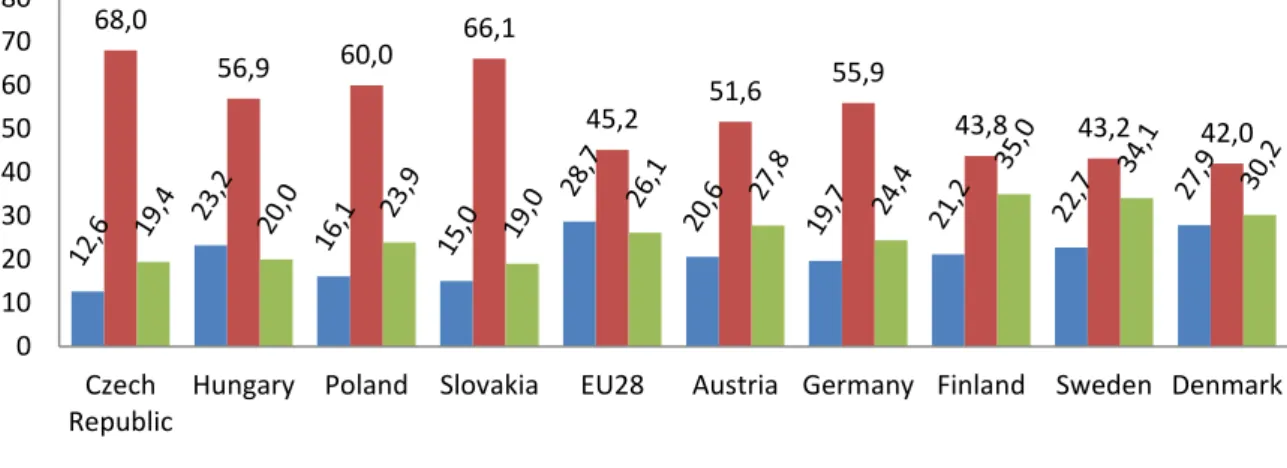
Figure 2 shows the proportion of population by educational attainment level in the V4 countries and 5 developed EU countries in 2016 in the age range of 15-74 years.
Figure 2. Population by educational attainment level (2016, 15-74 years, %) Source: Based on Eurostat data7
Within the V4 countries the Czech Republic has the lowest proportion of the population with low level education, which is at the same time the lowest level for all the countries analyzed, and Poland has the highest proportion for tertiary education. But there are much higher values for the population with tertiary education in the Scandinavian countries. This may indicate the high proportion of service sector in the Scandinavian economy. As far as the V4 countries’
profile is concerned the low proportion of population with tertiary education can be a serious disadvantage. For moving towards knowledge-based economies they should do more to increase this proportion. It is also interesting that the German and Austrian values are also quite low. However these countries take advantage of brain drain from the V4 and Southern European countries.
As we argued before the fourth industrial revolution requires highly trained workforce. Among them graduates in science, mathematics, engineering and computing (SMEC) are in especially high demand. Figure 3 shows the proportion of SMEC graduates aged 20-29 in year 2015.
Figure 3. Graduates in tertiary education in science, mathematics, engineering, computing (SMEC) (per 1000 of population aged 20-29, 2015)
Source: Based on Eurostat data
7Low level education: Less than primary, primary and lower secondary education Medium level education: Upper secondary education
High level education: Tertiary education 68,0
56,9 60,0 66,1
45,2 51,6 55,9
43,8 43,2 42,0
0 10 20 30 40 50 60 70 80
Czech Republic
Hungary Poland Slovakia EU28 Austria Germany Finland Sweden Denmark
Low level education Medium level education High level education
17,2 12,2
21,4
16,6 19,1
22,1 20,5 23,7
15,3 23,3
0 5 10 15 20 25
Among the V4 countries Hungary and Slovakia are in the worst position, and Poland has the best position. However for this indicator the V4 countries do not lag too far behind the analyzed developed countries. If we consider another indicator, people who have a tertiary education and work in a science and technology occupation as a percentage of the total labor force, than we experience big differences again. (Figure 4.) The Slovak data is the worst, followed by the Czech and Hungarian.
Figure 4. People with tertiary education and working in science and technology occupation as a percentage of total labor force (15-74, 2016, %)
Source: Based on Eurostat data
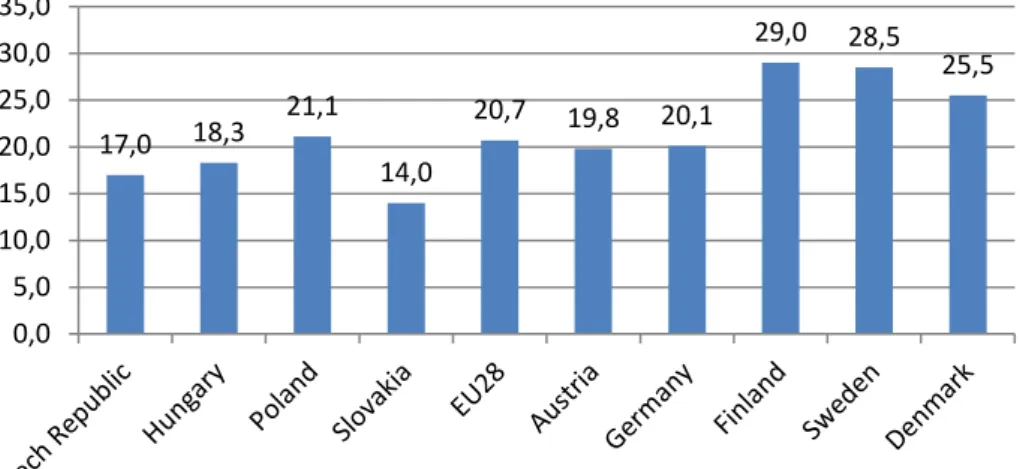
But the Polish number is higher than the EU average and that of the German. But the Scandinavian countries are again much ahead of the other countries. These data suggest that the economic structure of the V4 countries is basically dominated by manufacturing, mostly assembly line jobs, which are at the highest risk of automation. At the other end we see the knowledge-based, service-oriented Scandinavian countries, where due to the nature of jobs wages are also much higher than in the V4 countries, so people may be able to spend more on their own education. And how involved governments are in preparing human resources and the economy for the future? Let us see a few crucial numbers!
Investment into intangibles: education and R&D in the V4 countries in international comparison
Investing into intangibles can help upgrading the knowledge and skills of human resources. In the age of the fourth industrial revolution multidimensional skills are needed, which should be offered within the entire educational system including life-long learning. Pre-primary and primary education is exceptionally important in order to give a good start to children.
Developing human and social skills start already at that level. Spending enough money on early age education is therefore crucial.
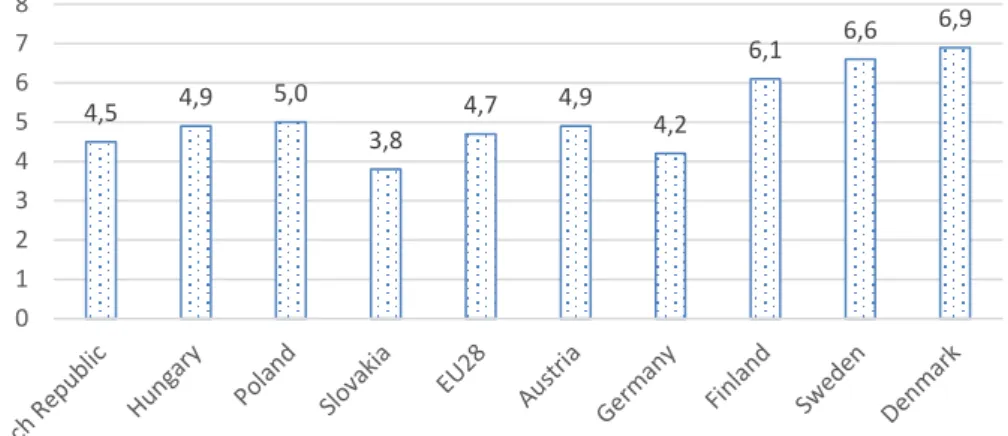
The Scandinavian educational system is famous of offering a balanced combination of human and social skills and also analytical, as well as cognitive ones. Again, based on Eurostat data Scandinavian countries spend the most on early age education as a percentage of GDP (Sweden 4.2, Denmark 3.1 percentage), while Eastern European spend a lot less. (Czech Republic 1.0, Hungary 1.3, Poland 1.8, Slovakia 1.4 percentage). Figure 5 illustrates the total government expenditure on education. The V4 countries spend roughly as much as the EU average. But
17,0 18,3 21,1 14,0
20,7 19,8 20,1
29,0 28,5 25,5
0,0 5,0 10,0 15,0 20,0 25,0 30,0 35,0
again Scandinavians lead. Interestingly enough Germany and Austria are behind the Scandinavians.
Figure 5. Total general government expenditure on education (% of GDP, 2016) Source: Based on Eurostat data
Looking at the educational attainments examined in the previous point this amount will just not be enough to lower the proportion of people with low level of educational attainment, and in general to build competitive human resources in the V4 countries. Also if we consider those people who will be freed up from the automated sectors and therefore need further education and retraining obviously a lot more spending on education will be needed. But how are the V4 countries doing in terms of life-long learning results? Figure 6 demonstrates the shocking figures.
Figure 6. Adult participation (Lifelong learning) as a percentage of population aged 25 to 64 (2016)
Source: Based on Eurostat data
It looks like the V4 countries, where automation will probably displace a great proportion of the workers are not yet aware of the potential danger. Slovakia, the country highlighted by OECD as the most threatened one spends the least, and those countries which are in the safest position spend the most. This is a serious warning sign we have to direct attention to. Again German and Austrian positions are also weak. The German number is for example lower than the EU average. One reason can be the well-developed apprenticeship system, although it has
4,5 4,9 5,0
3,8
4,7 4,9
4,2
6,1 6,6 6,9
0 1 2 3 4 5 6 7 8
8,8 6,3
3,7 2,9
10,8 14,9
8,5
26,4
29,6 27,7
0 5 10 15 20 25 30 35
been recently heavily criticized for not being any longer flexible enough for developing labor force needed in the future.
Finally in order to change and modernize economic structures, to be able to increase the share of knowledge and innovation based activities countries have to invest into another intangible resource: research and development.
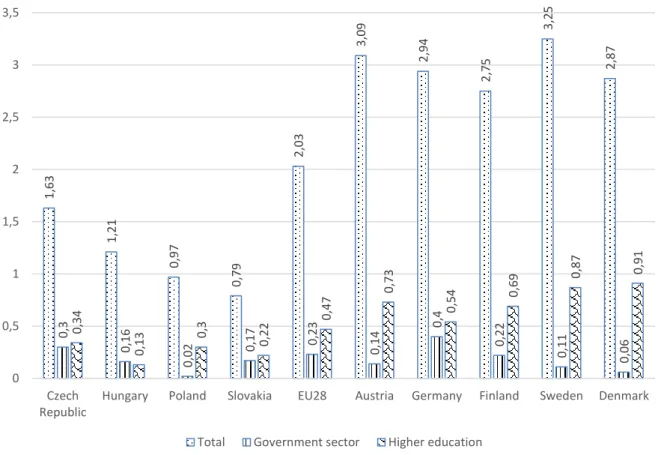
Figure 7 shows the R&D expenditure as a percentage of GDP (business and government combined), and separately for government and higher education.
Figure 7. R&D expenditure as percentage of GDP by sectors (%, 2016) Source: Based on Eurostat data
The business sector is not highlighted, as we focus on how well prepared governments are to handle the necessary changes triggered by the rapid technological changes.
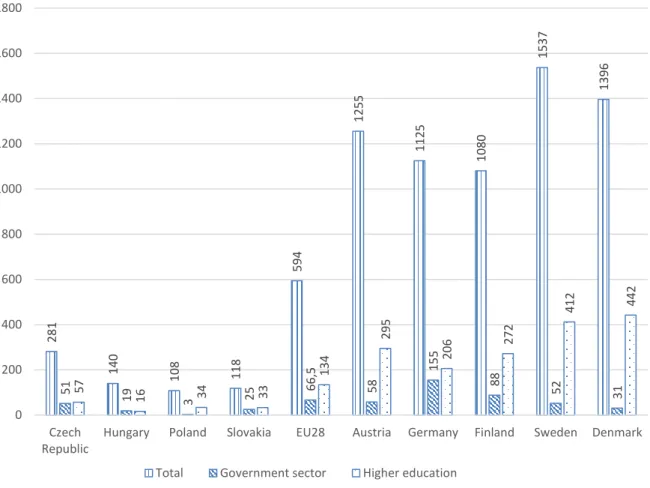
Then figure 8 demonstrates another important indicator: how much is spent, in euro, per inhabitant in the selected countries on R&D in total, and especially in the government and the higher education sector.
1,63 1,21 0,97 0,79 2,03 3,09 2,94 2,75 3,25 2,87
0,3 0,16 0,02 0,17 0,23 0,14 0,4 0,22 0,11 0,06
0,34 0,13 0,3 0,22 0,47 0,73 0,54 0,69 0,87 0,91
0 0,5 1 1,5 2 2,5 3 3,5
Czech Republic
Hungary Poland Slovakia EU28 Austria Germany Finland Sweden Denmark Total Government sector Higher education
Figure 8. R&D expenditure (GERD) per inhabitant by sectors (Euro, 2016) Source: Based on Eurostat data
Both figures demonstrate that the V4 countries spend less on R&D both as a percentage of GDP, and per inhabitant than the more developed countries and in all highlighted sectors. These facts may be really worrying if we are considering the question whether these low level investments into intangibles today will be enough for future development based on knowledge and innovation in the V4 countries.
Finally Figure 9 compares the situation of the V4 countries with that of the selected 5 developed countries along the five most important indicators expressing readiness for taking advantage of the fourth industrial revolution. The value of the different indicators is calculated and demonstrated on Figure 9 as a percentage of the EU28 average in order for illustrating differences. The problems reflected on Figure 9 are evident: the V4 countries lag behind quite considerably in investing into knowledge-related intangibles in spite of the fact that they are less well equipped today with the necessary human resources needed in the future, and also their economic structure is not very modern either, therefore it should be transformed into a more innovation- and knowledge-based one.
281 140 108 118 594 1255 1125 1080 1537 1396
51 19 3 25 66,5 58 155 88 52 3157 16 34 33 134 295 206 272 412 442
0 200 400 600 800 1000 1200 1400 1600 1800
Czech Republic
Hungary Poland Slovakia EU28 Austria Germany Finland Sweden Denmark Total Government sector Higher education
Figure 9. Key intangible indicators in comparison measured as a percentage of EU28 average
Source: Based on Eurostat data
Conclusion
Disruptive changes requires timely, game changing, sometimes revolutionary solutions. The V4 countries have been famous of their highly trained and disciplined human resources for a long time. However recently they seem to have been slow with developing their human resources, which could put them at a serious disadvantage compared to those countries the V4 countries had planned to catch up with when joining the EU in 2004. Poland’s achievements in some areas are better than that of the rest in the V4 group, however compared to those of the developed countries it is also too little. Human resources, R&D and innovation are and will be the key to competitiveness and social well-being. Therefore V4 countries should reconsider their human resources and innovation strategies in order to guarantee that they will not be left behind in the today’s revolutionary technological development processes. Of course the indicators covered in this article are not sufficient to draw an absolute convincing picture. We could include further indicators and search for correlation among them. Cause and effect analysis could also further clarify the situation.
But the selected indicators are important enough to trigger further debates and investigations into the methods and policies of how the V4 countries could better utilize and further develop their human and creative talents in order to speed up their economic and social development in
References:
1. Becker, G.S. (1964): Human Capital Theory. Columbia. New York
2. Guthire-Jensen Consultants (2018): Skills of the future.
Https://guthriejensen.com/blog/skills-future-2020-infographic
3. HCSO: Hungarian Central Statistical Office in cooperation with statistical offices of Czech Republic, Poland and Slovakia (2018): Main Indicators of the Visegrad Group Countries. Budapest, Hungary
4. Haskel J., Westlake S. (2018) : Capitalism without capital. The rise of the intangible economy. Princeton, Oxford. Princeton University Press.
5. Nedelkoska, L. , Quintini, G. (2018): Automation, skills use and training. OECD Social, Employement and Migration Working Papers, No. 202, OECD Publishing, Paris. Http://dx.doi.org/10.1787/2e2f4eea-en
6. The Economist Intelligence Unit (2018): The Automation Readiness Index. Who is ready for the coming wave of automation? London. UK.
Www.automationreadiness.eiu.com/static/download/PDP.pdf 7. Toffler, A. (1970): Future Shock. Random House
8. World Economic Forum (2016): The 10 skills you need the thrive in the Fourth
Industrial Revolution. Davos, Switzerland.
Https://www.weforum.org/agenda/2016/01/the-10-skills-you-need-to-thrive-in-the- fourth-industrial-revolution)
Appendix:
Database of the figures.
Table 1. Share of manufacturing in value added (2015)
Country %
Czech Republic 26,8
Hungary 24,4
Poland 19,9
Slovakia 21,9
EU28 16,1
Austria 18,6
Germany 23,1
Finland 17,2
Sweden 15,5
Denmark 14,3
Table 2. Share of foreign manufacturing affiliates in value added (at factor cost, 2015)
Country %
Czech Republic 59,1
Hungary 70,1
Poland 46,6
Slovakia 71,9
Visegrad Group 56,6
Table 3. Population by educational attainment level (2016, 15-74 years, %)
Country Low level
education Medium level
education High level education
Czech Republic 12,6 68,0 19,4
Hungary 23,2 56,9 20,0
Poland 16,1 60,0 23,9
Slovakia 15,0 66,1 19,0
EU28 28,7 45,2 26,1
Austria 20,6 51,6 27,8
Germany 19,7 55,9 24,4
Finland 21,2 43,8 35,0
Sweden 22,7 43,2 34,1
Denmark 27,9 42,0 30,2
Table 4. Graduates in tertiary education in science, mathematics, engineering, computing (SMEC) (per 1000 of population aged 20-29, 2015)
Country %
Czech Republic 17,2
Hungary 12,2
Poland 21,4
Slovakia 16,6
EU28 19,1
Austria 22,1
Germany 20,5
Finland 23,7
Sweden 15,3
Denmark 23,3
Table 5. People with tertiary education and working in science and technology occupation as a percentage of total labor force (15-74, 2016, %)
Country %
Czech Republic 17,0
Hungary 18,3
Poland 21,1
Slovakia 14,0
EU28 20,7
Austria 19,8
Germany 20,1
Finland 29,0
Sweden 28,5
Denmark 25,5
Table 6. Total general government expenditure on education (% of GDP, 2016)
Country %
Czech Republic 4,5
Hungary 4,9
Poland 5,0
Slovakia 3,8
EU28 4,7
Austria 4,9
Germany 4,2
Finland 6,1
Sweden 6,6
Denmark 6,9
Table 7. Adult participation (Lifelong learning) as a percentage of population aged 25 to 64 (2016)
Country %
Czech Republic 8,8
Hungary 6,3
Poland 3,7
Slovakia 2,9
EU28 10,8
Austria 14,9
Germany 8,5
Finland 26,4
Sweden 29,6
Denmark 27,7
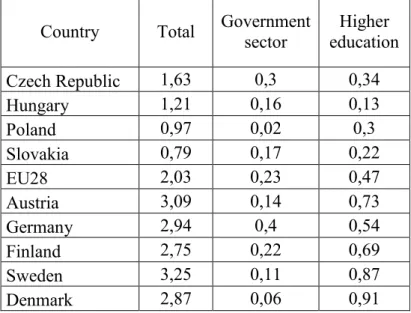
Table 8. R&D expenditure as percentage of GDP by sectors (%, 2016) Country Total Government
sector
Higher education
Czech Republic 1,63 0,3 0,34
Hungary 1,21 0,16 0,13
Poland 0,97 0,02 0,3
Slovakia 0,79 0,17 0,22
EU28 2,03 0,23 0,47
Austria 3,09 0,14 0,73
Germany 2,94 0,4 0,54
Finland 2,75 0,22 0,69
Sweden 3,25 0,11 0,87
Denmark 2,87 0,06 0,91
Table 9. R&D expenditure (GERD) per inhabitant by sectors (Euro, 2016) Country Total Government
sector
Higher education
Czech Republic 281 51 57
Hungary 140 19 16
Poland 108 3 34
Slovakia 118 25 33
EU28 594 66,5 134
Austria 1255 58 295
Germany 1125 155 206
Finland 1080 88 272
Sweden 1537 52 412
Denmark 1396 31 442
Table 10. Key intangible indicators in comparison: basic data Countries R&D
expenditure as % of
GDP (Total)
R&D expenditure
in higher education
Government expenditure
on education as
% of GDP
LLL participation
as % of population
(25-64)
SMEC graduates per 100 of population
Czech Republic 1,63 0,57 4,5 8,8 1,72
Poland 0,97 0,34 5,0 3,7 2,14
Hungary 1,21 0,16 4,9 6,3 1,22
Slovakia 0,79 0,33 3,8 2,9 1,66
EU28 2,03 1,34 4,7 10,8 1,91
Austria 3,09 2,95 4,9 14,9 2,21
Germany 2,94 2,06 4,2 8,5 2,05
Finland 2,75 2,72 6,1 26,4 2,37
Sweden 3,25 4,12 6,6 29,6 1,53
Denmark 2,87 4,42 6,9 27,7 2,33
