STUDIES ON MODULATED ELECTROHYPERTHERMIA INDUCED TUMOR CELL DEATH IN A COLORECTAL
CARCINOMA MODEL
PhD thesis
Nóra Meggyesházi M.D.
Pathological Sciences Doctoral School Semmelweis University
Supervisor: Dr. Tibor Krenács Ph.D.
Official reviewers:
Dr. Tibor Glasz Ph.D.
Dr. Gyula Péter Szigeti Ph.D.
Head of the Final Examination Committee:
Dr. Péter Sótonyi Member of MTA.
Members of the Final Examination Committee:
Dr. Gábor Lotz Ph.D.
Dr. Árpád Csurgay Member of MTA
Budapest, 2015
1
1. TABLE OF CONTENT
1. TABLE OF CONTENT ... 1
2. ABBREVIATIONS ... 4
3. INTRODUCTION ... 7
3.1. Characteristics of hyperthermia in oncology ... 7
3.1.1. Forms of hyperthermia ... 7
3.1.2. Theoretical background of local hyperthermia ... 8
3.1.3. Pre-clinical observations and results ... 9
3.1.4. Clinical observations ... 10
3.2. Principles of modulated electrohyperthermia ... 11
3.2.1. Bioelectrodynamic description of tissues ... 12
3.2.1.1. Conditions and variables ... 12
3.2.1.2. Bioelectrodynamic characteristics of malignancies ... 13
3.2.2. Biophysical background of modulated electrohyperthermia ... 14
3.2.3. Clinical observations using modulated electrohyperthermia... 16
3.3. Theoretical background of the observed biological impact of hyperthermia ... 16
3.3.1. Characteristics of cell death forms ... 17
3.3.2. Characteristics of immunogenic cell death forms ... 20
4. OBJECTIVES ... 24
5. MATERIALS AND METHODS ... 25
5.1. Tumor model ... 25
5.1.1. Cell line ... 25
5.1.2. Animal model ... 25
2
5.2. Treatment conditions and sampling ... 26
5.3. Histomorphological analysis ... 27
5.4. Molecular analysis ... 29
5.4.1. mRNA chip analysis ... 29
5.4.1.1. Total RNA isolation and RNA quality control ... 29
5.4.1.2. Microarray analysis ... 29
5.4.2. Apoptosis protein array ... 30
5.4.3. Immunohistochemistry and immunofluorescence ... 30
5.4.4. Terminal deoxynucleotidyl transferase nick end labeling (TUNEL) assay ... 33
5.4.5. Western blot ... 33
6. RESULTS ... 35
6.1. Histomorphological analysis of treatment related tumor cell death ... 35
6.2. Detection of treatment related DNA fragmentation... 36
6.3. Detection of treatment related differential mRNA expression ... 37
6.4. Detection of apoptosis related differential protein expression ... 38
6.5. Detection of treatment related differential protein expression in situ... 41
6.5.1. Programmed cell death related proteins ... 41
6.5.2. Stress related proteins ... 47
6.5.3. Identification of immune cells ... 52
7. DISCUSSION ... 54
8. CONCLUSION – NEW OBSERVATIONS ... 62
9. SUMMARY ... 63
10. ÖSSZEFOGLALÁS ... 64
11. BIBLIOGRAPHY ... 65
3
12. BIBLIOGRAPHY OF THE CANDIDATE’S PUBLICATIONS ... 77 13. ACKNOWLEDGEMENTS ... 79
4
2. ABBREVIATIONS
AEC aminoethylcarbazole
AIF apoptosis inducing factor
Apaf 1 apoptotic protease activating factor 1 APC antigen presenting cell
AsPC-1 human pancreatic cell line ATP adenosine triphosphate Bag3 Bcl-2-associated athanogene 3 Bak Bcl-2 homologous antagonist/killer Bax Bcl-2 associated X protein
Bcl-2 B-cell lymphoma 2
BID BH3 interacting-domain death agonist BSA bovine serum albumin
CD cluster of differentiation
CHPP continous hyperthermic peritoneal perfusion
CRT calreticulin
DC dendritic cell
DAB 3,3’ diaminobenzidine
DAMP damage associated molecular pattern DAPI 4’,6 diamidino-2-phenylindole dATP deoxyadenosine triphosphate
DMEM Dulbecco’s modified Eagle’s minimal essential medium DNA deoxyribonucleic acid
DNAJB DnaJ (Heat shock protein 40) homolog, subfamily B DIABLO direct IAP-binding protein with low pI
dUTP 2'-deoxyuridine 5'-triphosphate ECL electrochemiluminescence EDTA ethylenediaminetetraacetic acid
ER endoplasmic reticulum
FADD Fas-associated protein with death domain FASL Fas ligand
5
FCS fetal calf serum
FFPE formalin-fixed paraffin-embedded
FOV field of views
HIPEC hyperthermic intraperitoneal chemotherapy HMGB1 high mobility group box 1
HRP horseradish peroxidase HSF heat shock factor Hsp70 heat shock protein 70 Hsp90 heat shock protein 90 HSPA heat shock protein 70 A
HT29 human colorectal adenocarcinoma cell line HTRA2 high temperature requirement protein A2 H&E hematoxylin and eosin
IAP inhibitor of apoptosis ICD immunogenic cell death
Ig immunogloubulin
log2FC binary logarithm of fold change mEHT modulated electrohyperthermia MHC major histocompatibility complex
MIAME Minimum information about a microarray experiment MIAPaCa-2 human pancreatic cell line
min/h minute per hour
MLS mitochondrial localization signal
MMP mitochondrial membrane permebilization
MPO myeloperoxidase
mRNA messenger ribonucleic acid
NF-κB nuclear factor kappa-light-chain-enhancer of activated B cells
NK natural killer
PS phosphatidilserin
PVDF polyvinylidene difluoride
RAGE receptor advanced glycation endproducts
RIN RNA integrity number
6
RIP1 receptor-interacting serine/threonine-protein kinase 1 RIP3 receptor-interacting serine/threonine-protein kinase 3 rMA relative mask area
RNA ribonucleic acid
ROS reactive oxygen species
SAM significance analysis of microarrays SAR specific absorption rate
SAS human tongue squamous cell carcinoma cell line SDS-PAGE sodium dodecylsulfate polyacrylamide gel tBID truncate BH3 interacting-domain death agonist TBS Tris-buffered saline
TDE tumor destruction efficiency TDR tumor destruction ratio
TdT terminal deoxynucleotidyl transferase TER thermal enhancement ratio
TIM3 T-cell immunoglobulin domain and mucin domain 3 TLR2/4 Toll like receptor 2/4
TMA tissue microarray TNFα tumor necrosis factor α
TNFα-R1 tumor necrosis factor α receptor 1 TRAIL TNF-related apoptosis-inducing ligand
TRAIL-R1 TNF-related apoptosis-inducing ligand receptor 1 TRAIL-R2 TNF-related apoptosis-inducing ligand receptor 2
TUNEL terminal deoxynucleotidyl transferase dUTP nick end labeling WBH whole body hyperthermia
WGA wheat germ agglutinin
εk complex permittivity
σk complex conductivity
T temperature difference
t time difference
Eloc average local electric field ρ density of a material
7
3. INTRODUCTION
3.1. Characteristics of hyperthermia in oncology
The term hyperthermia in oncology refers to techniques of heat application administered to tissues as an adjunct to conventional strategies of cancer treatment such as chemo- or radiotherapy. (Hildebrandt et al. 2002). The aim of hyperthermia treatment is, like any oncological therapies, to completely and selectively destroy the malignant tissue (Szasz et al. 2010). Hyperthermia is mostly identified with a range of temperature of the target between 40-48°C maintained at a treated site for a period of one hour or more each time (Chicheł et al. 2007). From this loose definition it becomes clear that this is a rather heterogeneous group of treatments with diverse efficiency and outcome depending on the source of heat generation and the histogenesis, differentiation, site/microenvironment and the defective regulatory pathways of the treated tumors.
3.1.1. Forms of hyperthermia
The main forms of hyperthermia include whole body hyperthermia, hyperthermic perfusion techniques and local/regional hyperthermia (Hildebrandt et al. 2002).
Whole body hyperthermia (WBH) is used for patients with metastatic disease usually in combination with chemotherapy. It can be performed by thermal chambers, hot water blankets or infrared radiators. In extreme WBH the patient core temperature is heated up to 42°C for 60 minutes under general anesthesia or deep sedation, while in moderate WBH the patient core temperature is heated up between 39.5-41°C for 3-4 hours (Chicheł et al.
2007). A few phase II studies were carried out using WBH in combination with chemotherapy. WBH was applied with oxaliplatin, leucovorin and 5-fluorouracil treating patients with metastatic rectal tumors with a 20% response rate (Hegewisch-Becker et al.
2002). Recurrent ovarian cancer and recurrent and metastatic ovarian cancer patients were treated with WBH in combination with carboplatin with a response rate of 45% (Atmaca et al. 2009) and 33% (Richel et al. 2004) respectively. The phase II study of metastatic soft tissue sarcoma patients treated with WBH in combination with fosfamide, carboplatin and etoposide revealed a 28.4% response rate (Westermann et al. 2003).
8
Hyperthermic perfusion techniques include hyperthermic isolated limb perfusion and hyperthermic intraperitoneal perfusion with or without administering a chemotherapy agent (hyperthermic intraperitoneal chemotherapy- HIPEC, continuous hyperthermic peritoneal perfusion- CHPP) (Wust et al. 2002; Chicheł et al. 2007). HIPEC proved to be beneficial for patients with peritoneal cacinomatosis from appendicial cancer, colorectal cancer, ovarium cancer and peritoneal mesothelioma (Chua et al. 2009). The median survival was found to be between 26 to 56 months in ovarian cancer with peritoneal carcinomatosis when cytoreductive surgery was used with HIPEC (Chua et al. 2009). In colorectal cancer with peritoneal carcinomatosis the median disease specific survival was found to be 22.2 months when cytoreductive surgery was applied with HIPEC while it was 12.6 months in the control arm (Aoyagi et al. 2014). Hyperthermic isolated limb perfusion is a technique bypassing a large supplying artery and a vein of a limb to deliver heat to drained blood in an extra corporal way (Chicheł et al. 2007). This method has fewer side effects than WBH, mostly administered in combination of chemotherapy in melanomas or soft tissue sarcomas (Chicheł et al. 2007). Hyperthermic isolated limb perfusion may be used to treat malignant melanomas with an overall median response rate of 90% (Moreno-Ramirez et al. 2010) or soft tissue sarcomas with an overall response rate of 81.5% (Trabulsi et al. 2012).
Local hyperthermia is applied to tumors of relatively small size, while regional hyperthermia is used to heat up a body region involving the tumor. For such heating infrared radiation, microwaves, radio waves and ultrasound can be used (Szasz et al. 2002;
Chicheł et al. 2007). The following sections will briefly summarize what is known about the biophysical background, major characteristics and utilization for cancer treatment of local hyperthermia.
3.1.2. Theoretical background of local hyperthermia
Oncological hyperthermia uses heat energy to destroy the malignant cells. The absorbed energy is converted to heat, which further leads to increment on temperature. Therefore, one has to distinguish heat (as the absorbed energy) and the resulted elevation of temperature as a consequence of energy absorption. Local/regional hyperthermia works by energy/heat absorption in the targeted tissue volume. Although, blood flow can reduce the
9
efficiency of energy absorption by cooling the heated volume incorporating the tumor tissue (Szasz et al. 2010).
3.1.3. Pre-clinical observations and results
To provoke the cytotoxic effect of hyperthermia either in vitro or in vivo, usually a water bath is applied for generating heat within a therapeutic range of temperature and duration.
For example human head and neck squamous cell carcinoma cell line xenografted to the hind leg of BALB/cA Jcl-nu mice, (Tamamoto et al. 2003) or HT29 human colorectal carcinoma cell line xenografted to NCI Nu/nu mice (Sun et al. 2008) or HT29 xenografted to BALB/C nu/nu mice were tested in this way (Liang et al. 2007).
Hyperthermia can inhibit DNA, RNA and protein synthesis during the treatment, but RNA and protein synthesis rapidly recover after the treatment (Hildebrandt et al. 2002). The DNA synthesis is inhibited due to denaturation of proteins involved in DNA repair such as DNA-polymerase α and β and Rad51 (Hildebrandt et al. 2002; Genet et al. 2013). Heat can change the fluidity of the cell membrane resulting in the softening or melting of the lipid bilayer. This leads to the accumulation of cholesterol and ceramide in the lipid layer resulting in the rearrangement of the lipid rafts with concomitant changes in the protein content such as phospholipase A2 and phospholipase C causing either calcium release from the ER or the transcriptional activation of heat shock proteins (Hsp) (Csoboz et al. 2013).
The heat stress related to hyperthermia on the other hand may induce heat shock protein (Hsp) synthesis through protein aggregation and denaturation followed by heat shock factor (HSF) binding to the promoter regions of different Hsp’s (Hildebrandt et al. 2002). The elevated intracellular Hsp concentration can be cytoprotective (Horvath et al. 2010), may translocate to the cytoplasm membrane, where it either protects the cell (Horvath et al.
2010) or act as an immunostimulant (Nishida et al. 1997; Hildebrandt et al. 2002).
Hyperthermia can lead to necrosis and programmed cell death in a tremperature dependent manner in a murine mastocytoma cell line (Harmon et al. 1990) and in several hematological tumor cell lines (Harmon et al. 1990; Baxter et al. 1992; Gabai et al. 1995;
Yonezawa et al. 1996). However, hyperthermia in vivo is usually used for targeting solid tumors. Unfortunately the anti-tumor efficiency of hyperthermia can vary depending on the
10
models used. Hyperthermia for 1h at 43.5°C induced DNA fragmentation 6h post-treatment in Dunn osteosarcoma cell line (Rong et al. 2000) and for 44 min on 44°C in human tongue squamous cell carcinoma cell line (SAS) (Kajihara et al. 2008). On the other hand hyperthermia was not found to be effective either at 42°C in colorectal cancer cell line (HT29) (Shchepotin et al. 1997), or at 43°C when used for 1h in pancreatic cancer cell lines (AsPC-1, MIAPaCa-2) (Adachi et al. 2009). In vivo however, instead of water bath infrared radiation, microwave or radiofrequency is applied for generating heat.
Beside the cellular and cytotoxic effects, hyperthermia can regulate blood flow by elevating blood flow/perfusion up to ~42oC and reducing it above 42°C. This can be exploited in combination with chemotherapy for elevating the local concentration of chemotherapeutic agents by moderate hyperthermia (Hildebrandt et al. 2002).
3.1.4. Clinical observations
Hyperthermia is usually applied in combination with radiotherapy, chemotherapy or both.
As mentioned above hyperthermia below 42°C can increase the blood flow, which is reduced above this temperature. In clinical conditions local/regional hyperthermia in most of the cases does not exceed 42°C, therefore, this is the basis of combinational therapy (Hildebrandt et al. 2002). When hyperthermia and radiation therapy act synergistically the term “thermal radiosenzitization” is used, which is most prominent in S-phase proliferating cell fractions that are usually resistant to radiotherapy (Hildebrandt et al. 2002). To define the benefit of the combinational therapy thermal enhancement ratio (TER, the quotient of survival fraction of cells treated with radiation alone or with radiation and hyperthermia in combination) is used (Overgaard 1984; Hildebrandt et al. 2002). Hypoxic cells, cells with impaired nutrient supply and/or acidic pH, react sensitively to combined therapy of heat and radiation (Dewey et al. 1977; Dewey 1994). Synchronous application of the combined therapy would be the best routine; however, technical difficulties still need to be overcome for this to be carried out. Therefore, in clinical practice heat and radiation are applied after one and other within a short period of time. Some prefer applying radiation first followed by heat within 2-4 hours, while others apply heat prior to irradiation. So far, neither of these strategies has been tested by randomized clinical studies (Hildebrandt et al. 2002).
11
The term “thermal chemosenzitization” is used in analogy with thermal radiosensitization, for indicating synergy between hyperthermia and chemo- or radiotherapy. The applicability of chemotherapeutic agents in combination with hyperthermia depends on pharmacokinetic properties of the drug. For example drugs which are metabolized in the liver should be applied a few hours before hyperthermia (e.g.: cyclophosphamide, ifosfamide). One would expect that changes in tumor blood supply will affect the distribution of the drug in the malignant tissue. In reality, this interaction is highly complex and depends much more on environmental factors such as fluid balance and pH in addition to blood supply, than radiation and heat (Hildebrandt et al. 2002).
So far a few randomized trials have been carried out i.e. where hyperthermia was combined with radiotherapy of head and neck tumors and breast cancers with a complete response rate of 32% with hyperthermia and 30% without hyperthermia, (Perez et al. 1991;
Hildebrandt et al. 2002). Hyperthermia was used together with chemotherapy of soft tissue sarcomas with a response rate of 28.8% in the combination group and 12.7% in the chemotherapy group (Issels et al. 2010). A phase II study was performed on locally advanced rectal tumors (T4) with an 83% disease free survival in the 24.9 months median follow up time. (Barsukov et al. 2013).
3.2. Principles of modulated electrohyperthermia
Modulated electrohyperthermia (mEHT), a subtype of local/regional hyperthermia, is a non-invasive technique for targeted tumor treatment using 13.56 MHz radiofrequency with 1/f amplitude modulation. Besides the thermal effect of the electric field generated by mEHT, the electric field itself also has a tumor destructing effect (Andocs et al. 2009), however its mechanism of action has not been described yet.
12
3.2.1. Bioelectrodynamic description of tissues 3.2.1.1. Conditions and variables
Biological materials can be described by complex permittivity and complex conductivity (Mátay et al. 2000).
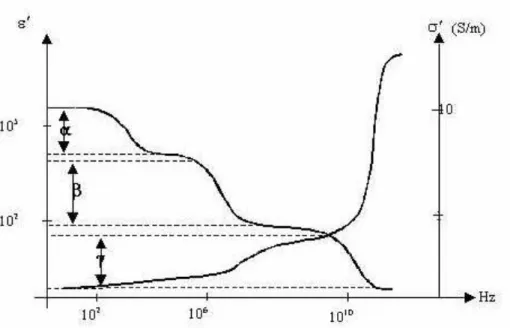
Complex permittivity (εk) is related to the dipole content of the biological material, due to the cytoplasmic and extracellular macromolecules and the membrane bound macromolecules. Tissue molecules as dipoles will rotate upon the influence of an exciting electric field. This rotation will be asynchronous with the electric field due to the inertia and the internal friction of the dipoles, this is called dielectric relaxation, which is time dependent. This relaxation results in dispersion which is highly frequency dependent (Mátay et al. 2000). The relaxation can be described by more than one relaxation constants α, β, γ and δ (Figure 1). Each domain is determined by relaxation frequencies. α dispersion ( < 1 kHz) can be explained by the cell membrane capacitance. The capacitance decreases from 20 µF/cm2 to 1 µF/cm2 with the elevation of the frequency (1 Hz - 1 kHz.) This decrement is caused by the elevated ion current through the plasma membrane. β dispersion (1 kHz-10 MHz) is related to the accumulation of the dielectric material on the cell membrane surface. γ dispersion (in the GHz range) is linked with the relaxation of the bound water (Blad et al. 1996; Mátay et al. 2000; Zou et al. 2003). A small δ dispersion exists between β and γ dispersion frequencies (not visible in Figure 1), related to bound water on the macromolecules and the charged proteins (Schwan 1957; Mátay et al. 2000).
Besides dipoles, biological materials also contain free charges which can drift upon influence by the electric field. To describe this drifting we use the term complex conductivity (σk), which is also frequency dependent (Figure 1) (Mátay et al. 2000).
The interference between radiofrequency field and the biological material can result in thermal and non-thermal effects. The thermal effect is related to the rotation of dipoles and the concomitant friction, resulted in electric displacement of the electric field (Mátay et al.
2000).
The permittivity and the conductivity are characteristic to the biological material itself and not the electric circuit (Mátay et al. 2000).
13
Figure 1. The frequency dependent relaxation of real part of permittivity and the frequency dependency of the real part of conductivity. The graph is showing the real part of complex permittivity relaxation, pointing out α, β and γ dispersion and real part of complex conductivity. ε’ is the real part of complex permittivity, σ’ is the real part of complex conductivity [S/m], while the ‘x’ axis is the frequency of the applied field.
(Scholoz et al. 2000)
As a summary in all biological materials bioelectrodynamic properties can be simplified to the description of complex permittivity (εk) (resulted from the dipole content), complex conductivity (σk) (resulted from the free charges) and to the dispersion properties (resulted from the distinct relaxation at different frequencies) (Mátay et al. 2000; Szasz et al. 2010).
3.2.1.2. Bioelectrodynamic characteristics of malignancies
As it was mentioned above the dielectric permittivity and the complex conductivity of tissues are highly frequency dependent. As it is characteristic to the material itself, different biological materials (tissues) have clearly different bioelectric properties (σ and ε). In the liver conductivity is 0.15 S/m at 10kHz, 0.16 S/m at 100kHz, 0.47 S/m at 10MHz and 0.9 S/m at 100MHz. In the lung it is 0.11 S/m at 10kHz, and 0.8 S/m at 100MHz. In the spleen it is 0.62 S/m at 100kHz, 0.84 S/m at 10MH and 1.05 S/m at 100MHz. In the kidney it is 0.24 S/m at 100kHz, 0.64 S/m at 10MHz and 0.94 S/m at 100MHz. It is obvious for
14
example that the conductivity of the spleen is higher than that of the liver or the lung. The difference of σ or ε between the different tissues on diverse frequencies is not linear.
(Foster 2000; Raoof et al. 2013)
If we compare the bioelectric properties of malignant and non-malignant tissues at the same frequency, malignant tumors show higher permittivity (ε) and conductivity (σ) than normal tissues (Pethig et al. 1984; Blad et al. 1996; Zou et al. 2003; O'Rourke et al. 2007). For example, in breast tissue in the range of 3MHz-3GHz, σ of the normal tissue increases from 1.5 to 3 mS/cm, while σ of malignant breast tumors increases from 7.5-12 mS/cm, while ε of the normal tissue remains 10 and of the malignant it increases from 50 to 400. There is a 4-fold increase in conductivity and 5 to 40 fold increase in permittivity for the benefit of tumors compared to normal tissues (Zou et al. 2003).
The elevated conductivity can be explained by the altered metabolism of the tumor cells.
This is called aerobic glucolysis or the Warburg effect. The high rate of glucose uptake and lactate production results in an increased ion concentration and concomitant increased conductivity (Szasz et al. 2010). On the other hand the altered electrical properties of malignant tissue are attributed to increased cellular water and salt content, as well as altered membrane permeability of the tumor cells (Pethig et al. 1984; Blad et al. 1996; Scholoz et al. 2000; Zou et al. 2003; O'Rourke et al. 2007).
3.2.2. Biophysical background of modulated electrohyperthermia
Modulated electrohyperthermia is a non-invasive technique using capacitive coupled (the targeted tissue is put between the condenser electrodes) 13.56 MHz radiofrequency with 1/f amplitude modulation to target tumor tissue.
This specific frequency is used because of the following reasons. The applied radiofrequency has to penetrate deeply into and across the body. The penetration depth depends on the frequency used, as well as permittivity and conductivity of the targeted tissue. Therefore, at a fixed frequency the penetration depth is higher e.g. through the same thickness of homogenous fat than of homogenous muscle (Cheung 1982). In order to ensure that capacitive coupled radiofrequency penetrates into and across the average human body thickness the frequency has to be below 25 MHz (Szasz et al. 2010). The applied
15
frequency has to be safe, not to trigger nerve excitation, preferable to be between 10 kHz and 1 GHz (Szasz et al. 2010) and has to be in the range of β dispersion (around 10 MHz) to influence cell membranes including their embedded receptors (Szasz et al. 2010). It is also practical to be in a free frequency range, which does not need shielding for avoiding interference with other electronic devices. All these criteria meet at 13.56 MHz (Szasz et al.
2010).
The selectivity of mEHT is based on the difference in σ and ε values between malignant and non-malignant tissue on 13.56 MHz. Significant difference in these values was found among breast cancer, pancreatic carcinoma, and hepatocellular carcinoma cell lines but in all cases both the permittivity and conductivity significantly exceeded of those found in the related normal cells (Zou et al. 2003; Raoof et al. 2013).
The thermal effect of the electromagnetic field is associated with the absorbed energy by the tissue; it is described by the specific absorption rate (SAR) (Mátay et al. 2000).
(1)
where σ is the conductivity, ρ the density of the material, while Eloc is the average local electric field.
Changes in the temperature, as a thermal effect, can be described by the following:
(2)
where ΔT is the temperature difference in Δt time difference and C is the specific heat of the biological material.
Therefore SAR can be used as the dose of the thermal effect of electromagnetic field.
On the other hand, in the interaction between the electric field and the biological material a non-thermal (or non temperature dependent) effect can also be described related to the non thermal equilibrium (Mátay et al. 2000). It was shown that mEHT has such effect on HT29 (human colorectal adenocarcinoma cell line) cancer xenograft model, where the thermal
16
and non-thermal effects act in synergy for tumor destruction, but the molecular mechanism of these effects were not explained (Andocs et al. 2009).
3.2.3. Clinical observations using modulated electrohyperthermia
So far, mainly the thermal effect is taken into consideration when mEHT is used in clinical practice. Therefore, mEHT represents a heating method in hyperthermic oncology.
There have been several case reports and retrospective studies published on the benefits of using hyperthermia for anti-tumor therapy (Szasz et al. 2010). Though mEHT treatment can interfere with tumor tissue in monotherapy it has been used for hyperthermic oncology in phase I and phase II clinical studies in combination with chemo- and/or radiotherapy of brain, liver, breast and gastrointestinal malignancies (Brazma et al. 2001; Fiorentini et al.
2006; Fiorentini et al. 2006; Wismeth et al. 2010). For instance, compared to the published 30-33 weeks median overall survival, temozolomide-based chemotherapy and radiotherapy supported with mEHT resulted in 36 weeks median overall survival (n = 12) with one complete and two partial remissions (response rate 25%) in recurrent malignant gliomas (Fiorentini et al. 2006). Also, fluorouracil based chemotherapy combined with mEHT resulted in 24.1 months median overall survival in liver metastatic primary colorectal cancers (n = 90) compared to the 12 month median survival reported when fluorouracil chemotherapy was used alone (Hager et al. 1999). Also, it has already been used in combination with chemo– and radiotherapy with benefit for treating recurrent breast cancer (Feyerabend et al. 2001).
3.3. Theoretical background of the observed biological impact of hyperthermia Several studies have proven that hyperthermia can cause different cell death forms under various programmed cell death subroutines (e.g. caspase dependent apoptosis or autophagic cell death) and accidental necrosis at a heat absorption dependent manner (Hildebrandt et al. 2002). In vitro circumstances caspase dependent programmed cell death was proven in cervical cancer cell line and in osteosarcoma cell line (Zhou et al. 2011; Hou et al. 2014).
Hyperthermia induced DNA fragmentation was found in human head and neck squamous cell carcinoma cell line and in murine fibrosarcoma cell line in vitro without further
17
specifying the exact programmed cell death subroutine (Tamamoto et al. 2003; Lui et al.
2010). In HT29 cell line in vitro cell death subroutines were contradictory (Chen et al.
2008; Makizumi et al. 2008) though in vivo the upregulation of Bax protein was found without further clarifying the cell death mechanism (Liang et al. 2007). Accordingly, hyperthermia related cell death mechanism needs to be specified in vivo in different tumor types.
3.3.1. Characteristics of cell death forms
For the definition of different type of cell death forms we first have to define the first irreversible phase within cell damage, the so called “point of no return” and then the characteristics of a dead cell.
The “point of no return” in a cell’s fate can usually be characterized by (1) a massive caspase activation, which is part of the classic apoptotic program. However, caspase independent death may also occur, moreover, caspases might also be involved in non-lethal pathways such as cell differentiation and activation. Further feature is the loss of mitochondrial transmembrane potential (2), which is usually preceded by mitochondrial membrane permeabilisation (MMP). The complete MMP (3) results in the liberation of lethal catabolic enzymes or activators. Finally, the phosphatidilserin (PS) exposure (4) from the inner to the outer leaflet of the plasma membrane can also be a sign of irreversible cell damage (Kroemer et al. 2005; Kroemer et al. 2009).
The main characteristics of cell death are: loss of plasma membrane integrity (1); blebbing of the cytoplasmic membranes and shrinkage of nuclear chromatin followed by the complete fragmentation of the cell including the nucleus (2); the occurrence of discrete nuclear bodies (referred to as “apoptotic bodies”) (3) and finally, the engulfment of cells’
corps by adjacent cells or phagocytes (4) in vivo (Kroemer et al. 2005; Kroemer et al.
2009).
Several subroutines of programmed cell death forms exist including apoptosis, necroptosis/regulated necrosis, autophagic cell death, mitotic catastrophe, netosis, parthantos, pyroptosis, anoikis, entosis and cornification (Galluzzi et al. 2012).
18
Apoptosis was first described as a specific morphological aspect of cell death by Kerr in 1972 (Kerr et al. 1972; Elmore 2007). It was first investigated occurring during the development of Caenorhabiditis elegans, which is made up of 1090 somatic cells in an adult worm of which 131 undergoes the apoptotic process during development (Elmore 2007). The morphological signs of apoptosis are reduction of cellular volume (pycnosis), chromatin condensation, nuclear fragmentation (karyorrhexis), plasma membrane blebbing (Elmore 2007; Kroemer et al. 2009; Galluzzi et al. 2012). For the molecular characterization we have to differentiate extrinsic and intrinsic apoptosis, which can be caspase dependent and independent (Galluzzi et al. 2012). Extrinsic apoptosis can be initiated by a death ligand (e.g. FASL, TNFα and TRAIL) through death receptors (e.g.
FAS, TNFα-R1, TRAIL-R1 and TRAIL-R2). Alternatively, extrinsic apoptosis can also be initiated by dependence receptors (netrin receptors) which exert lethal functions when the concentration of their specific ligand falls below a critical threshold (Galluzzi et al. 2012).
Extrinsic apoptosis would undergo one of the three major signaling cascades: (1) death receptor signaling, activation of caspase-8 followed by the activation of the effector caspase-3 or (2) death receptor signaling activation of caspase-8 cleavage of BID (tBID) resulting in MMP followed by caspase-9 and caspase-3 activation. Ligand deprivation- induced dependence receptor signaling (3) followed by caspase-9 and caspase-3 cascade activation (Galluzzi et al. 2012).
Intrinsic apoptosis can be triggered by intracellular stress such as DNA damage, oxidative stress, cytosolic Calcium overload, accumulation of unfolded proteins in the endoplasmic reticulum (ER), radiation, hypoxia, hyperthermia, viral infection or free radicals (Elmore 2007; Galluzzi et al. 2012). As a result of intracellular stress pores are formed in the mitochondria membrane leading to release of intermembrane space proteins to the cytoplasm (Elmore 2007; Galluzzi et al. 2012). The mechanism of pore formation can be achieved by induction of mitochondrial permeability transition, in which non-specific pores are opened in the outer and the inner membranes of the mitochondria. This can occur in both programmed cell death and accidental necrosis (Gogvadze et al. 2006). The second option for pore formation is the outer membrane permeabilisation by Bcl2 (B-cell lymphoma 2) family pro-apoptotic proteins, such as Bax (Bcl-2 associated X protein) and
19
Bak (Bcl-2 homologous antagonist/killer) occurring in the apoptotic cascades (Gogvadze et al. 2006; Galluzzi et al. 2012). Also, hypotonicity and the modulation of ionic fluxes can lead to mitochondrial membrane permeabilisation (Gogvadze et al. 2006). Once the pores are formed, the mitochondrial transmembrane potential decreases and the intermembrane space proteins are released to the cytosol, such as cytochrome c, apoptosis inducing factor (AIF), endonuclease G, direct IAP-binding protein with low pI (DIABLO) and high temperature requirement protein A2 (HTRA2) (Galluzzi et al. 2012).
If the intermembrane space protein release is followed by a caspase dependent subroutine, then the cytochrome c and Apaf1 (Apoptotic protease activating factor 1) (with d9ATP) will form the apoptosome, which will further trigger the activation of pro-caspase-9 and the effector cascase-3.
On the other hand mitochondrial AIF and endonuclease G can also tranaslocate to the cell nucleus, where they can mediate large scale DNA fragmentation on a caspase independent manner. AIF is synthesized in the cytoplasm as a 67 kDa protein with a mitochondrial localization signal (MLS) in the N terminus. Once it is imported to the mitochondria MLS is removed resulting in a 62 kDa mature protein. During the mitochondrial pore formation a soluble 57 kDa fragment is cleaved form AIF, released from the intermembrane space and transferred to the nucleus (Norberg et al. 2010). Although AIF does not have a canonical DNA binding domain but has a positive charged surface which can bind to the negative charged phosphate backbone of the DNA (Natarajan et al. 2012).
For a long time, necrosis was only considered as an accidental cell death mechanism, however, it can occur also in a regulated manner referred to as programmed necrosis (Galluzzi et al. 2012). It can be triggered by the same ligands and receptors as extrinsic apoptosis (Denecker et al. 2001; Nicotera 2002; Christofferson et al. 2010; Vandenabeele et al. 2010; Han et al. 2011), but caspases are inhibited, therefore RIP1 (receptor interacting serin/threonin-protein kinase 1) and RIP3 (receptor interacting serin/threonin-protein kinase 1) are not degraded and activate the execution of regulated necrosis (Galluzzi et al. 2012).
RIP1 can be activated by autophosphorilation on Ser161 and dimerization. RIP3 can be phosphorilated on Ser199 leading to its activation (Christofferson et al. 2010). Regulated necrosis can occur on RIP1 dependent manner or RIP3 dependent but RIP1 independent
20
manner (Galluzzi et al. 2012). Although the initiation of necroptosis is known the downstream execution mechanism is still unclear (Christofferson et al. 2010;
Vanlangenakker et al. 2012).
Autophagic cell death is characterized by a massive cytoplasmic vacuolization. This kind of cell death can be related to some types of cancers which lack modulators like Bax, Bak or caspases. In most cases autophagy acts as a cytoprotective response, only when it fails to protect the cell it turns into a cell death mechanism (Galluzzi et al. 2012).
3.3.2. Characteristics of immunogenic cell death forms
Apoptosis was considered as an immunologically silent form of cell death, however, recently it has been revealed that some lethal stimuli can lead to an immunogenic way of cell death (Kroemer et al. 2009; Krysko et al. 2012). Immunogenic cell death (ICD) is a form of programmed tumor cell death. In overlap with the molecular signs of programmed cell death the spatiotemporal occurrence of the damage associated molecular pattern (DMAP) is required for professional antigen presenting cells to trigger an antitumor immune response. (Scheffer et al. 2003; Ullrich et al. 2008; Kepp et al. 2011; Garg et al.
2012; D'Eliseo et al. 2013; Ladoire et al. 2013). ICD is known to be provoked by massive cell stress in synergy with programmed cell death (Kepp et al. 2009; D'Eliseo et al. 2013;
Krysko et al. 2013; Ladoire et al. 2013) triggered by chemotherapeutic agents (doxorubicin, oxaliplatin etc.) (Tesniere et al. 2010; Ladoire et al. 2013), cardiac glycosides (Menger et al. 2012), hypericin based photodynamic therapy (Castano et al. 2006; Mroz et al. 2011;
Garg et al. 2012) or capsaicin (D'Eliseo et al. 2013). It is of note, however, that these interventions can generate slightly different DAMP patterns (Garg et al. 2013; Kroemer et al. 2013).
The DAMP sequence, relevant to induce ICD in tumor cells include the pre-apoptotic surface exposure of calreticulin (CRT), the surface appearance of heat shock proteins (Hsp70 and Hsp90) and ATP release at early apoptotic stages, followed by passive release of high mobility group box 1 (HMGB1) as well as Hsp70 and Hsp90 at the late stages (Garg et al. 2010; Kepp et al. 2011; Garg et al. 2012; Martins et al. 2012; D'Eliseo et al.
2013; Garg et al. 2013; Ladoire et al. 2013).
21
Calreticulin is mainly located in the endoplasmic reticulum, interacting with ERp57 and calnexin to maintain the proper protein folding. In the cytoplasm membrane ecto- calreticulin, located in the lipid rafts, act as an ‘eat me‘ signal, where its life time is around 12h. The calreticulin exposure occurs before any sign of an apoptotic event, however an apoptotic signal is required for this exposure. It is suggested that mitochondrial dysfunction and reactive oxygen species (ROS) production with secondary endoplasmic reticulum stress or local ROS generation at the endoplasmic reticulum or unfolded protein response pathway plays an important role in ecto-calreticulin translocation (Garg et al. 2010; Garg et al. 2013). Calreticulin translocation pathway is dependent on the inducer signal (Krysko et al. 2012). Ecto-calreticulin can be uptaken by phagocytes and professional antigen presenting cells (APC) through CD91 (Garg et al. 2010). Unfortunately, ecto-calreticulin driven tumor antigen uptake alone is not sufficient for antitumor immune response (Ladoire et al. 2013).
Heat shock proteins are a family of conserved chaperones induced by cell stress including oxidative stress, irradiation, chemotherapeutic drugs, heat and electromagnetic field (Robert 2003; Blank et al. 2009; Horvath et al. 2010). Tumors frequently show elevated Hsp70 levels (Multhoff et al. 2011). In the cytoplasm, overexpressed Hsp70 can inhibit apoptosis and act as a cytoprotector (Horvath et al. 2010) maintaining protein homeostasis (Gehrmann et al. 2008). However, treatments using oxaliplatin, -radiation, anthracyclines, epidermal growth factor receptor specific antibody or hypericin based photodynamic therapy can trigger the cell membrane accumulation of heat shock proteins leading to ICD (Gehrmann et al. 2008; Garg et al. 2010; Krysko et al. 2012; Kroemer et al. 2013). On the other hand, cell membrane Hsp70 was also linked with the protection of membrane integrity under stress conditions (Horvath et al. 2010). Therefore, in tumor therapy, cell surface Hsp70 positivity has been associated both with negative prognosis, e.g. in lower rectal carcinomas and in squamous cell carcinoma of the lung (Pfister et al. 2007;
Gehrmann et al. 2008) and also with improved outcome e.g. in gastric and colon carcinomas (Pfister et al. 2007). Unfortunately, it is not known how the membrane bound Heat shock proteins can translocate to the cell membrane from the cytoplasm (D'Eliseo et al. 2013) but it was suggested that membrane bound Hsp is associated with
22
phosphatidilserin in tumor cells and by a flip-flop mechanism, it can be exposed to the outer membrane leaflet into lipid rafts (Multhoff 2007). Heat shock proteins may have a crucial effect on initiating immune response on APCs and NK cells (Gehrmann et al. 2008;
Garg et al. 2010). However, heat shock proteins alone on the cell surface are not enough for signaling immunostimulation, they have to form a complex in the cell membrane with a tumor peptide. This happens in paralel with the programmed cell death signaling (Gehrmann et al. 2008; Garg et al. 2010; Multhoff et al. 2011). Besides the immunogenicity of cell membrane Hsp70 (Gehrmann et al. 2008), extracellular heat shock proteins can directly boost the innate immune response (Multhoff et al. 2011).
Both intracellular Hsp70 and Hsp90 assist in protein folding, by stabilizing proteins and preventing their degradation (Calderwood 2013). Membrane exposure of Hsp90 can be induced by bortezomib, anti-EGFR antibody (7A7) and hypericin-based photodynamic therapy (Garg et al. 2013). The surface exposure of Hsp90 may trigger DC activation signal required for cell-cell interaction between dying tumor cell and DC (Spisek et al. 2007), although the Hsp90 receptor on DC remains unknown (Garg et al. 2013).
Release of HMGB1 represents a late signal of ICD with diverse roles. In the nucleus it acts as a non-histone chromatin binding protein interacting with the minor groove of DNA and regulatory molecules such as p53, NF-B and steroid hormone receptors (Kepp et al. 2011;
Guo et al. 2013; Ladoire et al. 2013). Upon cell stress HMGB1 is released either from necrotic or apoptotic cells (D'Eliseo et al. 2013). Extracellular HMGB1 can be a cytokine- like activator of macrophages, a chemotactant for neutrophils and a promoter of dendritic cell (DC) maturation (Guo et al. 2013). However, epigenetic and posttranslational modifications dictate HMGB1 further functions, its acethylation and phosphorilation on both nuclear localization signal leads to secretion to the cytpolasm. Hyperphosphorylation also relocates HMGB1 to the cytoplasm. HMGB1 may be oxidized in a caspase dependent manner or related to ROS production (Guo et al. 2013). The reduced HMGB1 usually binds to RAGE attenuating the pro-inflammatory activity but the oxidized protein binds to toll like receptor (TLR) 2/4 on the dendritic cells which may lead to tumor-specific immune response (Guo et al. 2013). However, if HMGB1 binds to TIM3 (T-cell immunoglobulin
23
domain and mucin domain 3) on tumor associated dendritic cells, it will inhibit anti-tumor activity (Guo et al. 2013).
These DAMP signals combined with cancer antigens can stimulate the maturation of antigen presenting cells, which finally ‘cross-prime’ and activate anti-tumor T-cell immunity (Kepp et al. 2011; Sachamitr et al. 2012).
As a summary, the altered bioelectrodynamic properties of cancer can result in the enrichment of electromagnetic field in the malignant compared to the normal tissues. Since mEHT, a form of hyperthermic therapy, uses electric field in the radiofrequency range (13.56 MHz) it can target the tumor tissue. The treatment related tumor cell death may occur in a programmed manner utilizing caspase dependent apoptosis, caspase independent apoptosis, programmed necrosis, autophagic cell death or accidental necrosis in the tumor tissue. Heat by itself can induce caspase dependent programmed cell death, autophagic cell death and accidental necrosis. In line with the treatment induced programmed cell death specific DAMP signals may appear on malignant cells which can potentially trigger specific anti-tumor immune response through DCs.
24
4. OBJECTIVES
1. Determining tumor cell damage induced by a single shot of modulated electrohyperthermia (mEHT) treatment in an in vivo xenograft model set up using HT29, an aggressive colorectal cancer cell line, in Balb/c (nu/nu) immunocompromised mice.
2. Investigating the molecular background of cell death induced by the mEHT treatment in the HT29 xenograft model.
3. Characterizing additional, cell stress related molecular changes induced by mEHT in the HT29 xenograft model, which may promote antitumor immune response.
Testing for damage associated molecular pattern (DAMP) sequence relevant to immunogenic cell death (ICD) response.
25
5. MATERIALS AND METHODS
5.1.Tumor model
HT29 colorectal adenocarcinoma cell line xenografted to Balb/c (nu/nu) mice were used to determine the molecular mechanism of cell damage induced by a single shot mEHT treatment.
5.1.1. Cell line
HT29 invasive colorectal adenocarcinoma cell line was propagated in Dulbecco’s modified Eagle’s minimal essential medium (DMEM)+ GlutaMax, high-glucose (4.5 g/l) medium including 10% heat inactivated fetal calf serum (FCS) and 1% streptomycin-penicillin (5000 units penicillin and 5 mg streptomycin/ml). Cells were released from a sub-confluent monolayer using 0.25% trypsin and 0.22 mg/ml ethylenediaminetetraacetic acid (EDTA) for 5 min and suspended in a serum free medium to reach the required 107/ml cell concentration. All reagents were from GIBCO (Invitrogen, Carlsbad, USA).
5.1.2. Animal model
Female nude Balb/c (nu/nu) mice (provided by the Experimental Animal House of the National Research Institute for Radiobiology and Radiohygiene, Budapest, Hungary) maintained in sterile environment, kept on sterilized food and water ad libitum under 12 h dark/12 h light cycles. Both femoral regions of 6 to 8-week old mice were subcutaneously injected with 0.1 ml suspension of 107/ml HT29 cells. The animals were treated using mEHT 18 days after HT29 cell injection, when the diameter of symmetrical tumor implants had reached ~1.5 cm. Laboratory animals were kept and treated in compliance with the Hungarian Laws No. XXVIII/1998 and LXVII/2002 on the protection and welfare of animals, and the animal welfare regulations of the European Union. The Governmental Ethical Committee approved the study under No. 22.1/609/001/2010.
26 5.2.Treatment conditions and sampling
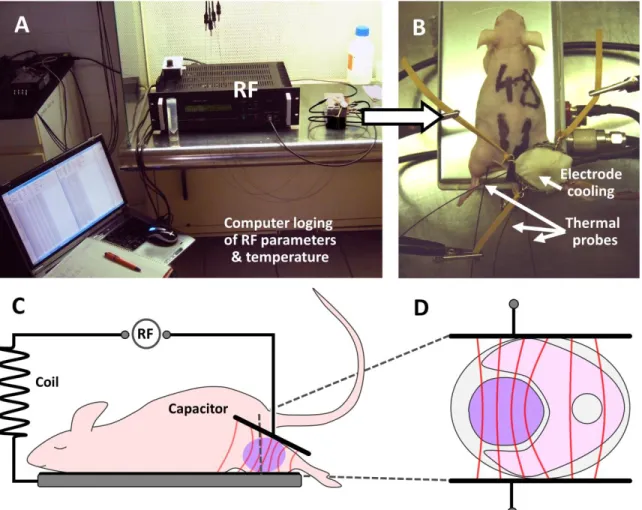
Tumor implants in the right legs of Balb/c (nu/nu) mice were placed into the plan-parallel electric condenser of the circuit. The circuit’s impedance was kept at a standard 50 Ohm and the electrode arrangement was asymmetrical. Animals were laid down on the rectangular grounded (lower) electrode made of polished aluminum of 72.0 cm2, which was kept at 37 °C during the treatment. A 2,5 cm2 round shaped electrode, made of flexible textile (copper-silver-tin coated woven fabric; Lorix Ltd. Bajna, Hungary), was overlaid on the tumor region for full skin contact and cooled from the outside using a wet pad (Figure 2). Electromagnetic field was generated at 13.56 MHz radiofrequency using 1/f amplitude modulation by a LabEHY instrument (both from Oncotherm Ltd, Paty, Hungary).
Treatment groups involved 33 animals, which were delivered a single shot of mEHT for 30 min at an average power of 4 W under 100 mg/kg Ketamine and 10 mg/kg Xylazine anesthesia. Parameters were adjusted to keep intratumoral temperature between 41-42 °C on the treated side (right leg), measured with optical sensors (Luxtron FOT Lab Kit, LumaSense Technologies, Inc. CA, USA). The subcutaneous temperature underneath the electrode was kept at ~40 °C and the rectal and the contralateral (untreated) tumor (left leg) core temperature was at ~37 °C. Sampling was made from both, treated (right leg) and untreated (left leg) sides 0, 1, 4, 8, 14, 24, 48, 72, 120, 168, and 216 h after treatment using 3 mice in each group. Additional 5 sham treated control animals were sacrificed 3 at 24 h and 2 at 72 h post-treatment. All in all 38 mice were sacrificed resulting in 76 tumor samples.
One half of the excised tumors was fixed in 10% formalin, dehydrated and embedded routinely into paraffin wax (FFPE). The other half was fresh-frozen in liquid nitrogen and kept at -80 °C in deep freezer until further testing.
27
Figure 2 Experimental setup of modulated electrohyperthermia (mEHT) treatment.
A) Parameters of the electric field and tumor temperature between 41-42 oC during treatment are monitored. B) Thermal probes and electrode cooling of the treated right side.
C-D) The electric field (red lines) is concentrated in the tumor implant (violet lump) between the condenser electrodes but cannot pass through cell membranes.
5.3. Histomorphological analysis
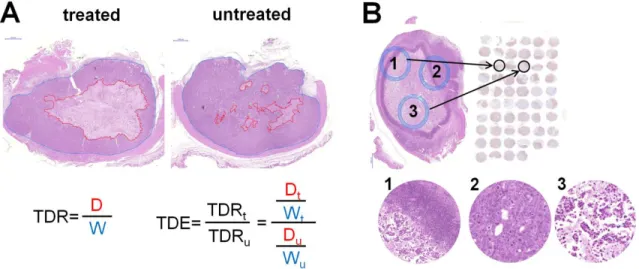
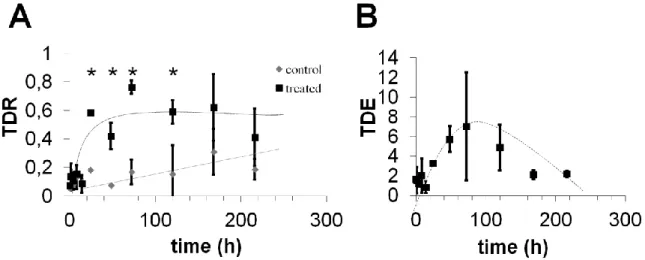
Whole cross sections from each (11) time point of all 76 (treated, untreated and sham treated control) tumor samples were stained for hematoxylin and eosin (H&E) for histomorphological analysis of signs of cell death. The stained slides were digitalized using Pannoramic Scan and analyzed with the HistoQuant module of Pannoramic Viewer software (all from 3DHISTECH, Budapest, Hungary) based on image color and intensity segmentation. The mEHT related tumor destruction ratio (TDR) was calculated by dividing
28
the area of destructed tumor tissue (D) by the whole tumor area (W) measured in whole cross sections. Treatment related tumor destruction efficiency (TDE) was assessed by dividing the TDR of the treated by the TDR of the untreated tumor of the same animal (Figure 3A). For statistical analysis the Kruskal-Wallis test of the SPSS Statistics v.20 software (IBM Corp. New York, NY) was used.
Figure 3Histomorphological analysis and TMA core selection. A) The damaged tumor areas (circled in red) and the whole tumor areas (circled in blue) were delineated precisely in digital slides at high microscopic power (at x45 theoretical objective magnification) and measured with software. The tumor destruction ratio (TDR) value was calculated by dividing the area of destructed tumor tissue (D in red) by the whole tumor area (W in blue) measured in cross sections both of the treated (t) and untreated (u) tumors. The tumor destruction efficiency (TDE) of mEHT treatment was assessed by dividing the TDR of the treated tumor by the TDR of the untreated tumor of the same mouse. B) Standard regions of 2 mm diameter from the damaged-intact tumor border (1 and 2) and from the damaged tumor center (3) were selected based on H&E stained slides.
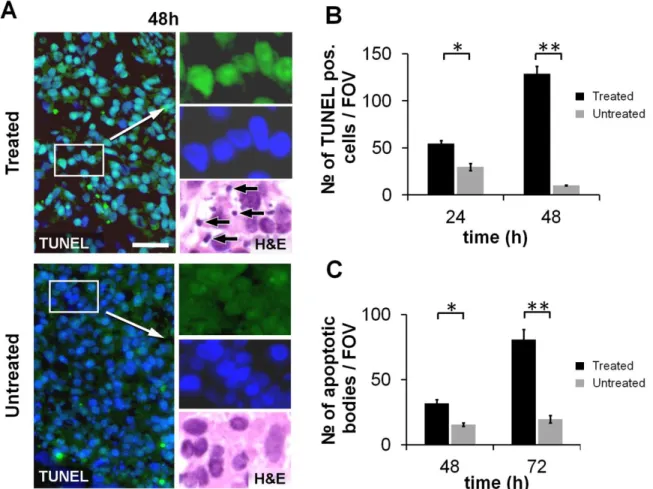
The number of apoptotic bodies was counted at x100 objective magnification in 10 different microscopic fields of views (FOV) of 3 treated and 3 untreated samples at 48, 72 h post-treatment time points. Statistical analysis was carried out using SPSS Statistics v.20 software (IBM Corp).First the normality distribution of the data was tested by Sapiro Wilk test followed by a Student t-test.
In the course of the morphological analysis the signs of apoptotic, necrotic and autophagic cell death were taken into consideration.
29 5.4. Molecular analysis
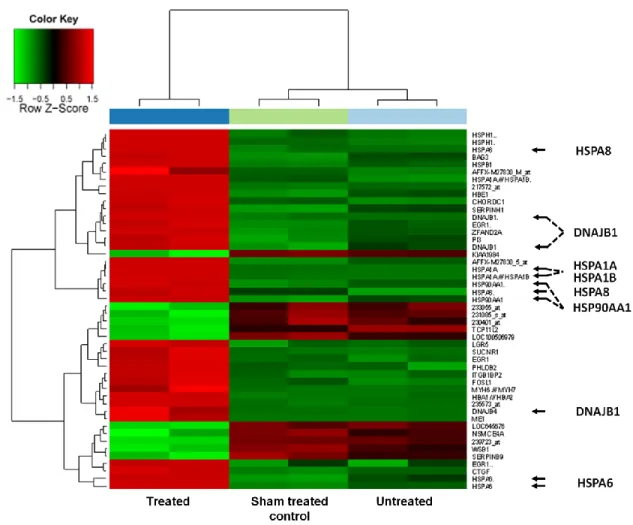
To assess the early (4 h post-treatment) mRNA based molecular changes of the mEHT induced tumor damage a human genome expression array was used. To determine the form of cell death and the stress related tumor response first as a screening method an apoptosis array was applied followed by verifying the molecular changes using immunohistochemistry, immunofluorescence, TUNEL assay and western blot.
5.4.1. mRNA chip analysis
To determine the early treatment related mRNA changes mRNA chip analysis was carried out in 9 tumor samples.
5.4.1.1.Total RNA isolation and RNA quality control
Frozen tissue sections were prepared both from the 3 treated and the 3 untreated samples collected at 4 h post-treatment and from the 24 h 3 sham treated controls. Total RNA was extracted by Roche MagNA Pure LC RNA Isolation Tissue Kit (Roche, Basel, Switzerland). RNA concentration was measured by NanoDrop instrument (Thermo Scientific, Rockford, IL, USA). The quality of the nucleic acid was determined with microcapillary electrophoresis system using Agilent BioAnalyzer 6000 Pico LabChip kit (Aligent Technologies, Santa Clara, CA, USA). With RNA Integrity Number above 7 (RIN
> 7) 100 ng total RNA from each sample were mixed and 250 ng pooled total RNA was amplified and labeled in each group.
5.4.1.2.Microarray analysis
The recommendation of Minimum Information About a Microarray Experiment (MIAME) guideline was followed (Brazma et al. 2001). Amplification and labeling of the transcripts was performed by using Affymetrix 3’ IVT Express Kit (Affymetrix, Santa Clara, CA, USA). Samples were hybridized on HGU133 Plus2.0 arrays (Affymetrix) at 45 °C for 16 h.
The microarrays were washed and stained on Fluidics Station 450 device (Affymetrix) using the vendors kit with the FS450_001 wash protocol. Fluorescent signals were detected
30
by Gene Chip Scanner 3000 (Affymetrix) following the antibody-based signal amplification with streptavidin-phycoerythrin according to manufacturer’s instructions.
From the CEL files quality control and RNA digestion plots were generated in R- environment using the Bioconductor system. The differentially expressed genes between the analyzed sample groups were determined by SAM (Significance Analysis of Microarrays) at the significance level p < 0.05. Feature selections were done according to the log2FC (log2 fold change) values to select at least two-fold up/downregulated genes.
5.4.2. Apoptosis protein array
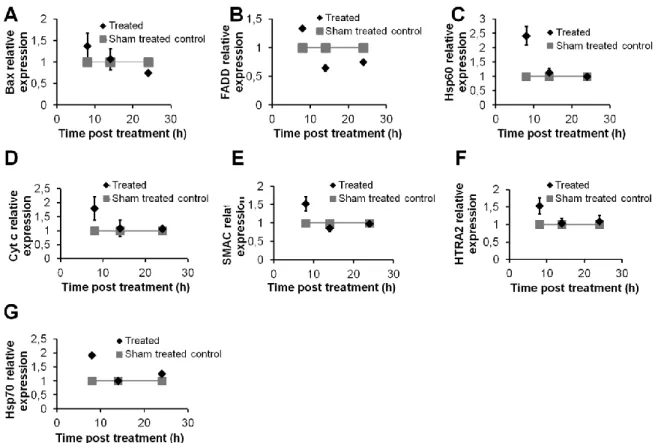
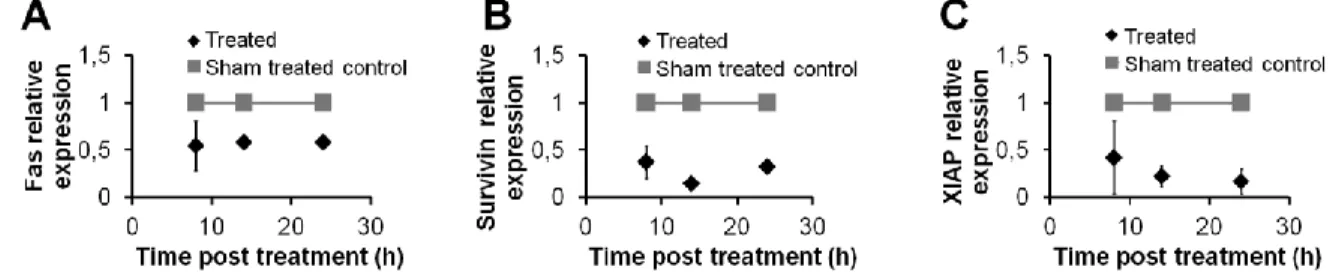
To screen the apoptosis related protein changes, tissue lysates were prepared from the whole tumor sections of the 8, 14 and 24 h treated and 24 h sham treated control samples.
Proteins were isolated from the frozen samples using extraction buffer (20 mM Tris, 2 mM EDTA, 150 mM NaCl, 1% Triton-X100, 10 µl/ml phosphatase inhibitor and 5 µl/ml proteinase inhibitors) for 30 min on ice, followed by centrifugation at 15,000 rpm at 4 °C for 15 min. Protein concentration was measured with Bradford assay the lysates protein concentration was set to 100 µg/µl. The expression of 35 apoptosis-related proteins was tested simultaneously in the treated and untreated samples using a nitrocellulose membrane Proteome Profiler TM Human Apoptosis Array Kit array (R&D, Minneapolis, MN). Arrays were incubated on a shaker with 250 µl of 1,200 µg/ml protein lysates at 4 °C overnight, then with biotinylated anti-human IgG for 60 min and Streptavidin-horseradish peroxidase (HRP) conjugate for 30 min and visualized using a chemilunescence (ECL) kit (SuperSignal® West Pico Chemiluminescent Kit; Thermo Sci., Rockford, IL) for 10 min in Kodak Image Station 4000 mm (Rochester, NY). Semi-quantitative analysis of signal density was done using ImageJ 1.45s (http://rsbweb.nih.gov/ij/).
5.4.3. Immunohistochemistry and immunofluorescence
All 76 FFPE tissue samples were used for creating tissue microarray (TMA) blocks to further characterize the proteins –and their subcellular distribution- related to mEHT induced cell death and cellular stress. TMAs included 3 cores of 2 mm diameter from, 2 from the edges of degraded and intact tumor border and 1 from the degraded center, of each
31
archived tissue using the semi-automated TMA Master (3DHISTECH Ltd., Budapest, Hungary) (Figure 3B). For immunohistochemistry 4 m thick sections were dewaxed and rehydrated routinely, and then endogen peroxidase enzymes were blocked using 3%
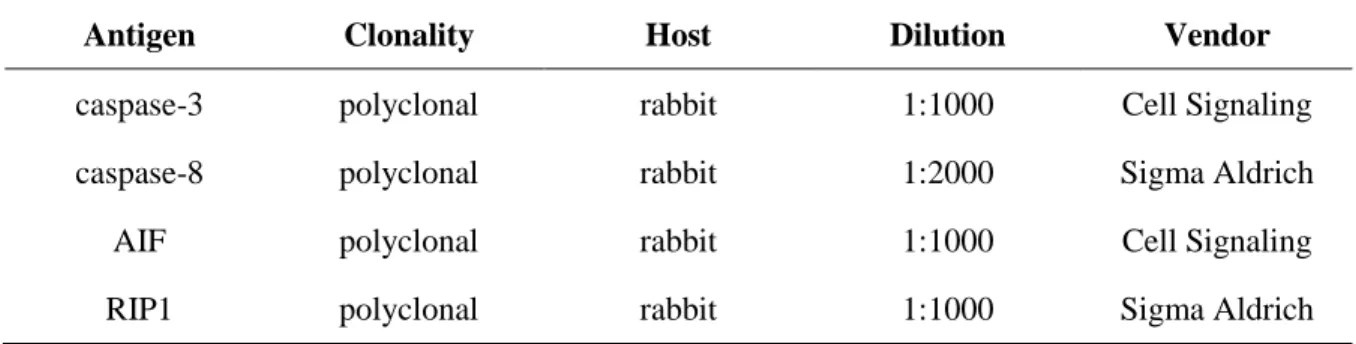
hydrogen peroxide in methanol for 20 min except for immunfuorescence. Antigen retrieval was performed either in electric pressure cooker (Avair Ida YDB50-90D, Biatlon kft, Pécs) at ~105°C for 50 min or in a microwave oven (Whirlpool, Benton Harbor, MI) ~100oC for 40 min by using buffer made either of 0.01 M sodium citrate-citric acid (citrate, pH 6.0) or 0.1 M Trisbase and 0.01 M EDTA (T-E, pH 9.0). For blocking non-specific tissue binding of antibodies a buffer containing 1% bovine serum albumin (BSA) and 0.1% sodium azide (Sigma Aldrich, St Luis, MO) was used for 20 min. Then, sections were incubated in humidity chambers at room temperature for 16 h using the primary antibodies listed in Table 1. For immunohistochemistry the EnVision polymer peroxidase detection system (DAKO) was used for 30 min followed by enzyme development for 5-8 min under microscopic control using either 3,3’-diaminobenzidine (DAB, brown) kit (RE7105, Leica- NovoCastra, Newcastle, UK) or aminoethylcarbazole (AEC, red) kit (Dako, K3461). For immunofluorescence detection either Alexa546 (orange-red) or Alexa488 (green, both from Invitrogen-Molecular Probes) anti-rabbit Ig-s diluted in 1:200 were used for 90 min.
Between incubations the slides were washed in Tris-buffered saline (TBS) buffer for 3x2 min and finally counterstained using hematoxylin or 4’,6-diamidino-2-phenylindole (DAPI, Invitrogen-Molecular Probes). For membrane staining wheat germ agglutinin conjugated with Alexa488 (WGA, Invitrogen-Molecular Probes) was used.
Biomarker expression revealed by immunofluorescence was evaluated using image (color, intensity and size) segmentation based software HistoQuant (3DHISTECH). 3-5 representative annotations per tumor section involving >1000 cells each were tested.
Relative mask area (rMA) was calculated by dividing stained area with the whole annotation area in the following reactions: Bax, cleaved caspasase 3, TRAIL-R2, HMGB1, Hsp70 and Hsp90. In the rest of detected markers, nuclear, mitochondrial or cell membrane signals were counted in 10 (FOV) in each core at x100 magnification. Analyzing a single time point, normality of the data was tested by Sapiro-Wilk test than in case of normal distribution the Student t-test (independent) was applied, in case of non-normal distribution
32
the Mann-Whitney U-test was used. To analyze time series, we used the Friedmann test followed by the Wilcoxon post-hoc test. The results were significant at p < 0.05. For all statistical analysis the SPSS software (SPSS Statistics v.20; IBM, New York, NY) was used.
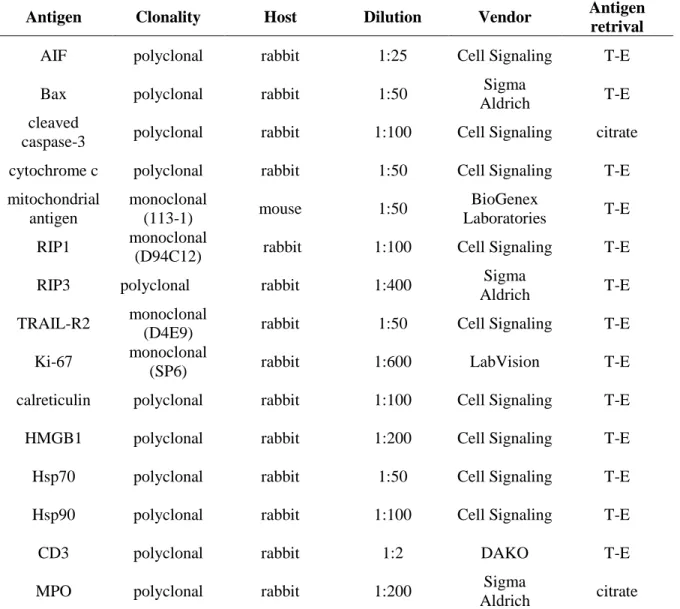
Table 1. Antibodies and conditions used for immunohistochemistry and immuno- fluorescence.
Antigen Clonality Host Dilution Vendor Antigen retrival
AIF polyclonal rabbit 1:25 Cell Signaling T-E
Bax polyclonal rabbit 1:50 Sigma
Aldrich T-E
cleaved
caspase-3 polyclonal rabbit 1:100 Cell Signaling citrate cytochrome c polyclonal rabbit 1:50 Cell Signaling T-E mitochondrial
antigen
monoclonal
(113-1) mouse 1:50 BioGenex
Laboratories T-E RIP1 monoclonal
(D94C12) rabbit 1:100 Cell Signaling T-E
RIP3 polyclonal rabbit 1:400 Sigma
Aldrich T-E
TRAIL-R2 monoclonal
(D4E9) rabbit 1:50 Cell Signaling T-E
Ki-67 monoclonal
(SP6) rabbit 1:600 LabVision T-E
calreticulin polyclonal rabbit 1:100 Cell Signaling T-E
HMGB1 polyclonal rabbit 1:200 Cell Signaling T-E
Hsp70 polyclonal rabbit 1:50 Cell Signaling T-E
Hsp90 polyclonal rabbit 1:100 Cell Signaling T-E
CD3 polyclonal rabbit 1:2 DAKO T-E
MPO polyclonal rabbit 1:200 Sigma
Aldrich citrate Vendor specification: Sigma Aldrich, ST Luis, MO; Cell Signaling, Danvers, MA;
LabVision Thermo Sci, Rockford, IL; BioGenex Laboratories, San Ramon, CA.
33
5.4.4. Terminal deoxynucleotidyl transferase nick end labeling (TUNEL) assay
TUNEL assay was used to pre-screen FFPE TMA sections for DNA fragmentation including the whole time-lapse series of mEHT treated, untreated and sham treated control xenografts. Based on the semi-quantitative results the assay was also performed on whole cross sections of mEHT treated tumors and their matched untreated pairs of 24h and 48h post-treatment. TUNEL assay is based on the detection of DNA nick ends by terminal deoxynucleotidyl transferase (TdT) and linking them with fluorochome labeled deoxyuridine triphosphate (dUTP) nucleotides by the TdT enzyme. Labeling in cell nuclei is proportional to the amount of fragmented DNA as a result of programmed cell death. The
“Click it TUNEL Alexa Fluor 488 Imaging Assay” (Invitrogen) was used according to the manufacturer’s instructions. Briefly, dewaxed and rehydrated slides were heated in a citrate based pH 6.0 antigen unmasking solution (H-3300, Vector Lab, Burlingame, CA) using electric pressure cooker (Avair Ida, as above). Then slides were incubated at 37 °C for 60 min with a cocktail of alkyne substituted dUTP and TdT followed by the fluorochrome for 30 min at room temperature which is coupled to dUTP under copper (I) catalysis.
Finally, nuclear DNA was stained with DAPI (see above). The number of biomarker positive cells was counted at x100 objective magnification in 10 different microscopic FOV of 3 treated and 3 untreated samples at each tested time point. DAPI co-staining was used for confirming the critical nuclear localization in the samples. The data was first tested by Kolmogorov-Smirnov normality test followed by the independent t-test (SPSS Statistics v.20; IBM, New York, NY).
5.4.5. Western blot
Tissue lysates were prepared from 4, 14 and 24 h treated, untreated and 24 h sham treated control frozen samples to measure expression of proteins characteristic to programmed cell death. Extraction buffer (20 mM Tris, 2 mM EDTA, 150 mM NaCl, 1% Triton-X100, 10 µl/ml phosphatase inhibitor and 5 µl/ml proteinase inhibitors) for 30 min on ice were used to produce tissue lysates, followed by centrifugation at 15,000 rpm at 4 °C for 15 min.
Protein concentration was measured with Bradford assay. The extracts were mixed with 5x