Multi-environment Analysis of Grain Quality Traits in Recombinant Inbred Lines of a Biparental Cross
in Bread Wheat (Triticum aestivum L.)
G. Krishnappa1,2, A.K. Ahlawat1, R.B. Shukla1, S.K. Singh1,3, S.K. Singh1, A.M. Singh1* and G.P. Singh1,2
1Division of Genetics, ICAR-Indian Agricultural Research Institute, New Delhi, India
2ICAR-Indian Institute of Wheat & Barley Research, Karnal, Haryana, India
3Department of Microbiology, Biochemistry & Immunology, Morehouse School of Medicine, 720, Westview Drive SW Atlanta, GA, United States of America
(Received 17 July 2018; Accepted 11 January 2019;
Communicated by M. Taylor)
A set of 286 recombinant inbred lines (RILs) along with the parents and a popular wheat variety in India were grown for two consecutive years at three locations belonging to the two major wheat growing zones of India and evaluated for four grain quality traits. Rare recom- binants with high trait value appeared for protein content (PC), thousand-kernel weight (TKW), sedimentation value (SV), and kernel hardness (KH). The magnitude of environ- mental effects was more pronounced than genotypic effects and genotype-environment interaction (GEI). The cumulative contribution of environment and GEI components to the total variance was highest in the expression of PC followed by TKW, SV, and KH. The top five percent (14 RILs) of genotypes with high trait value were subjected to Eberhart and Russell (1966) (ER), genotype and genotype-environment (GGE) and additive main effects and multiplicative interaction (AMMI) stability models. Five RILs were identified as stable in all the three stability models. RIL61 with 38.8%, RIL101 with 8.9%, RIL226 with 26.1%
superiority over check variety were the most stable genotypes in all the three stability mod- els for PC, TKW and KH, respectively. RIL113 was found to be stable genotype in ER and GGE models, whereas, RIL231 was the most stable genotype in AMMI and GGE models in the expression of SV. These common stable genotypes with high trait value identified through ER, AMMI and GGE models could be potential donors in active breeding programs to develop high yielding wheat varieties with improved PC, TKW, SV and KH.
Keywords: wheat quality, stability models, GEI, stable genotypes
Introduction
Wheat (Triticum spp.) alone constitutes nearly one-third of the total cereals consumed in the world and is a staple food crop in many countries including India. Grain protein is an important trait that determines the nutritional quality and baking properties of wheat.
Though wheat is a staple food crop of many countries, it fails to deliver the required quantity of protein. Regions dominated by economically weaker sections face major pro-
*Corresponding author; E-mail: anju_mahendru@yahoo.co.in
tein malnutrition due to lack of both affordability and accessibility of protein supple- ments. Protein and micronutrient malnutrition continue to be a major health burden in developing countries, where pregnant women and young children are particularly vulner- able (Muller and Krawinkel 2005). The trait SV measures the strength of gluten and de- termines the wheat for a specific utility. Weak, medium and strong gluten as measured by low, medium and high SV are best suited for biscuit, chapatti and bread making, respec- tively. SV is being used as a screening tool in wheat quality breeding programs globally to develop product-specific wheat cultivars. Grain yield is a complex trait and is influ- enced by a number of component traits including spike number per square meter, TKW, and a number of grains per spike. High TKW can additionally improve the flour recovery and milling quality of wheat grains (Campbell et al. 1999). KH is an important trait in wheat quality with a profound effect on milling, baking and end-use qualities of wheat.
Soft (low KH), medium (medium KH) and hard (high KH) wheat’s are specifically suit- able for better biscuit, chapatti and bread making, respectively.
The phenotype is a function of inherent genetic makeup, environmental effect, and GEI. Traits like PC, TKW, and SV are physiologically complex in nature. QTLs for PC (Tiwari et al. 2016), TKW (Zhang et al. 2016), SV (Kumar et al. 2013), and KH (Sun et al. 2018), have been identified in different mapping populations of wheat. Environment plays a key role in the expression of traits governed by polygenes. Breeding for quality is a tedious, cost intensive and time-consuming process, which makes quality breeding slow and protracted. The major bottlenecks in the improvement of physiologically complex traits are the greater magnitude of environmental effect and lack of stable donors with high traits value. The other limiting factor in wheat quality breeding is most of the donors with high trait values are in a wild form and its direct utilization in crop improvement program brings a lot of undesirable traits to the gene pool. Adaptation is a complexly in- herited trait subject to a high degree of environmental effects (Allard 1997). Selection of stable donor parents with high trait value in crossing programs is one of the key determi- nants in the success of a breeding program. Understanding the effect of environment on trait expression and its interaction with genotype is critical in trait improvement (Peterson et al. 1986). Various reports have indicated significant effects of environment and GEI on PC (Rozbicki et al. 2015; Saleem et al. 2015), PC and TKW (Khazratkulova et al. 2015), PC, TKW, and SV (Studnicki et al. 2016), PC, SV, and KH (Surma et al. 2012), SV (Castillo et al. 2012), TKW and KH (Aucamp et al. 2006). The environment is the most important factor affecting TKW and PC (Hernandez-Espinosa et al. 2018).
Identification of stable donor parents with high trait value across the major wheat growing areas is of paramount importance to develop wheat verities with wide adaptabil- ity. The assessment of the environmental stability of the genotypes for PC, TKW, SV, and KH is important for a reliable and speedy enhancement of the nutritional, end-use, milling and processing quality of wheat. Until now, there has been a limited number of studies on spring wheat quality and its dependency on genotype × environment × crop management (Hatfield and Walthall 2015). Williams et al. (2008) reviewed the effect of genotype, en- vironment, and GEI on wheat quality traits and suggested further targeted research on GEI since the present understanding is incomplete. Most of the GEI studies were charac-
terized by a limited number of genotypes (Rozbicki et al. 2015; Studnicki et al. 2016;
Zecevic et al. 2013). The present study was aimed to estimate the magnitude of environ- ment and GEI effects in the expression of PC, TKW, SV and KH in a biparental RIL population and to identify promising and stable genotypes by ER, AMMI and GGE mod- els to be used as donors in the quality breeding program to develop high yielding wheat varieties with improved PC, TKW, SV, and KH.
Materials and Methods Genotypes and environments
Genetic materials consisted of 286 RILs developed from a biparental cross between an Indian bread wheat cultivar WH542 and a synthetic derivative [Triticum dicoccon PI94624/Aegilops sqarrosa (409)//BCN] imported from CIMMYT, Mexico. The RILs were developed by single seed descent method and maintained at Grain Quality Labora- tory, ICAR-IARI, New Delhi, India. The RILs (F7 generation) were evaluated at three different locations, two belonging to the North Western Plains Zone (NWPZ) and one to the North Eastern Plains Zone (NEPZ) during the winter (rabi) season of the years 2012–2013 and 2013–2014. The locations in NWPZ include Delhi (ICAR-Indian Agri- cultural Research Institute, Research Farm, New Delhi, 28°38′N, 77°9′E, 228.6 m AMSL) and Pantnagar (Govind Ballabh Pant University of Agriculture and Technology, Research Farm, Uttarakhand, 29°N, 79°31′E, 243.8 m AMSL). The third location, Pusa Bihar at ICAR-IARI, Regional Station, Research Farm, Samastipur, 25°14′N, 87°2′E, 62.5 m AMSL belonged to the NEPZ. Around 75% of wheat growing area in India belongs to NWPZ and NEPZ. These zones are an integral part of mega-environments and priority areas for International Maize and Wheat Improvement Center (CIMMYT) spring bread wheat breeding program (Rajaram et al. 1993).
The crop was sown at optimal time under irrigated conditions in the first fortnight of November at all the locations in both the years. The genotypes were planted in a rand- omized complete block design (RCBD) with two replications per genotype and two rows (5 m length) per replication with a plant-to-plant distance of 10 cm and row-to-row dis- tance of 25 cm. Standard agronomic practices were followed for growing the crop.
A complete set (286) of tested RILs were used for pooled analysis to estimate the magni- tude of GEI. The size of the studied material was too big to analyze and represent graph- ically through biplot analysis (AMMI and GGE). Genotypes will overlap in interaction biplots and could not be able to discriminate the individual genotype in the graphs. There- fore, we selected the top five percent (14 RILs) of genotypes to construct biplots.
Estimation of PC, SV, TKW, and KH
The PC in the grain samples were determined by the Kjeldahl method using the Autokjeltech system 3100 from Foss, Tecator, USA. 20 gm grain sample was ground us- ing cyclotech mill (Foss Tecator, Sweden). 10ml concentrated H2SO4 and 4.5 g of catalyst
mixture was added to the 0.5 g of grain sample. The samples were digested at 45 °C for 30–45 minutes till the contents were clear. After cooling, 70 ml distilled water was added to the digestion tubes, the digested contents were distilled by the distillation system. The PC was obtained by multiplying with a factor of 5.7 and the values were expressed at 12%
moisture basis. SV of flour was determined using the method of Axford et al. (1979). KH was analyzed using Single Kernel Characterization System (SKCS) 4100 from Perten Instruments, Australia. To record TKW, reading was set at 1000 grains in the Numigral grain counter and the weight of the grains was recorded with an electronic balance.
Statistical analysis
The data of 286 RILs were subjected to pooled analysis of variance (ANOVA). Stability analysis was done by following the model proposed by Eberhart and Russell (1966) using Windostat (Version 8.0, Indostat Services, University of Agricultural Sciences, Banga- lore, India) software. A principal component analysis (PCA) on selected genotypes was performed to construct a GGE and AMMI biplot using GenStat 18th Edition (VSN Inter- national Ltd, Hemel Hempstead, UK). Pearson’s correlations of the means were deter- mined for all the six environments and four traits.
Results
Phenotypic variation and association studies
The mean and range of RILs and its parents are presented in Table S1*. A wide range of variation was observed among the RILs. Transgressive segregants surpassing both the parents appeared for all the traits. Pearson’s correlation coefficient (r) of PC, TKW, SV, and KH are presented in Figure S1*. The associations were highly significant and posi- tive in most of the environments between PC and TKW, and PC and SV. Whereas, the association of KH was negative and significant with PC, TKW, and SV. Percent superior- ity of top five percent (14 RILs) of RILs for PC, TKW, SV, and KH are presented in Table S2.
Trait comparisons in multi-environments
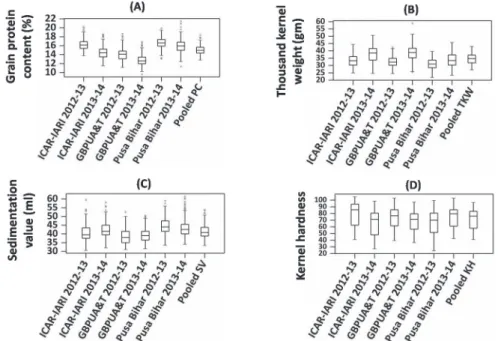
Year effect was more pronounced than location effect in the expression of TKW, whereas, the location effect was predominant in the expression of SV (Fig. 1). Year 2012–2013 was the unfavorable environment and recorded low site mean for TKW, whereas, 2013–2014 considered to be the favorable environment and recorded high site means in all the loca- tions. The lowest site mean was recorded in GBPUA&T location, whereas, the highest site mean was recorded in Pusa Bihar location in the expression of SV and PC in both the years 2012–2013 and 2013–2014 (Fig. 1).
*Further details about the Electronic Supplementary Material (ESM) can be found at the end of the article.
GEIs
The pooled ANOVA (Table 1) was carried out after conducting Bartlett’s test. The test was found to be non-significant for all the tested traits. The ANOVA indicated that the effects of genotype, environment, and GEI were highly significant (p < 0.01) for PC, TKW, SV, and KH. The environment component accounts for a substantial part of the total variance. The magnitude of environmental effect was more pronounced than geno- typic effect and its interaction. The cumulative contribution of environment and GEI
Figure 1. Box-plots for protein content, thousand-kernel weight, sedimentation value, and kernel hardness in RIL population (286) grown in 2012–2013 and 2013–2014 at ICAR-IARI, GBPUA&T, and Pusa Bihar
Table 1. Combined analysis of variance for grain protein content, thousand kernel weight, sedimentation value, and kernel hardness of RILs population (286) grown in 2012–2013 and 2013–2014
at ICAR-IARI, GBPUA&T, and Pusa Bihar
Source of variation df Mean ssum of squares
PC TKW SV KH
Genotypes 285 11.21** 150.21** 157.48** 2555.22**
Environment 5 1273.93** 5406.67** 3278.97** 17273.36**
Genotype × environment 1425 1.84** 14.57** 17.76** 107.91**
Error 1710 0.91 2.47 5.03 18.48
**Significance at p < 0.01; *Significance at p < 0.05.
component to the total variance was highest in the expression of PC followed by TKW, SV, and KH. PC was the most environmentally sensitive trait and KH was least affected by environment.
Joint regression analysis
The GEI component was further elaborated by using the joint regression model of stabil- ity analysis proposed by Eberhart and Russell (1966). The ANOVA for stability using Eberhart and Russell model revealed that both the main effects and its interaction effects were found to be significant (Table 2). Variation due to genotype-environment (linear) was non-significant for KH.
Table 2. ANOVA for stability of grain protein content, thousand-kernel weight, sedimentation value, and kernel hardness by Eberhart and Russell 1966
Source of variation df Mean sum of squares
PC TKW SV KH
Genotypes 285 5.6** 75.1** 78.7** 1277.6**
Environment 5 636.9** 2703.3** 1639.4** 8636.6**
Genotype × environment 1425 0.9* 7.2** 8.8** 53.9**
Environment + (genotype × environment) 1430 3.1** 16.7** 14.5** 83.9**
Environment (linear) 1 3184.8** 13516.6** 8197.4** 43183.4**
Genotype × environment (linear) 285 1.0* 9.9** 9.0** 38.4
Pooled deviation 1144 0.8 6.5 8.8 57.6
Pooled error 1710 0.9 2.4 5.0 18.4
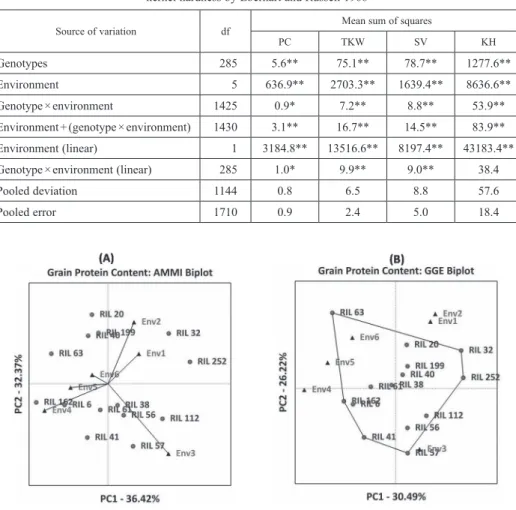
Figure 2. AMMI and GGE biplots for protein content in the top five percent of RILs
Identification of stable genotypes by ER, GGE and AMMI stability models
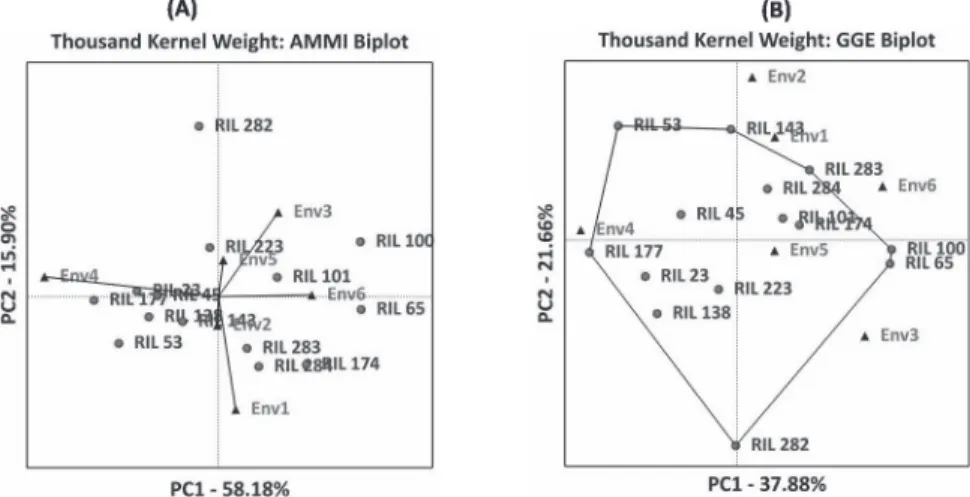
Biplot (GGE and AMMI) analysis provides a graphical representation to identify stable genotypes across the environments as well as genotypes adapted to specific environ- ments. ER stability model considers a stable genotype as the one with unit regression (bi = 1) and minimum deviation from linearity (S2di = 0). Whereas, in biplot analysis, the genotypes which are lying near the origin are considered to be stable across the tested environments. The first two principal components of AMMI and GGE biplot explained 68.79% and 56.71% variation in the expression of PC, respectively. For TKW, the first two principal components explained 74.08% (AMMI) and 59.54% (GGE) of variation.
Figure 3. AMMI and GGE biplots for thousand kernel weight in the top five percent of RILs
Figure 4. AMMI and GGE biplots for sedimentation value in the top five percent of RILs
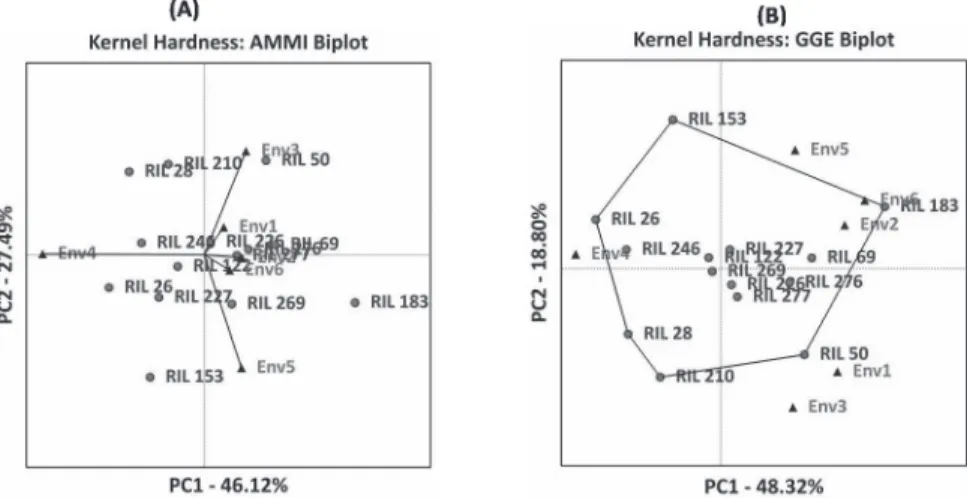
The first two principal components explained 56.71% (AMMI) and 47.32% (GGE) of variation for SV and 73.61% (AMMI) and 67.12% (GGE) of variation in the expression of KH. Based on biplot and joint regression analysis stable genotypes were identified for all the studied traits (Figs 2–5 and Table S3).
Discussion Genetic variability
ANOVA revealed significant variation for PC, TKW, SV, and KH suggesting the presence of wide genetic variability. Transgressive segregants with extreme trait values which sur- pass both the parents appeared for all the traits. PC, TKW, SV and KH ranged from 9.61–21.47%, 21.82 gm – 58.8 gm, 30.5 ml – 61.5 ml, and 24.0–105.0, respectively. The pooled mean of RILs across the locations and years was 15.0% (PC), 34.53 gm (TKW), 41.45 ml (SV), and 71.37 (KH). Sufficient genetic variability is prerequisite for an effi- cient breeding program to improve the target traits. Breeding value depends on trait herit- ability, selection index and phenotypic variability of the trait. Therefore, RILs with high trait value could be potential donors in quality breeding programs.
Trait associations
The association of PC with TKW and SV was highly significant (p < 0.01) and positive in most of the environments. Improvement of PC would allow the other traits (TKW and SV) to be improved simultaneously. The significant (p < 0.01) and negative association of KH with PC, TKW, and SV suggested that these traits be improved independently. Previ- ous studies have reported the positive association of PC with TKW (Reza et al. 2013) and SV (Mikulikova et al. 2009).
Figure 5. AMMI and GGE biplots for kernel hardness in the top five percent of RILs
GEIs
The relative contribution of genotype, environment and GEI in the expression of PC (Saleem et al. 2015), PC and TKW (Khazratkulova et al. 2015), PC, TKW, and SV (Mut et al. 2010), PC, SV, and KH (Surma et al. 2012) and SV (Castillo et al. 2012) has been studied. These studies indicate that the environment component accounts for a substantial part of the total variance. In the present study also, genotype, environment, and GEI ef- fects were highly significant for PC, TKW, SV, and KH. The magnitude of environmental effect was more pronounced than genotypic effect and GEI. The cumulative contribution of environment and GEI component to the total variance was highest in the expression of PC followed by TKW, SV, and KH. Most environmentally sensitive trait was PC and the least one was KH. Influence of genetic variance components was more in the expression of KH, whereas, TKW was mostly influenced by the environmental variance components (Yong et al. 2004). Year effect had a greater influence than the location in the expression of TKW, whereas, the location effect was predominant in the expression of SV. Both year and location effects were important for PC. The similar results of strong location effect on PC was reported by Rozbicki et al. (2015). The reason for greater GEI could be their quantitative inheritance as reported in wheat for PC (Tiwari et al. 2016), TKW (Zhang et al. 2016), SV (Kumar et al. 2013), and KH (Sun et al. 2018), thus pointing to a possible but potentially slow genetic gain during breeding for these traits because of substantial influence of environment and GEI.
Identification of stable genotypes
Biplot (GGE and AMMI) analysis provides a graphical representation to identify stable genotypes and joint regression analysis by ER model considers a stable genotype as the one with unit regression and a minimum deviation from linearity. Though the traits (PC, TKW, SV, and KH) expression was predominantly influenced by environment and GEI, we identified a few common stable genotypes in all the three stability models (ER, AMMI and GGE). The rare recombinants with a greater buffering ability to fluctuating environ- ments appeared due to a relatively larger size of mapping population and parents used to develop mapping population were contrasting for the studied traits. Common genotypes found to be stable in all the three stability models were presented in Table S3. RIL61 was found to be stable in all the three stability models with 17.69% of PC; so also it was 38.8% and 17.9% superior over the check variety and grand mean of 286 RILs, respec- tively. RIL101 was the common stable genotype with percent superiority of 8.9% over check and 17.2% over grand mean in the expression of TKW. RIL113 (ER and AMMI) and RIL231 (AMMI and GGE) were the common stable genotypes for SV. The percent superiority was 22.4% (RIL113) and 23.4% (RIL231) over check variety and 19.4%
(RIL113) and 21.0% (RIL231) over grand mean. RIL226 was the common stable geno- type with percent superiority of 26.1% and 31.9% over check and grand mean in the ex- pression of KH.
This study demonstrates that environment and GEI have greater effects than genotypes per se in the expression of PC, TKW, SV, and KH. The strong positive association of PC with TKW and SV suggest that improvement of PC would allow TKW and SV to be im- proved simultaneously. The three models of stability analysis (ER, AMMI and GGE) used in this study identified three (RIL61 for PC; RIL101 for TKW; RIL226 for KH) common stable genotypes. One stable genotype by any two models viz., RIL113 by ER and AMMI and RIL231 by AMMI and GGE were also identified for SV. Thus the RILs identified as stable and high trait value genotypes for different grain quality traits PC (RIL61), TKW (RIL101), KH (RIL226), and SV (RIL113 and RIL231).
Acknowledgement
This work is outcome of Department of Biotechnology, Government of India funded project (BT/AGR/Wheat Bioforti/PH-II/2010).
References
Allard, R.W. 1997. Genetic basis of the evolution of adaptedness in plants. In: Tigerstedt, P.M.A. (ed.) Adaptation in Plant Breeding. Developments in Plant Breeding, vol 4. Springer, Dordrecht. pp. 1–11.
Aucamp, A., Labuschagne, M.T., Van Deventer, C.S. 2006. Stability analysis of kernel and milling character- istics in winter and facultative wheat. S. Afr. J. Plant Soil 23(3):152–156.
Axford, D.W.E., McDermott, E.E., Redman, D.G. 1979. Note on the sodium dodecyl sulfate test of bread mak- ing quality: Comparison with pelshenke and zeleny tests. Cereal Chemi. 56:582–584.
Campbell, K.G., Bergman, C.J., Gualberto, D.G., Anderson, J.A., Giroux, M.J., Hareland, G., Fulcher, R.G., Sorells, M.E., Finney, P.L. 1999. Quantitative trait loci associated with kernel traits in a soft × hard wheat cross. Crop Sci. 39:1184–1195.
Castillo, D., Matus, I., Pozo, A.D., Madariaga, R., Mellado, M. 2012. Adaptability and genotype × environment interaction of spring wheat cultivars in Chile using regression analysis, AMMI, And SREG. Chilean J. Agr.
Res. 72(2):167–174.
Eberhart, S.A., Russell, W.A. 1966. Stability parameters for comparing varieties. Crop Sci. 6:36–40.
Hatfield, J.L., Walthall, C.L. 2015. Meeting global food needs: realizing the potential via genetics × environ- ment × management interactions. Agron. J. 107(4):1215–1226.
Hernandez-Espinos, N., Mondal, S., Autrique, E., Gonzalez-Santoyo, H., Crossa, J., Huerta-Espino, J., Singh, R.P., Guzman, C. 2018. Milling, processing and end-use quality traits of CIMMYT spring bread wheat germplasm under drought and heat stress. Field Crops Res. 215:104–112.
Khazratkulova, S., Sharma, R.C., Amanov, A., Ziyadullaev, Z., Amanovi, O., Alikulov, S., Ziyaev, Z., Muzafarova, D. 2015. Genotype × environment interaction and stability of grain yield and selected quality traits in winter wheat in Central Asia. Turk J. Agric. For. 39:920–929.
Kumar, A., Elias, M., Elias., Ghavami, F., Xu, X., Jain, S., Frank, A., Manthey, Mergoum, M., Mohammed, S., Alamri, Penny, M.A., Kianian, Shahryar, F., Kianian. 2013. A major QTL for gluten strength in durum wheat (Triticum turgidum L. var. durum). J. Cereal Sci. 57:21–29.
Mikulikova, D., Masar, S., Horvathova, V., Kraic, J. 2009. Stability of quality traits in winter wheat cultivars.
Czech J. Food Sci. 27(6):403–417.
Muller, O., Krawinkel, M. 2005. Malnutrition and health in developing countries. CMAJ 3(3):279–286.
Mut, Z., Aydin, N., Bayramoglu, H.O., Ozcan, H. 2010. Stability of some quality traits in bread wheat (Triticum aestivum) genotypes. J. Env. Biol. 31:489–495.
Peterson, C.J., Johnson, V.A., Mattern, P.J. 1986. Influence of cultivar and environment on mineral and protein concentrations of wheat flour, bran and grain. Cereal Chem. 63:118–186.
Rajaram, S., Van Ginkel, M., Fischer, R.A. 1993. CIMMYT’s wheat breeding mega-environments (ME). In:
Proc. of the 8th Int. Wheat Genetics Symp. Beijing. 20–25 July. Institute of Genetics, Chinese Academy of Sciences, Beijing, pp. 1101–1106.
Reza, D., Reza, M., Bihamta., Najafian, G., Ebrahimi, A. 2013. Kernel quality association and path analysis in bread wheat. Int. J. Biol. 5(3):73–79.
Rozbicki, J., Ceglinska, A., Gozdowski, D., Jakubczak, M., Cacak-Pietrzak, G., Madry, W., Golba, J., Piechocinski, M., Sobczynski, G., Studnicki, M., Drzazga, T. 2015. Influence of the cultivar, environment and management on the grain yield and bread-making quality in winter wheat. J. Cereal Sci. 61:126–132.
Saleem, N., Ahmad, M., Wani, S.A., Vashnavi, R., Dar, Z.A. 2015. Genotype-environment interaction and stability analysis in Wheat (Triticum aestivum L.) for protein and gluten contents. Sci. Res. Essays 10(7):260–265.
Studnicki, M., Wijata, M., Sobczynski, G., Samborski, S., Gozdowski, D., Rozbicki, J. 2016. Effect of geno- type, environment and crop management on yield and quality traits in spring wheat. J. Cereal Sci. 72:30–37.
Sun, X., Liu, T., Ning, T., Liu, K., Duan, X., Wang, X., Wang, Q., An, Y., Guan, X., Tian, J., Chen, J. 2018.
Genetic dissection of wheat kernel hardness using conditional QTL mapping of kernel size and protein- related traits. Plant Mol. Biol. Rep. 36:1–12.
Surma, M., Adamski, T., Banaszak, Z., Kaczmarek, Z., Kuczynska, A., Majcher, M., Ługowska, B., Obuchowski, W., Salmanowicz, B., Krystkowiak, K. 2012. Effect of genotype, environment and their inter- action on quality parameters of wheat breeding lines of diverse grain hardness. Plant Prod. Sci. 15(3):192–
Tiwari, C., Wallwork. H., Arun, B., Mishra, V.K., Velu, G., Stangoulis, J., Uttam, K., Hugh, W., Joshi, A.K. 203.
2016. Molecular mapping of quantitative trait loci for zinc, iron and protein content in the grains of hexa- ploid wheat. Euphytica 207:563–570.
Williams, R.M., O’Brien, L., Eagles, H.A., Solah, V.A., Jayasena, V. 2008. The influences of genotype, envi- ronment, and genotype × environment interaction on wheat quality. Aust. J. Agric. Res. 59:95–111.
Yong, Z., Zhonghu, H., Ye, G., Aimin, Z., Ginkel, M.V. 2004. Effect of environment and genotype on bread- making quality of spring-sown spring wheat cultivars in China. Euphytica 139:75–83.
Zecevic, V., Boskovic, J., Knezevic, D., Micanovic, D., Milenkovic, S. 2013. Influence of cultivar and growing season on quality properties of winter wheat (Triticum aestivum L.). African J. Agri. Res. 8(21):2545–2550.
Zhang, H., Chen, J., Li, R., Deng, Z., Zhang, K., Liu, B., Tian, J. 2016. Conditional QTL mapping of three yield components in common wheat (Triticum aestivum L.). Crop J. 4(3):220–228.
Electronic Supplementary Material (ESM)
Electronic Supplementary Material (ESM) associated with this article can be found at the website of CRC at http://www.akademiai.com/content/120427/
Electronic Supplementary Table S1. Mean and range of protein content, thousand kernel weight, sedimentation value, and kernel hardness in RIL population (286) grown in 2012–2013 and 2013–2014 at ICAR-IARI,
GBPUA&T and Pusa Bihar
Electronic Supplementary Table S2. Percent superiority of the top five percent of RILs for grain protein content, thousand-kernel weight, sedimentation value, and kernel hardness
Electronic Supplementary Table S3. Stable genotypes identified for grain protein content, thousand-kernel weight, sedimentation value, and kernel hardness by ER, GGE and AMMI stability models Electronic Supplementary Figure S1. Graphical representation of correlation coefficients for protein content, thousand-kernel weight, sedimentation value, and kernel hardness in RIL population (286) grown in 2012–2013
and 2013–2014 at ICAR-IARI, GBPUA&T and Pusa Bihar
Color represents strength of correlation from strongly negative (dark blue) to strongly positive (dark red). Env1:
ICAR-IARI 2012–2013; Env2: ICAR-IARI 2013–2014; Env3: GBPUA&T 2012–2013; Env4: GBPUA&T 2013–2014; Env5: Pusa Bihar 2012–2013; Env6: Pusa Bihar 2013–2014