GGE Biplot Analysis of Reactions of Bread Wheat Pure Lines Selected from Central Anatolian Landraces of Turkey to Leaf Rust Disease (Puccinia triticina) in Multiple Location-Years
K. AKAn1* and M. AKcurA2
1University of Ahi Evran, Faculty of Agriculture, Department of Plant Protection, Kırsehir, Turkey
2University of Çanakkale Onsekiz Mart, Faculty of Agriculture, Department of Field Crops, Çanakkale, Turkey
(Received 9 June 2017; Accepted 31 August 2017;
Communicated by J. Kolmer)
The present study was conducted to determine the reactions of 88 bread wheat pure lines selected from landraces collected in Central Anatolian Region of Turkey against leaf rust (Puccinia triticina) under field conditions in 7 locations. GGE biplot analysis was used to determine the reactions of landrace genotypes against the disease. The GGE biplot explained 73.89% of total variation. Among the experimental locations, 6 (except for E3) were placed close to each other over the biplot graph, indicating two apparent mega-environments. The GGE biplot visually displayed the resistance and stability of the pure lines to leaf rust. The landrace genotypes L18, L19, L45, and L2 were identified as the most resistant/stable geno- types in all environments and L31 and L56 were the most susceptible/stable genotypes.
Keywords: Landraces, pure line, Turkey, leaf rust (Puccinia triticina), GGE-biplot analyses
Introduction
Turkey is the genetic origin of bread wheat. DNA analyses on wheats obtained from the Çatalhöyük archeological excavations close to Göbekli Tepe mount where wheat was cultivated revealed that today’s modern hexaploid wheat was cultivated in Anatolia in B.C. 7000s (Bilgiç et al. 2016). It is also known that different civilizations in Anatolia used wheat intensely for different purposes. Being cultivated since immemorial times, wheat is a cultural crop in Turkey. Wheat is also a major staple in today`s Turkey, as wheat products contribute to meeting daily calorie needs of Turkish people (Akçura and Kökten 2017). Landraces are still being cultivated in confined production sites generally without any chemical fertilizer and pesticide applications (Morgounov et al. 2016). The genetic bases in wheat breeding programs implemented for various purposes have nar- rowed because of similarities in selection criteria and selection priorities. To improve the efficiency of the breeding programmes, the genetic base should be widened through using
landraces with different characteristics, and such landraces should be incorporated into breeding programs to provide alternatives at different levels (Akçura and Kökten 2017).
Therefore, there is a need for further work on landraces in gene banks, characterizing them at uppermost level and introducing more in breeding programs (Akçura and Kökten 2017).
Leaf rust is an important disease of wheat particularly in humid and warmer climates.
In a study reviewing the results of several researches carried out in Canada, yield losses caused by leaf rust ranged from 12 to 28% (Kolmer et al. 2007). In Turkey, leaf rust (caused by Puccinia triticina) is encountered often in wheat growing areas in coastal re- gions, Southeastern Anatolia, Çukurova, Middle Black Sea, Southern Marmara and Thrace regions of Turkey. Based on severity and duration, the disease results in yield and quality losses at various levels. Disease-induced yield loss was reported as between 6.6–
62.7% in a study carried out through sowing 15 wheat genotypes developed in CIMMYT between 1986 and 1988 in one location when sown at regular and late sowing dates (Sayre et al. 1998). Yield losses rarely go over 50% in some cases (Kınacı 1982). In an- other study (Arslan et al. 2002) carried out in the Bursa province of Turkey, where the disease is encountered at different levels each year, the average loss was reported as 531 kg ha–1 (9.4%) for grain yield and 4.3 g (9.3%) in 1000-grain weight.
Although fungicide can be used to prevent leaf rust, genetically resistant cultivars should be improved and used in places where the disease is widespread. Resistant culti- vars can also provide great contributions to improving environmental safety and human health and agricultural sustainability. Although several studies have been carried out to identify genetic resources in Triticum and some related species (for instance, T. monoco- cum, T. timopheevii, T. dicoccoides, Aegilops sp.) resistant to yellow, leaf and stem rusts, problems were encountered in transfer of the resistance to existing wheat genotypes (Ma et al. 1995). Therefore, landraces should be assessed appropriately for resistance to rust diseases for development of resistant cultivars. To improve efficiency of these ap- proaches reactions of the landraces against the rust diseases should be tested in different environments and resistant genotypes should be included in germplasm and used in fur- ther breeding programs (Sehgal et al. 2016).
While more than 70 sources of genetic leaf rust resistance have been determined (to date there are 78 designated leaf rust resistance genes), the ability of the P. triticina to evolve quickly, and almost solely through asexual recombination, has made P. triticina one of the most harmful pathogens (McIntosh et al. 2012). GGE biplot analysis has been a popular method for multi environment different trial data analysis (Yan et al. 2000;
Sharma et al. 2016). A GGE biplot displays the genotype main effect (G) plus the geno- type by environment interaction (GE); GGE is the part of variation that is relevant to cultivar evaluation. GGE biplot is an effective method based on principal component analysis (PCA) to graphically display the patterns of the genotype by environment data.
This allows visual examination of the relationships among the test environments, geno- types, and the GE interactions (Yan 2014; Sharma et al. 2016).
The present study was conducted to assess the reactions of 88 bread wheat pure lines selected among landraces grown in Central Anatolia Region against leaf rust under natu- ral conditions in 7 different environments in Turkey through GGE-biplot analysis.
Materials and Methods
Eighty-eight pure lines selected from landraces grown in Eskişehir, Konya, Sivas, and Yozgat provinces of Central Anatolia region of Turkey were used as the test material.
Single spike selection was used to develop pure lines from the landraces (Akçura and Kökten 2017). Studies were conducted in 2011/2012, 2012/2013 and 2013/2014 growing seasons (3 years) at Çanakkale, Edirne, and Samsun locations with two replications. The years in the same location were treated as an individual environment considering possible climatic effects. However, since leaf rust did not reach desired levels under natural condi- tions in Samsun location in 2013 and 2014 growing seasons, these location-years were eliminated from analyses.
Long-term average precipitations 529.4 mm, 484.5 mm and 534.7 for the locations of Çanakkale, Edirne and Samsun respectively. The long-term average temperatures of April and May in which leaf rust is developed were 12.6 and 17.6 °C, 12.8 and 18.1 °C and 11.4 and 15.6 °C for the same locations respectively.
All locations selected for experiments had a history of leaf rust on wheat. Wheat lines were sown by hand in the first quarter of November in each growing season in 1 m long rows with two replications in each location year. Disease was allowed to develop natu- rally and no inoculation was performed. For more uniform disease spreading, susceptible control cultivars (cv. Thatcher and cv. Morocco) were sown in every 10 rows of experi- mental entries. Again, for the same purpose, the susceptible cv. Gün 91 was also sown in every 6 of experimental entries.
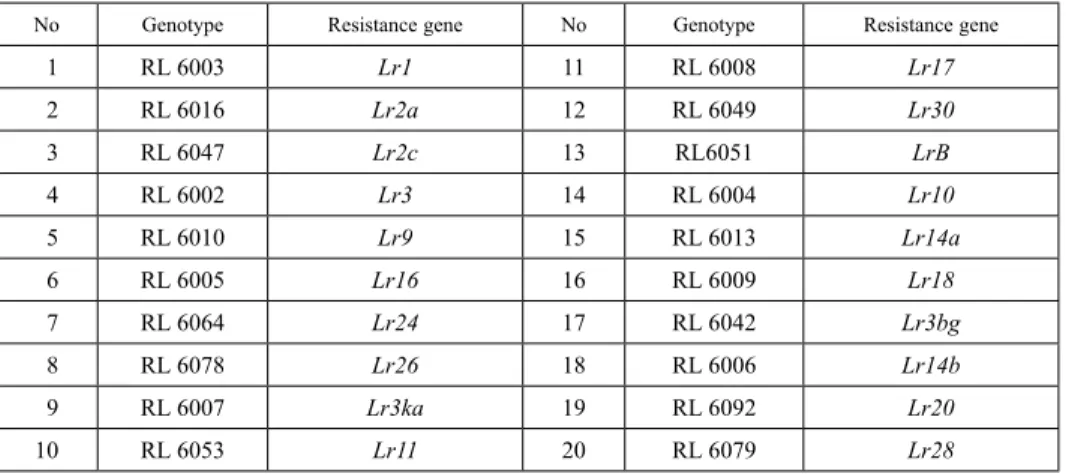
An international differential set composed of 20 genotypes with different leaf rust resistance genes was used to identify the virulent/avirulent pathogen race/races present (Table 1).
Table 1. Genotypes in international differential set and resistance genes
No Genotype Resistance gene No Genotype Resistance gene
1 RL 6003 Lr1 11 RL 6008 Lr17
2 RL 6016 Lr2a 12 RL 6049 Lr30
3 RL 6047 Lr2c 13 RL6051 LrB
4 RL 6002 Lr3 14 RL 6004 Lr10
5 RL 6010 Lr9 15 RL 6013 Lr14a
6 RL 6005 Lr16 16 RL 6009 Lr18
7 RL 6064 Lr24 17 RL 6042 Lr3bg
8 RL 6078 Lr26 18 RL 6006 Lr14b
9 RL 6007 Lr3ka 19 RL 6092 Lr20
Disease observations were initiated when the susceptible control cultivars Thatcher and Morocco reached to 80 S level and assessments were made 3 times in 10-day inter- vals. Disease intensity was recorded in accordance with Modified Cobb scale (Peterson et al. 1948). The infection type was also scored: R = resistant, very small uredia surrounded by necrotic tissues; MR = moderately resistant, small uredia surrounded by necrotic tissues; MS = moderately susceptible, moderate sized uredia without necrotic tissues;
S = susceptible, large uredia without necrotic tissues (Akin et al. 2008). The replication with the greatest score was taken as the basis of adult plant scores at each environment.
Then the entries were classified according to their coefficient of infection (CI) which is calculated by multiplying infection % with coefficient of reaction which were 1 for S, 0.8 for MS, 0.6 for MS/MR, 0.4 for MR, 0.2 for MR/MS and 0 for R (For example, the dis- ease score 50S becomes (CI); 50 = (50 × 1.0). CI are values; Immune (I): 0, Resistant (R):
0.1–5.0, Moderately Resistant (MR): 5.01–20.0, Moderately Susceptible (MS): 20.1–
40.0, Susceptible (S): 40.1–100).
The GGE-biplot technique (Yan and Falk 2002; Yan 2014) was used to establish a genotype-focused GGE-biplot graph to assess the reactions of the pure lines against the disease and to select resistant materials. The statistical theory of GGE biplot methodology was explained in detail by Yan (2014).
The GGE model used to determine the resistance of pure lines across environments was:
where
Yij = the mean value for pure line i in environment j ; μ = the grand mean of all pure line – year combinations; βj = the main effect of environment j; λ1 and λ2 are the singular val- ues of first and second largest principal components, PC1 and PC2, respectively; ξi1 and ξi2 are the eigenvectors of pure line i for PC1 and PC2, respectively; η1j and η2j are the eigenvectors of environment j for PC1 and PC2, respectively, and εij = the residue for each pure line-environment combination not explained by PC1 and PC2.
Genotype-focused GGE biplot graphs (Figs 1, 2 and 3) were created with GGE biplot technique (Yan and Falk 2002; Yan 2014).
Results Virulence of Lr genes
In the three growing seasons, the susceptible control cultivars Thatcher and Morocco were 80–100 S disease severity in all sites taken into account in assessments indicating good disease development and allowing satisfactory comparison of the materials tested.
The international differential set composed of 20 genotypes (Table 1) in 5 experimen- tal locations in 2011–2012 and 2012–2013 growing seasons indicated that the leaf rust population was virulent to Lr1, Lr2c, Lr3, Lr16, Lr26, Lr3ka, Lr17, Lr30, LrB, Lr10,
Yij− − =µ β λ ξ ηj 1 i1 1j+λ ξ η2 i2 2j+εij
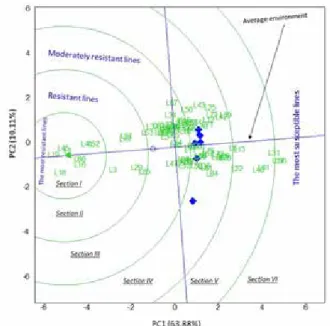
Figure 1. Polygon views of the GGE biplot based on leaf rust reactions symmetrical scaling for the which won where pattern of genotypes and environments
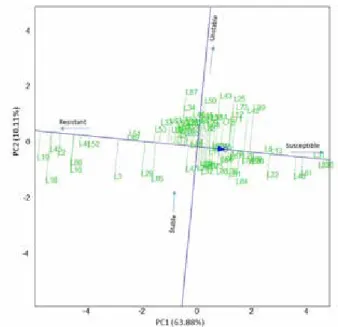
Figure 2. GGE-biplot based on genotype-focused scaling for comparison of the pure line with ideal genotypes
Lr14a, Lr18, Lr3bg, Lr14b, Lr20 and Lr28 resistance genes and avirulent to Lr2a, Lr9, Lr24 and Lr11 resistance genes.
On the other hand In 2 experimental environments in 2014 growing season, leaf rust disease population was virulent to Lr1, Lr2a, Lr2c, Lr3, Lr16, Lr26, Lr3ka, Lr17a, Lr30, LrB, Lr10, Lr14a, Lr18, Lr3bg, Lr14b, Lr20 and Lr28 resistance genes and avirulent to Lr9, Lr24 and Lr11 resistance genes.
Reactions of landraces
The leaf rust reaction data of the test entries in the seven environments are presented in Table S1*. Only 4–7 entries were identified as leaf rust resistant in the test environments.
In all locations, the greater variation was observed with the moderately resistant and susceptible groups (Table S1).
At Edirne location, four genotypes were placed in resistant reaction group in growing seasons of 2011–12 (L16, L18, L19 and L52) and 2012–13 (L2, L16, L18 and L19) while seven genotypes (L16, L18, L19, L45, L52, L86, L87) were rated as resistant in the 2013/2014 growing season.
In Çanakkale location, 7 genotypes (L2, L16, L18, L19, L45, L52, L86) were placed in the resistant group in the 2011–2012 growing season, while 5 genotypes were in the
*Further details about the Electronic Supplementary Material (ESM) can be found at the end of the article.
Figure 3. Average Environment Coordination (AEC) views of the GGE biplot based on environment focused scaling for the mean performance and stabilityof pure lines
resistant group in growing seasons of 2012–2013 (L2, L18, L19, L45 and l86) and 2013–
14 (L18, L19, L41, L45, L86) .
In Samsun location, where there was no disease development in the growing seasons of 2012–13 and 2013–14, 4 genotypes (L2, L41, L45 and L87) were placed in the resist- ant group in 2011–2012 growing season.
Variations across environments
In all locations, the group with the greatest variation in terms of resistance of genotypes was in the Moderate Resistance (MR) group (Table S1). The GGE biplot graph used to assess leaf rust explained 73.89% of total variation due to G + GE. The polygon or which- won-where form of the biplot was used to visualize the patterns in the data (Fig. 1). The polygon was divided into 11 sections with the lines drawn from the biplot origin. Con- trary to common assessment of GGE biplot analysis of grain yield data, the pure lines placed in IXth and Xth sections of the graph with low PC1 values were assessed as resist- ant, because a higher disease score means more susceptible. In these sections, L18 and L19 were the most resistant genotypes across the environments. The lines L84, L41, L61, L15, L76 and L31 in the second section were the most susceptible genotypes across the environments. The seven environments fell into two apparent groups.
The genotypes are ordered along the average environment axis (AEA) in the genotype- focused GGE biplot (Fig. 2). The most susceptible entries were placed on the far right and the most resistant ones on the far left along the AEA. Entries placed away from the AEA were less stable across environments. For instance, L43 and L87 were placed on the far- thest distance from the AEA. While they exhibited resistant reactions in some environ- ments (E3) and susceptible reactions in others (Fig. 2).
The Average Environment Coordination (AEC) view of the GGE biplot based on en- vironment focused scaling for the mean performance and stabilityof pure lines was used to identify the ideal genotypes with consistent resistance (Fig. 3). As was in the first two biplot graphs, low PC1 (negative values) values means better resistance to leaf rust. The concentric circles facilitate visualizing the resistance of the genotypes. The resistance decreased from the first circle through the last circle (Fig. 2). Accordingly, L19, L45 and L2 were identified as the most resistant genotypes, the L31 and L56 the most susceptible genotypes.
Discussion
Sufficient disease development occurred for assessing the leaf rust resistance of the tested materials in all experimental environments assessed in the study. The disease reactions of genotypes were similar in Edirne and Çanakkale locations of Thrace region in all 3 ex- perimental years. This was probably because the two locations are geographically close.
On the other hand, the reactions of the genotypes were quite different in Samsun location, which is far from Edirne and Çanakkale.
GGE biplot analysis is an effective method for visual analysis of data from multi-envi- ronment experiments. The Average environment axis in the GGE biplot presented in Figs 2 and 3 allowed a general assessment of resistance or susceptibility of the genotypes as suggested by Sandhu et al. 2015. While the genotypes placed on the left side of the line vertically transecting this axis presented a resistant reaction, the ones placed on the right side of this line exhibited susceptible reaction in majority of environments. Stability of disease reactions were assessed through the distance of pure lines from the average envi- ronment axis. The genotypes placed closest to average environment axis (AEA) were stable in reaction to the disease, either stable resistant or stable susceptible reaction. The genotypes with the same or similar disease reactions across the 7 experimental environ- ments were placed close to the axis and the genotypes with different reactions in different environments were placed relatively away from the axis. For instance, L19 was placed in the resistant group across all environments while L6 was placed in the susceptible group across all environments (Fig. 2).
The disease reaction experiments carried out in different environments or locations in cereals are evaluated separately in each environment. In this study, the disease reactions obtained from the leaf rust reaction experiments conducted in different environments were examined together with the GGE biplot analysis method. This method is a very ad- vantageous method according to the classical evaluation method. Resistance or suscepti- ble genotypes can be easily grouped by GGE biplot method with genotypes with different disease reactions in different environments. The GGE biplot methodology has also been used to study the stability of disease reactions through multi-location trials, to character- ize and identify germplasm, segregations, or breeding lines, and cultivars resistant to diseases such as net blotch (caused by Pyrenophora teres Drechs) in barley (Yan and Falk 2002), spot blotch disease (caused by Cochliobolus sativus) in wheat (Joshi et al. 2007), fusarium head blight and powdery mildew in wheat (Kadariya et al. 2008 Lillemo et al.
2010), ascochyta blight in faba bean (Rubiales et al. 2012), fusarium wilt and ascochyta blight in chickpea (Pande et al. 2013), and fusarium wilt in pigeon pea (Sharma et al.
2016).
This function of GGE biplot was used in visual assessment of different disease reac- tions of different plants such as assessment of host x pathogen interaction for white rust (caused by Albugo candida Pers.) disease in Brassica (Sandhu et al. 2015), assessment of reactions of barley genotypes to different isolate groups of net blotch (caused by Pyre- nophora teres Drechs.) disease (Yan and Falk 2002).
In conclusion, GGE biplot analysis allowed efficient assessment of the resistance of wheat genotypes to leaf rust disease across environments. The method both allowed iden- tification of ideal genotypes and grouping of the experimental environments. Leaf rust reactions of genotypes in 6 environments located in Thrace region (E1, E2, E4, E5, E6, E7) were similar, but one environment (E3) located in Mid Black Sea regions was differ- ent from the others. The genotypes L19, L45 and L2 were identified as the most stably resistant genotypes which can be used in wheat breeding programmes to improve leaf rust resistance of varieties in the mentioned environments.
Acknowledgments
This research was funded by the Scientific and Technological Research Council of Turkey (TUBITAK, project number 111O255). The authors thank TUBITAK for their financial support.
References
Akcura, M., Kokten, K. 2017. Variations in grain mineral concentrations of Turkish wheat landraces germ- plasm. Quality Assurance and Safety of Crops and Foods 9:153–159
Akin, B., Zencirci, N., Özseven, I. 2008. Field resistance of wheat (Triticum aestivum L.) genotypes from dif- ferent countries to leaf rust (Puccinia triticina). Turkish J. of Agric. and Forestry 32:479–486.
Arslan, Ü., Yağdı, K., Aydoğan, E. 2002. Bursa İli Ekolojik Koşullarında Buğday Kahverengi Pası (Puccinia recondita Roberge ex Desmaz. f.sp. tritici)’na Karşı Bazı Ekmeklik Buğdayların Reaksiyonları ve Verim Kayıplarının Belirlenmesi (Determination of some bread wheat reactions and yield losses against wheat brown rust (Puccinia recondita Roberge ex Desmaz. f.sp. tritici) in Bursa ecological conditions). Uludağ Üniversitesi Ziraat Fakültesi Dergisi (J. of Agric. Faculty of Uludag Univ,) 16:201–210. (In Turkish) Bilgic, H., Hakki, E.E., Pandey, A., Khan, M.K., Akkaya, M.S. 2016. Ancient DNA from 8400 year-old
Çatalhöyük wheat: Implications for the origin of Neolithic agriculture. PloS One 11:e0151974.
Joshi, A.K., Ortiz-Ferrara, G., Crossa, J., Singh. G., Alvarado, G., Bhatta, M.R., Bhatta, E., Duveiller, R.C., Sharma, D.B., Pandit, A.B., Siddique, S.Y., Das, R., Sharma, N., Chand, R. 2007. Associations of environ- ments in South Asia based on spot blotch disease of wheat caused by Cochliobolus sativus. Crop Sci.
47:1071–1081.
Kadariya, M., Glover, K.D., Mergoum, M., Osborne, L.E. 2008. Biplot analysis of agronomic and Fusarium head blight resistance traits in spring wheat. J. of Crop Improvement 22:147–170.
Kınacı, E. 1982. An investigation of a source of resistance to wheat leaf rust (P. recondita) in a cross of KR/
TM//?/3/5CMN and of changes for increased virulence in race 6B, M.S. thesis. Oklahoma State University.
Stillwater, Oklahoma, USA. 24 p.
Kolmer, J.A., Jin, Y., Long, D. L. 2007. Wheat leaf and stem rust in the United States. Crop and Pasture Sci. 58:631–638.
Lillemo, M., Singh, R.P., Ginkel, M.V. 2010. Identification of stable resistance to powdery mildew in wheat based on parametric and non-parametric methods. Crop Sci. 50:478–485
Ma, H., Singh R.P., Mujeeb-Kazi, A. 1995. Resistance to stripe rust in Triticum turgidum, T. tauschii and their synthetic hexaploids. Euphytica 82:117–124.
McIntosh, R.A., Yamakazi, Y., Dubcovsky, J., Rogers, J., Morris, C., Somers, D.J., Appels, R., Devos, K.M.
2012. Catalogue of gene symbols for wheat. http://www.shigen.nig.ac.jp/wheat/komugi/genes/download.
jsp Accessed: December 2016.
Morgounov, A., Keser, M., Kan, M., Küçükçongar, M., Özdemir, F., Gummadov, N., Muminjanovd H., Zueve, E., Qualset, C.O. 2016. Wheat landraces currently grown in Turkey: distribution, diversity, and use. Crop Sci. 56:3112–3124.
Pande, S., Sharma, M., Gaur, P.M., Basandrai, A.K., Kaur, L., Hooda, K.S., Basandrai, D., Kiran, T., Babu, S., Jain, K., Rathore, A. 2013. Biplot analysis of genotype × environment interactions and identification of stable sources of resistance to Ascochyta blight in chickpea (Cicer arietinum L.). Austr. Plant Pathol.
42:561–571.
Peterson, R.F., Campbell, A.B., Hannah, A.E. 1948. A diagrammatic scale for estimating rust intensity on leaves and stems of cereals. Can. J. of Res. 26:(Section C):496–500.
Rubiales, D., Avila, C.M., Sillero, J.C., Hybl, M., Narits, L., Sass, O., Flores, F. 2012. Identification and multi- environment validation of resistance to Ascochyta fabae in faba bean (Vicia faba). Field Crops Res.
126:165–170.
Sandhu, P.S., Brar, K.S., Chauhan, J.S., Meena, P.D., Awasthi, R.P., Rathi, A.S., Manhas, S.S. 2015. Host–
pathogen interactions of Brassica genotypes for white rust (Albugo candida) disease severity under aided epiphytotic conditions in India. Phytoparasitica 43:197–207.
Sayre, K.D., Singh, R.P., Huerta-Espino, J., Rajaram, S. 1998. Genetic progress in reducing losses to leaf rust in CIMMYT derived Mexican spring wheat cultivars. Crop Sci. 38:654–659.
Sehgal, D., Dreisigacker, S., Belen, S., Küçüközdemir, Ü., Mert, Z., Özer, E., Morgounov, A. 2016. Mining centuries old in situ conserved Turkish wheat landraces for grain yield and stripe rust resistance genes. Frontiers in Genet. 7:1–15.
Sharma, M., Ghosh, R., Telangre, R., Rathore, A., Saifulla, M., Mahalinga, D.M., Jain, Y.K. 2016.
Environmental influences on pigeon pea-Fusarium udum interactions and stability of genotypes to Fusarium wilt. Frontiers in Plant Sci. 7:1–10.
Yan, W., Hunt, L. A., Sheng, Q., Szlavnics, Z. 2000. Cultivar evaluation and mega-environment investigation based on the GGE biplot. Crop Sci. 40:597–605.
Yan, W., Falk, D.E. 2002. Biplot analysis of host-by-pathogen data. Plant Disease 86:1396–1401.
Yan, W. 2014. Crop variety trials: Data management and analysis. John Wiley and Sons. 349 p. DOI:
10.1002/9781118688571
Electronic Supplementary Material (ESM)
Electronic Supplementary Material (ESM) associated with this article can be found at the website of CRC at http://www.akademiai.com/content/120427/
Electronic Supplementary Table S1. Leaf rust reactions of landraces in different environments