Genotype by Yield*Trait Biplot for Genotype Evaluation and Trait Profiles in Durum Wheat
R. Mohammadi*
Dryland Agricultural Research Institute, Sararood Branch, AREEO, Kermanshah, Iran (Received January 15 2019; Accepted 30 May 2019;
Communicated by T. Harangozó)
Genotype selection based on multiple traits in multi-years is frequently influenced by unpredictable rainfed conditions. The main objective of the study was to apply the new methodology of genotype by yield*trait (GYT) biplot for genotype selection and trait pro- files in durum wheat genotypes based on multi-traits and multi-year data under rainfed conditions of Iran. A superiority index was applied based on GYT table for ranking of geno- types by the mean of all traits. The GYT biplot ranked the genotypes based on their levels in combining yield with other key traits. Grain yield was combined with target traits and showed the strengths and weaknesses of each genotype. Based on GYT-biplots the relation- ships among the studied traits were not repeatable across years, but they facilitated visual genotype comparisons and selection. The breeding lines G13, G10 and G15 ranked as the best in combination of the morph-physiological traits i.e., SPAD-reading, early heading, flag-leaf length and number of grain per spike with grain yield under rainfed conditions. The results indicate that there is a potential for simultaneous improvement of some characteris- tics of durum wheat under rainfed conditions. The GYT biplot was a useful tool for exploring the combination of yield with traits and trait profiles of the durum genotypes to obtain high genetic gains in the durum breeding programs.
Keywords: durum wheat, genotype by yield*trait biplot, multi-traits, superiority index, rainfed condition
Introduction
Durum wheat (Triticum turgidum L. spp. Durum) is a global crop that is cultivated about 30–35 million hectares, especially in the Mediterranean condition, where it represents a staple crop (Guzmán et al. 2016). Durum wheat is mainly used for industrial transforma- tion to pasta, couscous, and bourghul, foods of the Mediterranean tradition. The develop- ment and expansion of high yielding durum genotypes for Mediterranean rainfed areas, is considered difficult due to high GE interaction (Mohammadi et al. 2014; González-Ribot et al. 2017; Bassi and Sanchez-Garcia 2017). Breeding based on multiple traits increases the value of crop cultivars to growers. However, breeding programs are used to identify superior genotypes for various economic traits (Baker 1986). Nevertheless, one of the main problems facing wheat breeders is the negative correlation between breeding objec-
*Corresponding author; Email: r.mohammadi@areeo.ac.ir
tives. To overcome this difficulty, it is necessary to achieve promising genotypes (Yan 2014). The challenge due to the fact that target traits are usually associated undesirably is that improvement in a breeding objective often leads to a decrease in level in one or more attributes (Yan and Wallace 1995; Lewis 2006; Yan and Frégeau-Reid 2018). However, attention should be paid to unfavorable associations among target traits when performing independent culling, because selecting for the desired levels or removing the unfavorable levels of an attribute can be chosen against the desired level of another attribute, which can lead to the loss of useful materials or even render useless selection (Yan and Rajcan 2002).
A genotype by yield*trait (GYT) biplot approach recently proposed by Yan and Frégeau-Reid (2018) provides useful information for genotype evaluation on multiple traits. This methodology uses GGE (G plus GE) biplot analysis to verify genotypes per- formance and to identify strengths and weaknesses of each genotype. This approach also provides a superiority index (SI) which allows evaluating genotypes in relation to multi- traits. The SI ranks genotypes by the mean of all traits.
The breeder has the responsibility for identifying if a trait is positively or negatively associated with grain yield, i.e., identify if grain yield should be multiplied or be divided by a specific trait. From this, indices are generated by multiplying the grain yield by the magnitudes of traits in question (positive selection) or by dividing the magnitude of traits by the grain yield (negative selection). However, the release of high-yielding genotypes with good agronomic characteristics and adaptation to drought-prone environments could allow the expansion of durum wheat cultivation in Iran.
The objectives of this paper were to assess genotypes and trait profiles of durum wheat materials using GYT biplot and to identify which traits are associated with grain yield in durum wheat breeding material.
Materials and methods
The experiments were conducted under rainfed conditions at Sararood Dryland Agricul- tural Research Station (Kermanshah, Iran, 34°19′N; 47°17′E; 1351 m a.s.l.) that repre- sented for crop breeding under moderate cold conditions. The station placed in western Iran with a minimum temperature of –15 °C and maximum temperature of 45 °C, with number of days below zero between 60 to 100 days, and average annual precipitation about 425 mm. The soil in the station is clay loam.
Seventeen wheat genotypes consisting of one modern durum cultivar (G1), one old durum variety (G2), one old bread wheat variety (G3) and 14 promising durum breeding lines (G4-G17), selected based on agronomic performance, from the national durum wheat breeding program of Iran, were evaluated under rainfed conditions across three cropping seasons (2011–2014). The trials were conducted in a randomized complete block design with three replications. The sowing density was 400 seeds m–2. Plot size was 7.2 m2 (6 rows, 6 m long and 20 cm row spacing). Fertilizer rate was 50 kg N ha–1 and 50 kg P2O5 ha–1 applied at planting.
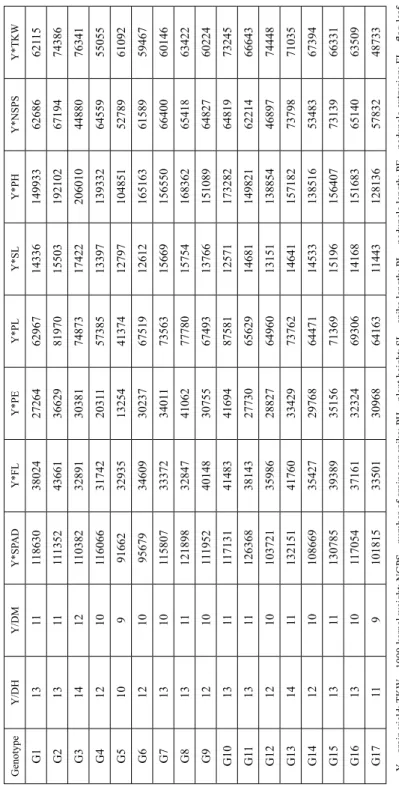
Table 1. Genotype by yield*trait (GYT) data for 17 wheat genotypes across three years GenotypeY/DHY/DMY*SPADY*FLY*PEY*PLY*SLY*PHY*NSPSY*TKW G11311118630380242726462967143361499336268662115 G21311111352436613662981970155031921026719474386 G31412110382328913038174873174222060104488076341 G41210116066317422031157385133971393326455955055 G510991662329351325441374127971048515278961092 G6121095679346093023767519126121651636158959467 G71310115807333723401173563156691565506640060146 G81311121898328474106277780157541683626541863422 G91210111952401483075567493137661510896482760224 G101311117131414834169487581125711732826481973245 G111311126368381432773065629146811498216221466643 G121210103721359862882764960131511388544689774448 G131411132151417603342973762146411571827379871035 G141210108669354272976864471145331385165348367394 G151311130785393893515671369151961564077313966331 G161310117054371613232469306141681516836514063509 G17119101815335013096864163114431281365783248733 Y – grain yield; TKW – 1000-kernel weight; NGPS – number of grains per spike; PH – plant height; SL – spike length; PL – peduncle length; PE – peduncle extrusion; FL – flag-lea length; SPAD – Chlorophyll content or SPAD-reading; DH – days to heading; DM – days to maturity.
Several key traits under rainfed conditions were recorded for each genotype in each plot. Heading date (DH) was recorded when about 50% of heads emerged fully. Days to maturity (DM) recorded when about 50% of the plants in a plot had yellow leaves. Other traits included plant height (PH) (cm; from soil surface to tip of spike, excluding awns), peduncle length (PL), peduncle extrusion (PE), flag-leaf length (FL), spike length (SL) and number of grain per spike (NGPS) were measured based on five random samples for each genotype at physiological maturity. The SPAD reading was measured for three flag leaves of each genotype in each plot by the SPAD chlorophyll meter (Minolta Co. Ltd., Tokyo, Japan). After harvest, the 1000-kernel weight (TKW) was recorded based on weight of 1000 grains for each genotype in each plot. The plot yields were converted to productivity per hectare (kg ha–1) and subjected to statistical analyses.
The GYT table was generated by the combination of each trait and grain yield (Table 1) as developed by Yan and Frégeau-Reid (2018). The methodology indicates that each trait should be multiplied or divided by grain yield according to the breeding objec- tives. The GYT table was obtained as follows: For plant height, SPAD-reading, 1000-ker- nel weight, number of grains per spike, peduncle length, peduncle extrusion, spike length and flag-leaf length, the values for each trait was multiplied (*) with the yield (e.g., Y*SPAD). While for traits of days to heading and days to maturity, which the high value is undesirable, the value for each trait was divided (/) by the yield (e.g., Y/DH). By this method, in the GYT table a larger value is always more desirable.
Thus, the GYT biplot methodology was applied for multi-traits data of genotypes in single and multi-year trials. A superiority index (SI) integrating all yield-trait combina- tions was also calculated based on the standardized GYT (Yan and Frégeau-Reid 2018).
Biplot analyses were performed for all evaluated traits of genotypes using GEA-R package (Pacheco et al. 2016) in R software (http://www.R-project.org).
Results Weather conditions and genotype yields
The amount and distribution of rainfall differed from year to year, resulting in contrasting growing conditions with wide range of yield potentialities under rainfed conditions. Rain- fall ranged between 302.9 to 401.3 mm among years with different monthly distribution in which that the genotypes experienced different levels of drought stress (from severe to mild). Genotypes differed for grain yield and other studied traits (P < 0.01) across years, showing high genotypes rank changes across years. The mean yields of genotypes varied between 898 kg/ha2 (corresponding to severe condition) to 3791 kg/ha2 (corresponding to favorable condition).
Trait profiles of the genotypes
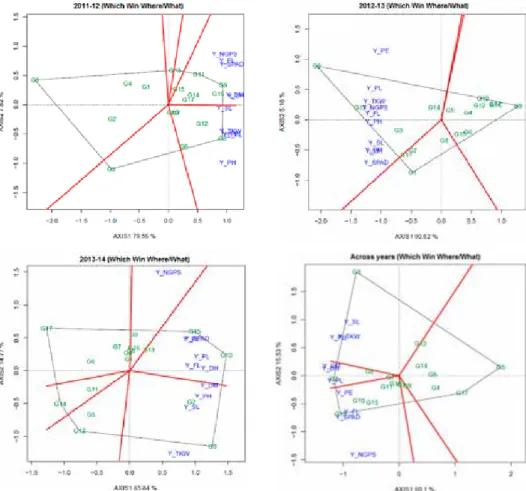
Figure 1 represents polygon view of a genotype by yield*trait (GYT) biplot generated from combination of yield with 10 traits data of 17 genotypes in single and multi-years
data. The GYT biplots accounted for 75.63 to 95.78% of the total variation of the stand- ardized data. In 2011–2012, breeding line G8 followed by G12 had the highest values for Y*TKW, Y*PH, Y*SL, Y*PE and Y*PL, meaning that these genotypes were the best in combining grain yield with 1000-kernel weight, plant height, spike length, peduncle ex- trusion and peduncle length. Similarly, breeding line G9 had the highest levels of Y*NGPS, Y*FL, Y/DH, Y*SPAD, and Y/DM, meaning that this breeding line was the best in combining grain yield with number of grain per spike, early maturity, flag-leaf length, and SPAD-reading. From Fig. 1 it is also apparent that breeding line G8 had a contrasting trait profile to that of G5. In 2012–2013 the genotype G2 followed by G13 was the best in combining grain yield with all studied traits.
In 2013–2014 (Fig. 1) breeding line G3 had the largest values for Y*TKW, Y*SL, Y*PH and Y/DM, indicating that this genotype had the best combination of yield with
Figure 1. The which-won-where view of the genotype by yield*trait (GYT) biplot to highlight genotypes with outstanding profiles based on single and multi-years data
1000-kernel weight, spike length, plant height and days to maturity, while breeding line G10 followed by G15 were the best in combining grain yield with early heading, pedun- cle length, flag-leaf length, peduncle length, peduncle extrusion and SPAD-reading.
Breeding line G9 with the large value of Y*NGPS was the best in combining grain yield with number of grain per spike. Based on multi-year GYT biplot analysis (Fig. 1), breed- ing line G3 with largest values of Y*SL, Y*PH and Y*TKW was the best in combining grain yield with spike length, plant height and 1000-kernel weight. Breeding line G13 was the best in combining grain yield with the SPAD-reading, flag-leaf length, peduncle extrusion and number of grain per spike. Breeding line G2 with highest value of Y/DH, Y/DM and Y*PL was the best in combining grain yield with early heading and maturity and peduncle length.
Relationships among yield-trait combinations
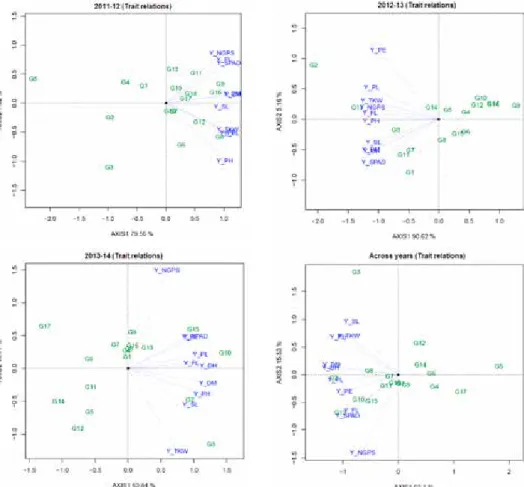
In GYT biplot, all yield-trait combinations tend to have a positive correlation with each other, as indicated by the acute angles between their vectors (Fig. 2). This is one of the important features of GYT biplot, compared to GT biplot (Yan and Frégeau-Reid 2018);
this allows genotypes to be ranked graphically and meaningfully based on their yield-trait combinations. The most prominent associations among traits in 2011–2012 were: be- tween Y*FL, Y*NGPS and Y*SPAD-reading; between Y*TKW, Y*PL, Y*PE and Y*PH;
and between Y*SL, Y/DH and Y/DM, as indicated by the acute angles between their vec- tors (Fig. 2).
In 2012–2013, high correlations were observed between Y*SL, Y*SPAD, Y/DH and Y/DM, showing that the combination of the traits SL, SPAD-reading, DH and DM will be suitable to enhance productivity in some genotypes (i.e., G1). In contrast, the strong cor- relations between Y*PH, Y*FL, Y*TKW, Y*NGPS and Y*PL, indicating high suitability of combination of PH, SL, TKW and NGPS with grain yield for improving productivity of some well performed genotypes (i.e., G2).
In 2013–2014 most prominent correlations were: positive correlations between Y*PE, Y*SPAD, Y*PL, Y*FL and Y/DH; and between Y*SL, Y/DM and Y*PH, as indicated by the acute angles between their vectors (Fig. 2). No correlation was observed between Y*NGPS and Y*TKW. Relationships among combination of traits with yield in three years were not similar, which suggested that there was differential response of genotypes to the three growing conditions.
Based on multi-year GYT biplot, Y*SPAD-reading was highly correlated with Y*FL, and Y*NGPS, showing the importance of these traits in combination with grain yield to enhance productivity under rainfed conditions for some suitable genotypes including G13, G10 and G15. In contrast, high strong correlations were observed between Y*TKW, Y*PH and Y*SL, showing the suitability of these combinations for more productivity under rainfed condition. The genotype G3 had a good trait profile according to these combinations and an extreme trait profile to that of G13, although both genotypes had good levels of yield.
One of the important advantages of GYT biplot is that it can be used to identify exces- sive features to reduce costs in measuring traits in field experiments without compromis- ing accuracy. Thus, strong positive relationship between TKW, SL and PH indicates that one (i.e., TKW) of these attributes should be sufficient for selection criterion. Similarly, the strong correlation between SPAD, FL, DH, DM, PL and PE indicates that one (i.e, DH) of these traits is a suitable selection criterion.
Superiority vs. “weaknesses and strengths” of genotypes
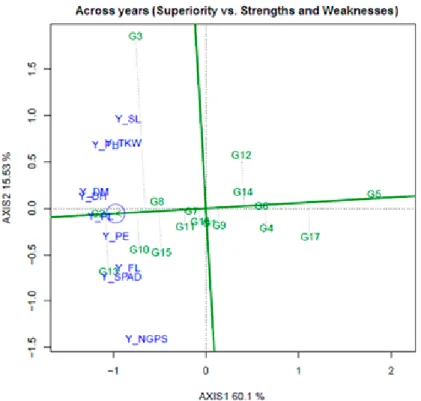
The best ranked genotypes based on the yield-trait combinations were: G2 > G13 >
G10 > G8 > G15 (Fig. 3). In contrast, G5, G17, G4 and G6 were ranked the poorest. Fig.
3 also shows the trait profiles of the genotypes. Genotypes G2, G8 and G7 were balanced for various traits; while G3 was strong in PH, TKW and SL in combination with yield but
Figure 2. The vector view of the genotype by yield*trait (GYT) biplot to show associations among the yield- trait combinations based on single and multi-years data
low in SPAD, FL and NGPS; and G13, G10 and G15 were strong in NGPS, SPAD and FL in combination with yield but low in SL, TKW and PH.
The genotypes placed below the average tester coordinate (ATC) tended to have rela- tively good levels of SPAD, FL, NGPS and PE but relatively low levels of SL, PH and TKW, and/or early heading and maturity. The opposite is true for genotypes (i.e., G3) placed above the ATC. The weakness and strength of each genotype are presented in Table 2. The best genotypes were G2 and G13 that present the highest mean values. Of these, G13 had not negative values for any trait, indicating that this genotype had the best characteristics; while G2 had negative values for SPAD, indicating that this genotype had low value for SPAD-reading.
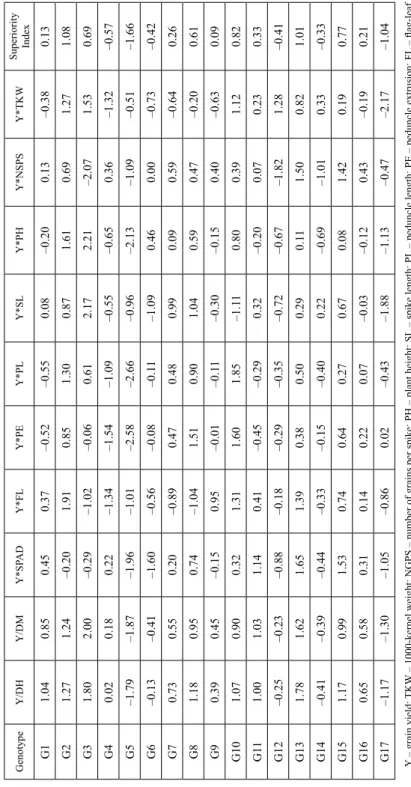
The superiority index (SI) ranks genotypes by mean of all traits, where high values of SI indicate the best genotypes. According to Fig. 3 the best grain yield was verified to genotypes G2, G13, G8, G10 and G15, while the worst genotypes were G5 and G17 (Table 2). Genotype G9 had a SI near to zero (0.09), indicating that this genotype had intermediate values. Old genotypes had positive SI, e.g., G2 and G3, and the some breed- ing lines presented negative values for SI, e.g., G5 and G17.
Figure 3. The ATC view of the genotype by yield*trait (GYT) biplot to rank the genotypes based on their overall superiority and their strengths and weaknesses across years
Table 2. Standardized genotype by yield*trait (GYT) data and superiority index for 17 wheat genotypes across three years GenotypeY/DHY/DMY*SPADY*FLY*PEY*PLY*SLY*PHY*NSPSY*TKWSuperiority Index G11.040.850.450.37–0.52–0.550.08–0.200.13–0.380.13 G21.271.24–0.201.910.851.300.871.610.691.271.08 G31.802.00–0.29–1.02–0.060.612.172.21–2.071.530.69 G40.020.180.22–1.34–1.54–1.09–0.55–0.650.36–1.32–0.57 G5–1.79–1.87–1.96–1.01–2.58–2.66–0.96–2.13–1.09–0.51–1.66 G6–0.13–0.41–1.60–0.56–0.08–0.11–1.090.460.00–0.73–0.42 G70.730.550.20–0.890.470.480.990.090.59–0.640.26 G81.180.950.74–1.041.510.901.040.590.47–0.200.61 G90.390.45–0.150.95–0.01–0.11–0.30–0.150.40–0.630.09 G101.070.900.321.311.601.85–1.110.800.391.120.82 G111.001.031.140.41–0.45–0.290.32–0.200.070.230.33 G12–0.25–0.23–0.88–0.18–0.29–0.35–0.72–0.67–1.821.28–0.41 G131.781.621.651.390.380.500.290.111.500.821.01 G14–0.41–0.39–0.44–0.33–0.15–0.400.22–0.69–1.010.33–0.33 G151.170.991.530.740.640.270.670.081.420.190.77 G160.650.580.310.140.220.07–0.03–0.120.43–0.190.21 G17–1.17–1.30–1.05–0.860.02–0.43–1.88–1.13–0.47–2.17–1.04 Y – grain yield; TKW – 1000-kernel weight; NGPS – number of grains per spike; PH – plant height; SL – spike length; PL – peduncle length; PE – peduncle extrusion; FL – flag-lea length; SPAD – Chlorophyll content or SPAD-reading; DH – days to heading; DM – days to maturity.
Discussion
The results showed that the genotypes significantly influenced by year effects for grain yield and other studied traits resulting in considerable variation in agronomic perfor- mance under rainfed conditions, that could be exploited for improving drought adaptation in durum wheat. Under the Mediterranean climate, selection of genotype is improved by selecting the characteristics associated with yield under drought stress with higher herit- ability than gain yield (Quarrie et al. 1999; Rubio et al. 2004; McIntyre et al. 2010;
Mohammadi and Amri 2013). However, depending on target environments, many traits need to be increased such as 1000-kernel weight (TKW), chlorophyll content (SPAD), and others need to be reduced, e.g., heading date, lodging and diseases. A third group of traits need be in moderate level, not very high nor very low, e.g., plant height.
The methodology of GYT allows breeders to establish an interaction between grain yield and each trait, since genotypes are desirable only when presenting high grain yield.
Thus, the selection for GYT help breeders to evaluate genotype evaluation, traits profile of genotypes, and identify superior genotypes using the superiority index. The genotypes G2, G13, G8, G10, G15 may be considered as the best genotypes, each with specific positive Y*traits associations. On the other hand, G5 and G17 were the worst genotypes in GYT biplot (Fig. 1 and Table 2). The breeding line G9 was an “average genotype”, between the best and worst genotypes, with a SI value near to zero. Genotypes G2 and G8 were the best with balanced profiles and hence they can be classified as suitable geno- types in western Iran and similar regions. The genotype G3 was good in combining yield with PH, TKW and SL, though poor in number of grains per spike, SPAD-reading and flag-leaf length. It can be recommended for use as milling bread for environments where lodging is less a problem. Our previous records proved this genotype is susceptible to leaf rust and lodging under favorable environments, while the breeding lines G13, G10 and G15 were resistant to lodging and leaf rust. Thus, these genotypes can be considered for growing in environments where lodging going to be problem.
In conclusion, the GYT biplot applied in this study offers a new approach to genotyp- ing based on multiple traits. This approach is comprehensive and effective since geno- types are ranked based on their level in combination yield with different traits, and simul- taneously showing the strengths and weaknesses of the genotypes. The results also showed that it is possible to determine the contrasting genotypes based on the attribute(s) for improving genetic material in durum wheat breeding programs. The breeding lines G13, G10 and G15 ranked as the best in combination of some agro-physiological charac- teristics with grain yield under rainfed conditions, indicates genetic gain in durum breed- ing program under rainfed conditions of Iran. The study also verified that there is a poten- tial for simultaneous genetic improvement of the same characteristics (i.e., SPAD-read- ing, NGSP, TKW, early heading) in durum wheat.
References
Baker, R. 1986. Selection Indices in Plant Breeding; CRC Press: Boca Raton, FL, USA.
Bassi, F.M., Sanchez-Garcia, M. 2017. Adaptation and stability analysis of ICARDA durum wheat elites across 18 Countries. Crop Sci. 57:2419–2430.
González-Ribot, G., Opazo, M., Silva, P., Acevedo, A. 2017. Traits Explaining Durum Wheat (Triticum turgi- dum L. spp. Durum) Yield in Dry Chilean Mediterranean Environments. Front. Plant Sci. 8:1781, 1–11.
Guzman, C., Autrique, J.E., Mondal, S., Singh, R.P., Govindan, V., Morales-Dorantes, A., Romano, G.P., Crossa, J., Ammar, K., Pena, R.J. 2016. Response to drought and heat stress on wheat quality, with special emphasis on bread-making quality, in durum wheat. Field Crops Res. 186:157–165.
Lewis, R.S. 2006. Identification of germplasm of possible value for confronting an unfavorable inverse genetic correlation in tobacco. Crop Sci. 46:1764–1771.
McIntyre, C.L., Mathews, K.L., Rattey, A., Chapman, S.C., Drenth, J., Ghaderi, M. 2010. Molecular detection of genomic regions associated with grain yield and yield-related components in an elite bread wheat cross evaluated under irrigated and rainfed conditions. Theor. Appl. Genet. 120:527–541.
Mohammadi, R., Amri, A. 2013. Phenotypic diversity and relationships among a worldwide durum wheat (Triticum turgidum L. var. durum) germplasm collection under rainfed conditions of Iran. Crop and Pasture Science 64:87–99.
Mohammadi, R., Haghparast, R., Sadeghzadeh, B., Ahmadi, H., Solimani, K., Amri, A. 2014. Adaptation pat- terns and yield stability of durum wheat landraces to highland cold rainfed areas of Iran. Crop Sci. 54:944–
Pacheco, A., Vargas, M., Alvarado, G., Rodríguez, F., Crossa, J., Burgueño, J. 2016. GEA-R (genotype × envi-954.
ronment analysis with R for Windows). Version 2.0. CIMMYT. http://hdl.handle.net/11529/10203 (accessed 20 June 2016).
Quarrie, S.A., Stojanović, J, Pekić, S. 1999. Improving drought resistance in small-grained cereals: a case study, progress and prospects. Plant Growth Regul. 29:1–21.
Rubio, J., Cubero, J.I., Martin, L.M., Suso, M.J., Flores, F. 2004. Biplot analysis of trait relations of white lupin in Spain. Euphytica 135:217–224.
Yan, W. 2014. Crop variety trials: Data management and analysis. John Wiley & Sons. 360 pp.
Yan, W., Frégeau-Reid, J. 2018. Genotype by Yield*Trait (GYT) Biplot: a Novel 416 Approach for Genotype Selection based on Multiple Traits. Sci. Rep. 8:1–10.
Yan, W., Rajcan, I.R. 2002. Biplot analysis of test sites and trait relations of soybean in Ontario. Can. J. Plant Sci. 42:11–20.
Yan, W., Wallace, D.H. 1995. Breeding for negatively associated traits. Plant Breed. Rev. 13:141–177.