Trait convergence and trait
divergence in lake phytoplankton reflect community assembly rules
Gábor Borics
1, Viktória B‑Béres
1, István Bácsi
3, Balázs A. Lukács
2, E. T‑Krasznai
1, Zoltán Botta‑Dukát
4& Gábor Várbíró
1*Environmental filtering and limiting similarity are those locally acting processes that influence community structure. These mechanisms acting on the traits of species result in trait convergence or divergence within the communities. The role of these processes might change along environmental gradients, and it has been conceptualised in the stress‑dominance hypothesis, which predicts that the relative importance of environmental filtering increases and competition decreases with increasing environmental stress. Analysing trait convergence and divergence in lake phytoplankton assemblages, we studied how the concepts of ‘limiting similarity’ versus ‘environmental filtering’ can be applied to these microscopic aquatic communities, and how they support or contradict the stress‑
dominance hypothesis. Using a null model approach, we investigated the divergence and convergence of phytoplankton traits along environmental gradients represented by canonical axes of an RDA.
We used Rao’s quadratic entropy as a measure of functional diversity and calculated effect size (ES) values for each sample. Negative ES values refer to trait convergence, i.e., to the higher probability of the environmental filtering in community assembly, while positive values indicate trait divergence, stressing the importance of limiting similarity (niche partitioning), that is, the competition between the phytoplankters. Our results revealed that limiting similarity and environmental filtering may operate simultaneously in phytoplankton communities, but these assembly mechanisms influenced the distribution of phytoplankton traits differently, and the effects show considerable changes along with the studied scales. Studying the changes of ES values along with the various scales, our results partly supported the stress‑dominance hypothesis, which predicts that the relative importance of environmental filtering increases and competition decreases with increasing environmental stress.
One of the main aims of community ecology is to find general rules of species coexistence. These rules help to understand how communities can behave under various environmental scenarios1. To accomplish this aim we must study the processes that shape species composition and abundances. The coexistence of species in a given site is usually controlled by abiotic and biotic filters, which admit or exclude species from an available pool.
Recently, there is a growing consensus that these filters operate on the traits of species, rather than on species themselves2,3. Generally, two distinct non-random processes of species sorting exist: habitat filtering and limit- ing similarity. These non-random processes are thought to shape the mean, spread, and spacing of functional trait values differently within communities. On one hand, a specific trait combination will promote species (or specimen) success in a given environment. In this way, the environment filters out species (or individuals) that do not have the proper traits or trait combinations4. Such filtering leads to a converged trait distribution among the coexisting species within the communities (i.e. species become more similar than expected under random assembly5,6, albeit detection of this process depends largely on the studied traits and trait metrics. On the other hand, the ‘limiting similarity’ (or niche differentiation) concept7,8 states that competition for resources results in trait divergence, which encourages a stable coexistence between community members9. In other words, when two species show differences in their niches, they tend to compete less strongly. Such contests between species lead to divergent trait distribution (i.e., co-occurring species become more different in traits than expected by random selection from the species pool) within the communities. Several tools were developed and applied in
OPEN
1Department of Tisza Research, Danube Research Institute, Centre for Ecological Research, 18/c. Bem square, 4026 Debrecen, Hungary. 2Wetland Ecology Research Group, Danube Research Institute, Centre for Ecological Research, 18/c. Bem square, 4026 Debrecen, Hungary. 3Department of Hydrobiology, University of Debrecen, P.O. Box 57, 4010 Debrecen, Hungary. 4Institute of Ecology and Botany, Centre for Ecological Research, 2-4. Alkotmány Str., 2163 Vácrátót, Hungary.*email: varbirog@gmail.com
the ecology to study the importance of assembly rules in recent years. These approaches, such as guild propor- tionality and limiting similarity approaches, have been reviewed by Götzenberger et al.1.
The recognition that selection acts on traits rather than species triggered various functional approaches in phytoplankton ecology10–13. However, the regulative power of competitive processes among the resident taxa and the role of environmental filtering on phytoplankton assemblages have not yet been studied by trait-based approaches.
Lakes’ phytoplankton is a highly diverse assemblage both in terms of species and in terms of its trait compositions14. The trait-based approach offers a tool for exploring the mechanisms that generate this high diversity and compositional variation. On the other hand, phytoplankton communities have properties that make them ideal for testing general hypotheses using trait-based approaches. In his conceptual synthesis, Vellend15 outlined four basic processes that determine the pattern of local communities: dispersal, drift (i.e. demographic stochasticity), selection and speciation. Although dispersal ability of algae is high16, recruitment of new species in local mature systems is exceptional rather than a common phenomenon17. Growth and extinction in small populations are subject to the effect of demographic stochasticity18,19. However, algal individuals in aquatic systems are present in astronomical numbers, therefore demographic stochasticity plays a negligible role in the community assembly20. Since speciation acts on a longer time-scale, we focus on the mechanisms related to the fourth process: selection, which includes habitat filtering and competition. Since the competition and the environmental filters result in different trends in the trait distributions, their potential role can be estimated by the trait composition of the local assemblages. Our aim was to investigate the impact of relevant physical and chemical properties of water on trait convergence or divergence in lakes’ phytoplankton and to study how the assembly rules vary in the growing season. Lakes’ phytoplankton assemblages undergo abrupt changes in the growing season, and occasionally their succession terminates in steady-state assemblages, which are dominated only by 1–3 species21. These characteristics make shallow lakes convenient objects to study how these transitions are followed by trait convergence or divergence.
The theory that relates trait convergence and divergence explicitly to environmental gradients is the stress- dominance hypothesis22,23, which predicts that in the harsher environment environmental filtering plays a major role and leads to trait convergence. In contrast, in benign ecological conditions, limiting similarity is the most decisive assembly rule resulting in trait divergence within the assemblages. Several studies on plant communi- ties have been published to date in favour of this hypothesis, showing that nutrients and water are key determi- nants for plants, and their availability determines which assembly rule controls community composition24–29. Analyses on the role of environmental filtering or limiting similarity on animal communities also supported the stress dominance hypothesis demonstrating the importance of temperature on the trait composition of fish assemblages30, or aridity and other climatic factors on desert bat communities31. It has also been demonstrated that the traits reflect differently to the constraints of the habitats, and thus, there are competition-related and environmental filtering-related traits32,33.
In the context of the above-mentioned issues, we addressed the following research questions:
Can trait convergence or divergence be observed in lakes phytoplankton, and do they display changes along the environmental gradients?
Do the results support the stress-dominance hypothesis23, that is, trait convergence, and thus, the role of envi- ronmental filtering increases in harsher (less productive or light limited) environments, while limiting similarity and trait divergence are more important in benign (more productive or well-illuminated) ecological conditions?
Results
Altogether, we recorded 877 algal taxa in the 283 samples. The main taxonomic groups with the number of occurring species are shown in Supplementary Table S1, (the whole taxa list is in Supplementary Table S2).
Chlorococcalean green algae, diatoms and cyanobacteria were the most species rich groups, which are charac- teristic in lakes phytoplankton. The values of nutrients and proxies of phytoplankton biomass varied in the ultra oligotrophic – hypertrophic range, which enables us to study the trait distributions in a sufficiently large scale.
Trait community weighted means—background variable relationships.
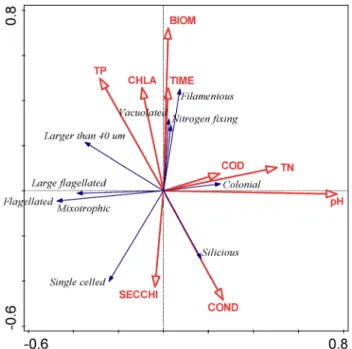
The results of RDA (shown in Fig. 1) indicate that nutrients and the phytoplankton biomass were the most important factors deter- mining trait distributions in phytoplankton assemblages. The first canonical axis (eigenvalue: 0.1019, Table 1) associated well with pH and Total Nitrogen. The second canonical axis (eigenvalue: 0.0536) correlates with TP and proxies of phytoplankton biomass (Chl-a and Biomass) and Secchi transparency; therefore this axis was considered later as a stress gradient to evaluate the usefulness of the stress-dominance hypothesis as a possible rule in phytoplankton assembly.The trait “colonial” positively, while mixotrophic, flagellated negatively correlated with the first canonical axis.
The traits that are characteristic for bloom-forming cyanobacteria (elongated, vacuolated, nitrogen-fixing) posi- tively associated with the second canonical axis, (details of the relationships are shown in Table 2, Supplementary Figure S1). In contrast, the siliceous and single celled traits negatively correlated with this axis.
The relationship between the environment and trait CWMs was also investigated at the level of variables.
Altogether ninety environmental variable/Trait CWM models were evaluated (Table 2) and displayed (Sup- plementary Fig. 2–10). Significant departures from the NULL model (P < 0.001) were found in 36 occasions.
Since both canonical axes correlated well with the properties of water considered relevant for the assembly of phytoplankton, we assessed CWM and ES values along these axes.
Distribution of the ES values in comparison with the null model.
Results of the t-tests indicated that except for the filamentous and siliceous traits ES values of each trait showed non-random distribution(Table 2). In the case of size, colonial, single-celled, and nitrogen-fixing traits, the means of ES values appeared to be significantly lower than zero referring to higher probability of trait convergence. ES values significantly higher than zero characterised the distribution of flagellated, mixotrophic, vacuolated traits and in the case of large flagellated trait complex, indicating a higher probability of a trait divergence and thus larger role of competitive processes in the community assembly.
Distribution of the ES values along the canonical axes.
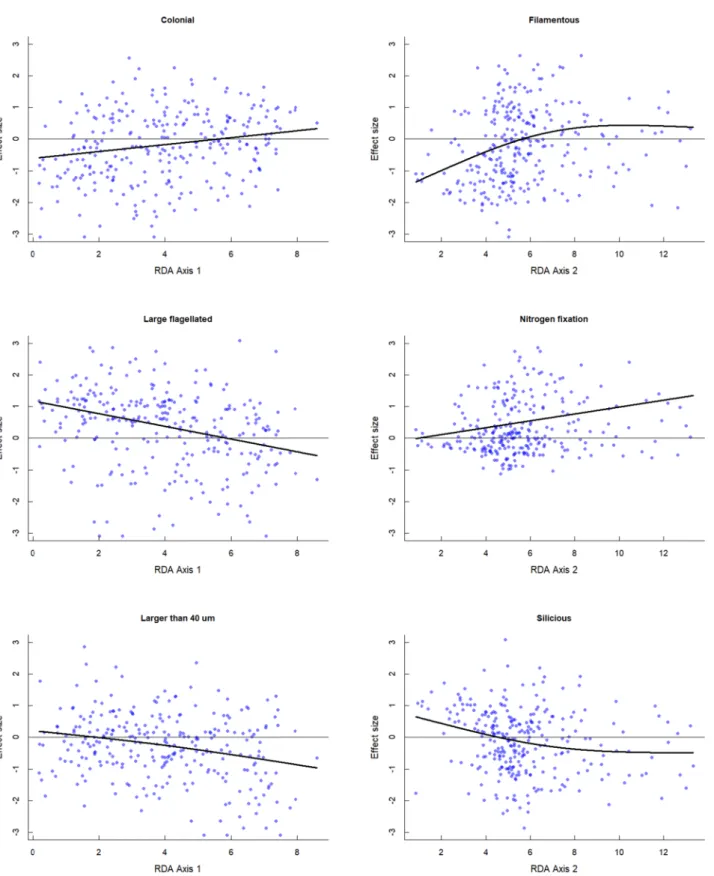
The effect size (ES) values represented vari- ous distribution patterns along the first canonical axis (Supplementary Figure S1). Values calculated for the traits coloniality were those that showed slightly increasing trends along the first axis. An opposing pattern characterised the changes of the ES values in the case of the size trait (algal units larger than 40 µm) and the“large flagellated” trait complex (Fig. 2). Effect size (ES) values of the other traits have not shown any trends (SupplementaryFigure S1).
Along the second canonical axis, we observed increasing trends in ES values of vacuolated filamentous and nitrogen fixing traits. An opposing, slightly decreasing trend was displayed by the siliceous trait (Fig. 2, Table 2).
Characteristic trends in the ES values of other traits could not be observed (Supplementary Figure S1). Since the GAM did not differ from a simple linear regression, for simplicity, we reported the latter.
Changes of ES values with the measured variables were also studied. Since the canonical axes of the RDA correlated well with the measured properties of waters, the results showed remarkable similarities to those we experienced during the study of ES values/canonical axes relationships. Results are shown in Supplementary Figure S2–10.
Figure 1. RDA biplots displaying the importance of physical and chemical characteristics of lakes on the relative abundance of the various algal traits. Red arrows are environmental variables, black arrows are traits.
Depth mean depth of the water bodies (m); area area of the water bodies (m2), Cond electrical conductivity (μS cm−1); TP total phosphorus (μg L−1), TN total nitrogen (μg L−1), CHLA chlorophyll-a (μg L−1), Secchi Secchi transparency (m), COD chemical oxygen demand (mg L−1), Time number of weeks in the date of sampling Functional groups of algae are represented as circles and codes.
Table 1. Summary table of RDA results total variation is 594.62792, explanatory variables account for 18.0%
(adjusted explained variation is 12.4%).
Statistic Axis 1 Axis 2 Axis 3 Axis 4
Eigenvalues 0.1019 0.0536 0.0113 0.0061
Explained variation (cumulative) 10.19 15.55 16.68 17.3 Pseudo-canonical correlation 0.4806 0.5634 0.3272 0.2433 Explained fitted variation (cumulative) 56.71 86.55 92.84 96.25 Permutation test results
On first axis Pseudo-F = 15.0, P = 0.002
On all axes Pseudo-F = 3.2, P = 0.002
Discussions
Trait distributions along the environmental gradients.
The results of this study demonstrated that the environmental properties of water determine the distribution of several algal traits, resulting in trait conver- gence or divergence in the phytoplankton assemblages. Nutrient content of the studied lakes covered the whole trophic spectrum (from oligotrophy to hypertrophy) both in the case of phosphorus and nitrogen forms. The different roles of these two nutrients in phytoplankton assembly were well represented by the results of the RDA.The first canonical axis correlated with the TN, while the second one with the TP and other biomass-related variables (i.e. chlorophyll-a and phytoplankton biomass). Although the growth of phytoplankton in most fresh- waters is limited by phosphorus, nitrogen limitation frequently occurs in lakes with TP > 30 µg l−134. In our data- base, TN/TP ratios varied between 1 and 132 (not shown here) referring to the possible role of N limitation even in eutrophic environments. However, the fact that TP, the biomass related variables and Secchi transparency associated with the second axis of the RDA refers to the importance of phosphorus in controlling phytoplankton biomass. Flagellated, mixotrophic and single celled traits associated with the lower values of RDA axes. In our database taxa sharing these traits were unicellular flagellated organisms such as chrysophytes (Chrysochromulina spp.) or cryptophytes (Rhodomonas cf. nannoplanctonica). These taxa have high metabolic activity and prefer oligotrophic environments35. The traits characteristic for bloom forming, heterocytic cyanobacteria (elongated, vacuolated, nitrogen fixing) associated with the large values of the second RDA axis, referring to eutrophic envi- ronments, with occasional nitrogen limitation.
The time (number of weeks when samples were collected) also correlated with this axis, which is in accord- ance with our present knowledge on phytoplankton succession, that is, biomass maxima are expected to occur in late summer periods36.
Trait convergence or divergence in lakes phytoplankton.
The theory of environmental filtering ver- sus limiting similarity is well established in the literature and provides a framework of how communities are assembled25,37. In our study, ES values of most traits significantly differed from 0, which clearly indicated both convergence and divergence of traits and the importance of the related assembly mechanisms. In line with the Table 2. Summary table of the ES value distributions. Significant results are written in bold.Traits
Flagellated Size
(larger > 40 µm) Colonial Single celled Filamentous Mixotrophic Siliceous Nitrogen
fixing Vacuolated Large flagellated Distribution of the trait in the
whole dataset (%) 26% 39% 28% 61% 11% 26% 20% 3% 5% 13%
Distribu- tion of the ES values compared to the random distributions
Mean (ES) 0.194 − 0.268 − 0.191 − 0.266 − 0.121 0.194 − 0.101 0.513 0.257 0.368
Level of
significance 0.003 0.000 0.010 0.000 0.145 0.004 0.124 0.000 0.001 0.000
Slope of the linear regres- sion model
Time 0.002 0.002 − 0.022 0.009 0.061 0.001 − 0.018 0.028 0.036 − 0.020
TP − 0.085 0.029 − 0.111 0.014 0.769 − 0.099 − 0.180 0.381 0.441 0.049
TN − 0.343 0.330 0.705 0.669 0.782 − 0.334 0.433 0.192 0.155 −1.022
Biomass − 0.110 − 0.025 0.030 0.210 0.634 − 0.106 − 0.245 0.497 0.555 −0.161
Chlorophyll-
a − 0.125 − 0.132 − 0.025 0.220 1.023 − 0.131 − 0.248 0.831 0.934 −0.167
COD − 0.072 − 0.075 0.619 0.533 1.290 − 0.087 − 0.187 1.146 1.190 −0.058
Secchi 0.199 0.209 0.039 − 0.350 − 1.624 0.208 0.394 − 1.318 − 1.483 0.266
pH 0.233 0.091 0.548 0.485 0.636 0.245 0.228 0.711 0.730 −0.238
Conductivity −0.469 −0.183 0.898 0.256 −0.000 −0.497 0.183 −0.150 −0.222 −0.301
RDA Axis 1 − 0.053 − 0.140 0.109 0.107 − 0.042 − 0.051 0.035 − 0.016 − 0.012 −0.196
RDA Axis 2 − 0.014 0.015 0.013 0.035 0.136 − 0.020 − 0.101 0.107 0.112 −0.020
Significance of the linear regression modell
Time 0.780 0.804 0.018 0.352 0.000 0.916 0.031 0.002 0.000 0.044
TP 0.442 0.813 0.379 0.917 0.000 0.372 0.115 0.002 0.001 0.716
TN 0.130 0.219 0.003 0.011 0.005 0.142 0.065 0.350 0.490 0.000
Biomass 0.206 0.796 0.766 0.040 0.000 0.223 0.007 0.000 0.000 0.129
Chlorophyll-
a 0.236 0.218 0.833 0.062 0.000 0.218 0.018 0.000 0.000 0.191
COD 0.748 0.762 0.017 0.044 0.000 0.700 0.429 0.000 0.000 0.830
Secchi 0.236 0.218 0.833 0.062 0.000 0.218 0.018 0.000 0.000 0.191
pH 0.162 0.622 0.003 0.014 0.001 0.143 0.180 0.000 0.000 0.242
Conductivity 0.093 0.551 0.004 0.438 0.079 0.076 0.524 0.616 0.496 0.377
RDA Axis 1 0.105 0.000 0.003 0.003 0.313 0.117 0.286 0.666 0.757 0.000
RDA Axis 2 0.624 0.617 0.682 0.278 0.000 0.500 0.000 0.001 0.001 0.575
Figure 2. Effect sizes (ES) of selected functional traits along the first two canonical axes of the RDA. Dotted lines indicate the position of ES = 0. Positive values indicate divergence, negative ones convergence of traits. Each dot represents a sample on the gradient. Black lines indicate trends based on GAM.
reasoning above, in the case of traits where ES values were significantly lower than zero the results strongly sup- ported the higher probability of environmental filtering.
The ES values showed different patterns along the two canonical axes. Along the first axis, which was primarily determined by the TN, ES values of only the size trait and the large flagellated trait complex showed remarkable trends. That the ES values of the nitrogen-fixing trait did not show any changes along this axis, could be accounted for by that the nitrogen limitation depends on the TP/TN ratio, not on the absolute quantity of nitrogen.
In this study, the most remarkable trends characterised those traits (nitrogen fixing and vacuolated; Table 2), that are associated with elongated bloom-forming cyanobacteria and considered to give a real competitive advan- tage to phytoplankters that live in nitrogen and light deficient environments38. Since from the midsummer period (~ week 30) ES values of these traits showed remarkable, significant increase with the trophic state-related variables (TP, Biomass and Chl-a, 2nd RDA axis), it is reasonable to suppose that resource competitions are responsible for this trend. Thus these traits can be considered as competition-related traits.
In several cases, ES values of functional traits showed random distribution along the gradients (Table 2).
However, this does not necessarily mean that these traits are neutral. Environmental filtering and limiting simi- larity might act simultaneously and can compensate each other; therefore, the values of test statistics support the null hypothesis.
Since we applied exclusively binary traits, distance calculations between species can result in only two distance values: 0 and 1. Our results clearly highlighted that even despite this simplification, in the cases of very competi- tive traits (nitrogen fixation or vacuolated) the applied method could successfully indicate trait divergence, that is, the potential role of limiting similarity as a leading assembly rule in phytoplankton assemblages. However, there were several traits, e.g., mixotrophy or flagellated, where this simplification did not seem to be successful.
Several algal groups have the capability of consuming organic particles, but the rate of the consumption and its importance on the overall nutrition of cells can vary considerably among the major groups39,40. The fact that mixotrophic traits did not display any relationship with the canonical axes indicates that merging all algae that are capable of mixotrophy into one “mixotrophic group” is an oversimplification of the phenomenon. The same statements can be made for the flagellated trait. Within this trait, the algae considerably differ from each other in terms of their size, nutrient preferences and tolerances. Therefore, the assignment of each flagellated taxa into a single group might occasionally lead to improper conclusions. However, during the application of the trait complex “large flagellated” we experienced a decreasing trend in the ES values along the first canonical axis, which suggests that finer resolution of the groups created by their single trait characteristics may contribute to the understanding the underlying processes.
It is important to note that the applied method has some shortcomings when binary traits are studied. If distribution of a binary trait in the dataset approximates the 50%, trait divergence cannot be grasped. The same can be said for the trait convergence, if the distribution of a trait is highly unequal in the dataset (trait distribu- tions in the dataset are shown in Table 2).
Results in the context of ecological theories.
Convergence and divergence of traits can be interpreted in the context of the stress-dominance hypothesis23. The stress-dominance hypothesis predicts that along an increasing stress gradient, the importance of environmental filtering increases while competition decreases. Fol- lowing Grime’s definition41, the stress can be defined as external constraints limiting the rate of biomass pro- duction. Since the availability of nutrients and light controls primarily the production of algae, at the lower end of these gradients nutrient limitation might occasionally occur, while in the upper end them, due to the large phytoplankton biomass, reduced availability of light may potentially limit algal production. This logic was sup- ported by the results of RDA, where the biomass-related variables (biomass and Chl-a) associated with TP, but they showed an opposite direction to the Secchi transparency (2nd RDA axis).Supposing that traits respond to nutrient and light limitation similarly, a humpback relationship could be expected42, but none of the traits’ ES values displayed this kind of pattern. The decreasing or increasing trends we experienced might occasionally occur when narrow ranges of independent variables are studied. However, in our case, the lakes involved in this study covered the whole trophic spectrum, from ultra oligotrophic to hypertrophic. The possible explanation is that the traits applied in this study respond differently to the nutrient and light limitations, which phenomenon differentiates algae from the higher plants.
The increasing trends observed in the ES values of filamentous, vacuolated and nitrogen-fixing traits are in line with the stress-dominance hypothesis. These traits are characteristic to bloom-forming cyanobacteria, which prevail in nutrient-rich environment. Their elongated form makes them very good light harvesters43, vacuoles helps them in buoyancy regulation finding the optimal position in the water column, while nitrogen fixation enables the taxa to flourish in nitrogen-deficient environments. Since higher ES values appear when CWM values are approaching the 0.5 value, the results imply that besides these traits there can be several other traits (small cell size, mixotrophy) by which planktic organisms can cope with the unfavourable light conditions, or occasional nitrogen limitation, which might develop even in eutrophic environment34.
We observed an opposite trend along the 1st canonical axis (correlated with TN) in the case of the large flag- ellated trait complex. The higher probability in trait divergence occurred in lower TN concentrations, while in higher concentration range trait convergence is more probable. This pattern contradicts to the stress dominance hypothesis. The CWM values of this trait showed a decreasing tendency, indicating that taxa having these traits (mostly dinoflagellates) are important elements of the phytoplankton in oligotrophic lakes, play only a minor role in highly eutrophic environments.
We must note that in late summer after long-lasting calm periods bloom-forming cyanobacteria outcompete other elements of the phytoplankton, which might lead to monodominance of the filamentous, vacuolated and nitrogen fixing traits in the phytoplankton44, and thus, competition ends in a trait convergence. Thus, we note
that the length of periods favourable for competitive processes in the phytoplankton cannot be neglected when the role of habitat filtering or niche differentiation is studied.
Conclusions
The null model approach demonstrated that random processes could not be neglected as assembly mechanisms driving compositional changes in shallow lakes’ phytoplankton. However, we can conclude that depending on the selected traits, environmental filtering and limiting similarity can also play a crucial role. Our results proved that filamentous, vacuolated and nitrogen fixing are those so-called competition-related traits, in the case of which niche partitioning can be safely demonstrated. The observed trait divergence in the high trophic range indicates, that extreme eutrophication does not necessarily coincide with monodominance of bloom forming cyanobacteria because the species pool of eutrophic lakes’ phytoplankton contains elements with other types of competitive functional traits that enable them to flourish in this kind of environments. Contrary to studies on terrestrial primary producer communities (e.g.25,45), our results only partially supported the stress-dominance hypothesis.
Materials
Studied lakes.
We used long-term phytoplankton monitoring data for Hungarian (Pannonian ecoregion), Romanian (Pannonian ecoregion) and Croatian (Dinaric region) standing waters (Supplementary Table S3).The dataset contains data for 283 phytoplankton samples collected from 37 water bodies in May–October period between 1992 and 2018. The climate in the Pannonian region is humid continental with warm summers (sum- mer mean temperature is 21–23 °C), and with an average annual precipitation of 450–600 mm46. The climate in the Dinaric region is transitional continental with similar temperature but slightly higher precipitation47. Most of the lakes in the Pannonian region are polimictic oxbows and shallow ponds developed in deflation pools48,49. The selected water bodies of the Dinaric region are deep reservoirs of low trophic status. Since the dataset includes species data with relative and absolute biomass abundances, this provides an opportunity to study trait distribu- tion within the samples.
Sampling and sample processing.
Samples were taken by tube sampler from the trophic layer (2.5 × Sec- chi depth) at the deepest parts of the lakes. In the case of water bodies where the maximum depth (Zmax) was less than 2 m, the whole water column has been sampled. Conductivity (µS cm−1) and pH was measured by a portable-multiparameter digital meter (HQ30d) in the field (Supplementary Table S4). Phytoplankton samples (0.5 L) were fixed with Lugol’s solution. Qualitative and quantitative analyses of phytoplankton were performed using inverted microscopes according to Utermöhl’s method50. The samples were allowed to settle in 1, 5 or 10 cm3 counting chambers. In each sample at least 400 units (cells, filaments or colonies) were counted along transects at 400-fold magnifications. The small-celled taxa (chlorelloid green algae or Romeria spp.) which occa- sionally occurred in high numbers in the samples were counted in each field at 400-fold magnification. Area of the whole counting chamber was investigated at 100-fold magnification to determine the relative abundance of rare, large-sized taxa. All specimens were identified to species level. In oligotrophic lakes where centric diatoms occasionally attained higher relative abundance, samples were pretreated and investigated under 1000-fold mag- nification.Since the trophic status of waters has a pronounced impact on phytoplankton composition and diversity51 five trophic state related variables were used as gradients: phytoplankton biomass, chlorophyll-a, total phos- phorus (TP), total nitrogen (TN) and chemical oxygen demand (COD). Algae were identified to species level.
Phytoplankton biomass was calculated by considering algal biovolume performed according to52 and converted to wet weight (mg/L) assuming a specific gravity of 1. Sestonic chlorophyll-a concentration was measured spectrophotometrically and corrected for phaeophytin53. Background variables (TP, TN and COD) were meas- ured according to the national standards. Total phosphorus concentration was determined as soluble reactive phosphorus after H2SO4 digestion using the acid molybdate method54. To determine total nitrogen (TN) the method using oxidative digestion with peroxodisulfate was applied55. The measurement of chemical oxygen demand (COD) was based on the dichromate reaction method56. The values of measured parameters are shown in Supplementary Table S4.
We aimed to study within-year changes in the strength of trait convergence and divergence. Therefore, we used the dates of samplings measured by week within years as explanatory variables. Since the samples were taken in May–October periods in each year, its scale ranged from 19 to 44th weeks.
Functional traits.
Nine functional traits were studied. Eight of them are binary variables: flagellated, colo- nial, single celled, filamentous, mixotrophic, siliceous (mostly, but not exclusively diatoms), nitrogen fixing and vacuolated (species with gas vacuoles). Size was the only continuous trait, but we binarized that using linear dimensions, larger than 40 µm as a threshold. These traits are based on those visible morphological features of algae that refer to special biochemical, physiological or physical adaptations, and basically influence their functioning and ecological roles in the planktic assemblages12. Besides the single traits, we also applied a trait combination namely the “large flagellated” (Supplementary Table S2).Statistical analyses.
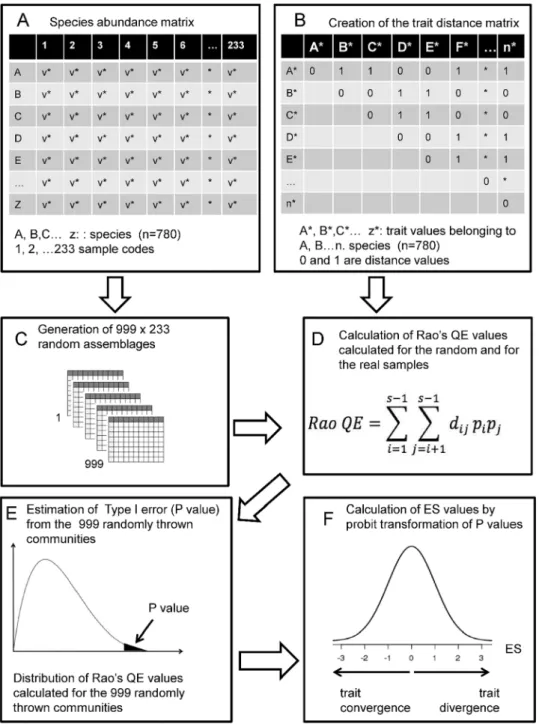
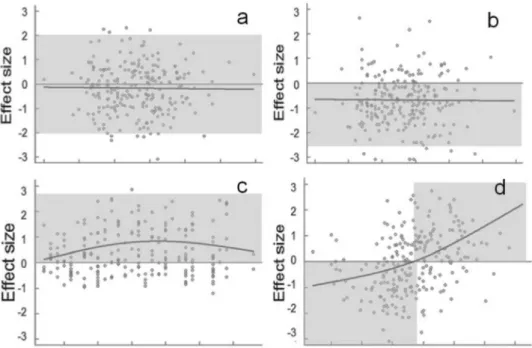
To study the convergence or divergence of traits we used a null model approach applied by25. Null model approaches are the most frequently used tools studying the assembly rules because these are suitable for identification of non-random components in community composition1. Details of the pro- cedure are shown in Fig. 3. The essence of the approach is that trait divergence or convergence is characterised by a test statistic and this test statistic was calculated for 999 random samples created from the species pool. The test statistic was also calculated for the real samples and proportions of random communities where test statisticis more extreme than in the field sample p-values were calculated. We used probit transformed p-values as ‘effect size values’ (ES), which indicate the strength of trait divergence or convergence57. Positive ES values indicate that competition is the leading assembly rule, while negative ones refer to the leading role of environmental filtering (Fig. 4). Significant differences in ES values from zero for the whole dataset were tested by the Student’s t-test.
Since the dominant assembly rule may change seasonally or along environmental gradients, effect size values were plotted against various gradients. To reveal the direction of changes in ES values we applied the generalized additive model (GAM).
The whole procedure outlined above was repeated for each trait separately. The consecutive steps of the procedure are shown in Fig. 3.
This approach is a flexible framework where appropriate test statistics and randomization algorithms have to be selected in each study according to its purposes. We used Rao’s quadratic entropy58 as test statistic:
Rao QE=
s−1
i=1 s−1
J=i+1
dijpipj
Figure 3. Main steps of the statistical approach.
where: Rao QE is the value of Rao’s quadratic entropy, dij is the trait-based distance between species i and j, pi
and pj is the relative biomass abundance of species i and j.
There are lot of possible distance measures for binary data59. They differ when several binary variables are considered, but all results in the same value when only one variable (trait) is considered: zero is the distance if both species have or lack the trait, and the distance is one if only one of them has the given trait. We applied T1 randomization60 that means reshuffling trait values in the whole dataset while the matrix of species composition remained untouched. This combination of test statistic and randomization algorithm allows detecting both trait convergence due to environmental filtering, and trait divergence due to limiting similarity60,61. Illustration of the possible outcomes of the analyses are shown in Fig. 4.
To characterise the trait distribution along the gradients, we calculated community weighted mean (CWM) values62 for each sample. These values are the mean trait values weighted by the relative abundance of species.
Since in this study we used binary traits, CWM is equal with the relative abundance of the trait in the sample.
We applied GAM regression to derive the environmental gradient/CWM relationships.
We used redundancy analysis (RDA) to reveal the relationship between physical and chemical properties of water and the trait composition (i.e. CWMs of traits) of the planktic assemblages. To avoid nonlinearity and the impact of outliers, explanatory variables were log-transformed. We used the first two canonical axes of the RDA to study the patterns of trait distributions (CWM) and the trends in the traits’ ES values. Collinearity was tested using the variance inflation factor (VIF).
All statistical analyses and graphs were performed under R environment, with the relevant packages (vegan, ggplot2, dplyr and ade4)63–65.
Evaluation of the community weighted mean (CWM)—effect size (ES) value relation‑
ship.
Since the calculation of both CWM and ES values have been based on the relative abundance of binary traits, there were some regularities in the variation of these values. Maximum of the Rao Q value is obtained when biomass abundance of a given trait is 50%, therefore, an increase in ES can be expected when the CWM of the trait approaches 0.5 and starts from relative abundance range of 0 or 1. Exactly the same logic is standing behind the relationship between ES and CWM when the former shows U-shaped curve. In this case, CWM can occasionally show both bell-shaped and U-shaped distributions. It is feasible if CWMs are approaching the 0 or 1 abundance values in the middle range of the background variables.Data availability
The data that support the findings of this study are available from the corresponding author, upon reasonable request.
Received: 9 April 2020; Accepted: 27 October 2020
Figure 4. Possible outcomes of the analyses. Each dot represents a sample on the gradient/effect size plot. (a) Traits showing neither convergence nor divergence; (b) trait convergence, (c) trait divergence; (d) shift from trait convergence to divergence.
References
1. Götzenberger, L. et al. Ecological assembly rules in plant communities—Approaches, patterns and prospects. Biol. Rev. 87, 111–127.
https ://doi.org/10.1111/j.1469-185X.2011.00187 .x (2012).
2. Díaz, S. et al. Incorporating plant functional diversity effects in ecosystem service assessments. P. Natl. Axad. Sci. USA 104, 20684–20689. https ://doi.org/10.1073/pnas.07047 16104 (2007).
3. McGill, B. J., Enquist, B. J., Weiher, E. & Westoby, M. Rebuilding community ecology from functional traits. Trends Ecol. Evol. 21, 178–185. https ://doi.org/10.1016/j.tree.2006.02.002 (2006).
4. Nobel, I.R. & Slatyer, R.O. Post-fire succession of plants in Mediterranean ecosystems in: Proceedings of the Symposium on the Environmental Consequences of Fire and Fuel Management in Mediterranean Ecosystems (eds. Mooney, H.A. & Conrad, C.E.) 27–36 (California Palo Alto, 1977).
5. Cornwell, W. K. & Ackerly, D. D. Community assembly and shifts in plant trait distributions across an environmental gradient in coastal California. Ecol. Monogr. 79, 109–126. https ://doi.org/10.1890/07-1134.1 (2009).
6. Kraft, N. J. B., Valencia, R. & Ackerly, D. D. Functional traits and niche-based tree community assembly in an amazonian forest.
Science 322, 580–582. https ://doi.org/10.1126/scien ce.11606 62 (2008).
7. MacArthur, R. & Levins, R. The limiting similarity, convergence, and divergence of coexisting species. Am. Nat. 101, 377–385.
https ://doi.org/10.1086/28250 5 (1967).
8. Pásztor, L., Botta-Dukát, Z., Magyar, G., Czárán, T. & Meszéna, G. Theory-Based Ecology: A Darwinian Approach (Oxford University Press, Oxford, 2016).
9. Diamond, J.M. Assembly of Species Communities in Ecology and Evolution of Communities (eds. Cody, M.L. & Diamond, J.M.) 342–444 (Belknap Press, 1975).
10. Litchman, E., Klausmeier, C. A., Schofield, O. M. & Falkowski, P. G. The role of functional traits and trade-offs in structur- ing phytoplankton communities: Scaling from cellular to ecosystem level. Ecol. Lett. 10, 1170–1181. https ://doi.org/10.111 1/j.1461-0248.2007.01117 .x (2007).
11. Reynolds, C. S., Huszár, V., Kruk, C., Naselli-Flores, L. & Melo, S. Towards a functional classification of the freshwater phytoplank- ton. J. Plankton Res. 24, 417–428. https ://doi.org/10.1093/plank t/24.5.417 (2002).
12. Salmaso, N. & Padisák, J. Morpho-functional groups and phytoplankton development in two deep lakes (Lake Garda, Italy and Lake Stechlin, Germany). Hydrobiologia 578, 97–112. https ://doi.org/10.1007/s1075 0-006-0437-0 (2007).
13. Salmaso, N., Naselli-Flores, L. & Padisák, J. Functional classifications and their application in phytoplankton ecology. Freshw. Biol.
60, 603–619. https ://doi.org/10.1111/fwb.12520 (2015).
14. Borics, G., Tóthmérész, B., Lukács, B. A. & Várbíró, G. Functional groups of phytoplankton shaping diversity of shallow lake ecosystems. Hydrobiologia 698, 251–262. https ://doi.org/10.1007/s1075 0-012-1129-6 (2012).
15. Vellend, M. Conceptual synthesis in community ecology. Q. Rev. Biol. 85, 183–206. https ://doi.org/10.1086/65237 3 (2010).
16. Padisák, J., Vasas, G. & Borics, G. Phycogeography of freshwater phytoplankton: Traditional knowledge and new molecular tools.
Hydrobiologia 764, 3–27. https ://doi.org/10.1007/s1075 0-015-2259-4 (2016).
17. Padisák, J. Cylindrospermopsis raciborskii (Woloszynska) Seenayya et Subba Raju, an expanding, highly adaptive cyanobacterium:
worldwide distribution and review of its ecology. Arch. Hydrobiol. 107, 563–593 (1997).
18. Méndez, V., Assaf, M., Masó-Puigdellosas, A., Campos, D. & Horsthemke, W. Demographic stochasticity and extinction in popula- tions with Allee effect. Phys. Rev. E. 99, 022101. https ://doi.org/10.1103/PhysR evE.99.02210 1 (2019).
19. Parvinen, K., Dieckmann, U., Gyllenberg, M. & Metz, J. A. Evolution of dispersal in metapopulations with local density depend- ence and demographic stochasticity. J. Evolut. Biol. 16, 143–153. https ://doi.org/10.1046/j.1420-9101.2003.00478 .x (2003).
20. Borics, G., Abonyi, A., Salmaso, N. & Ptacnik, R. Freshwater phytoplankton diversity: Models, drivers and implications for eco- system properties. Hydrobiologia https ://doi.org/10.1007/s1075 0-020-04332 -9 (2020).
21. Naselli-Flores, L., Padisák, J., Dokulil, M. T. & Chorus, I. Equilibrium/steady-state concept in phytoplankton ecology. Hydrobiologia 502, 395–403. https ://doi.org/10.1023/B:HYDR.00000 04297 .52645 .59 (2003).
22. Weiher, E. & Keddy, P.A. Assembly rules, null models, and trait dispersion: New questions from old patterns. Oikos 74, 159–164 (1995). https ://www.jstor .org/stabl e/35456 86.
23. Coyle, J. R. et al. Using trait and phylogenetic diversity to evaluate the generality of the stress-dominance hypothesis in eastern North American tree communities. Ecography 37, 814–826. https ://doi.org/10.1111/ecog.00473 (2014).
24. Baastrup-Spohr, L., Sand-Jensen, K., Nicolajsen, S. V. & Bruun, H. H. From soaking wet to bone dry: Predicting plant community composition along a steep hydrological gradient. J. Veg. Sci. 26, 619–630. https ://doi.org/10.1111/jvs.12280 (2015).
25. Lhotsky, B. et al. Changes in assembly rules along a stress gradient from open dry grasslands to wetlands. J. Ecol. 104, 507–517.
https ://doi.org/10.1111/1365-2745.12532 (2016).
26. Butterfield, B. J., Bradford, J. B., Munson, S. M. & Gremer, J. R. Aridity increases below-ground niche breadth in grass communi- ties. Plant Ecol. 218, 385–394. https ://doi.org/10.1007/s1125 8-016-0696-4 (2017).
27. Gastauer, M., Saporetti-Junior, A. W., Valladares, F. & Meira-Neto, J. A. Phylogenetic community structure reveals differences in plant community assembly of an oligotrophic white-sand ecosystem from the Brazilian Atlantic Forest. Acta Bot. Bras. 31, 531–538.
https ://doi.org/10.1590/0102-33062 016ab b0442 (2017).
28. Chapman, J. & McEwan, R. The role of environmental filtering in structuring appalachian tree communities: Topographic influ- ences on functional diversity are mediated through soil characteristics. Forests 9, 19. https ://doi.org/10.3390/f9010 019 (2018).
29. Lukács, B. A. et al. Carbon forms, nutrients and water velocity filter hydrophyte and riverbank species differently: A trait-based study. J. Veg. Sci. 30, 471–484 (2019).
30. Kuczynski, L. & Grenouillet, G. Community disassembly under global change: Evidence in favor of the stress-dominance hypoth- esis. Glob. Chang. Biol. 24, 4417–4427. https ://doi.org/10.1111/gcb.14320 (2018).
31. Patrick, L. E. & Stevens, R. D. Phylogenetic community structure of North American desert bats: Influence of environment at multiple spatial and taxonomic scales. J. Anim. Ecol. 85, 1118–1130. https ://doi.org/10.1111/1365-2656.12529 (2016).
32. Lopez, B. et al. A new framework for inferring community assembly processes using phylogenetic information, relevant traits and environmental gradients. One Ecosyst. 1, e9501. https ://doi.org/10.3897/oneec o.1.e9501 (2016).
33. Ács, E. et al. Trait-based community assembly of epiphytic diatoms in saline astatic ponds: a test of the stress-dominance hypothesis.
Sci. Rep. 9(1), 15749 (2019).
34. Downing, J. A. & McCauley, E. The nitrogen:phosphorus relationship in lakes. Limnol. Oceanogr. 37, 936–945 (1992).
35. Phillips, G. et al. A phytoplankton trophic index to assess the status of lakes for the Water Framework Directive. Hydrobiologia 704, 75–95. https ://doi.org/10.1007/s1075 0-012-1390-8 (2013).
36. Padisák, J. et al. Dominant species, functional assemblages and frequency of equilibrium phases in late summer phytoplankton assem- blages in Hungarian small shallow lakes. Hydrobiologia 502, 157–168. https ://doi.org/10.1023/B:HYDR.00000 04278 .10887 .40 (2003).
37. HilleRisLambers, J., Adler, P. B., Harpole, W. S., Levine, J. M. & Mayfield, M. M. Rethinking community assembly through the lens of coexistence theory. Annu. Rev. Ecol. Evol. Syst. 43, 227–248. https ://doi.org/10.1146/annur ev-ecols ys-11041 1-16041 1 (2012).
38. Huisman, J., van Oostveen. P. & Weissing, F.J. Species dynamics in phytoplankton blooms: incomplete mixing and competition for light. Am. Nat. 154, 46–68, https://doi.org/10.1086/303220 (1999).
39. Bird, D. F. & Kalff, J. Bacterial grazing by planktonic lake algae. Science 231, 493–495. https ://doi.org/10.1126/scien ce.231.4737.493 (1986).
40. Stoecker, D. K. Mixotrophy among Dinoflagellates. J. Eukaryot. Microbiol. 46, 397–401. https ://doi.org/10.1111/j.1550-7408.1999.
tb046 19.x (1999).
41. Grime, J.P. Plant Strategies, Vegetation Processes, and Ecosystem Properties. (John Wiley and Sons, 2001). ISBN 0-471-49601-4.
42. Navas, M. & Violle, C. Plant traits related to competition: How do they shape the functional diversity of communities?. Commun.
Ecol. 10, 131–137. https ://doi.org/10.1556/ComEc .10.2009.1.15 (2009).
43. Reynolds, C. S. The Ecology of Phytoplankton (Cambridge University Press, Cambridge, 2006).
44. Borics, G., Grigorszky, I., Szabó, S. & Padisák, J. Phytoplankton associations in a small hypertrophic fishpond in East Hungary during a change from bottom-up to top-down control. Hydrobiologia 424, 79–90. https ://doi.org/10.1023/A:10039 48827 254 (2000).
45. Mason, N. W. H., de Bello, F., Doležal, J. & Lepš, J. Niche overlap reveals the effects of competition, disturbance and contrasting assembly processes in experimental grassland communities. J. Ecol. 99, 788–796. https ://doi.org/10.1111/j.1365-2745.2011.01801 .x (2011).
46. Dobosi, Z. & Felméry, L. Climatology, ELTE TTK, Nemzeti Tankönyvkiadó, p. 500 (in Hungarian).
47. Mihevc, A., Prelovšek, M. & Hajna, N.Z. Introduction to the Dinaric Karst. Inštitut za raziskovanje krasa ZRC SAZU. (2010).
48. Borics, G. et al. Phytoplankton-based shallow lake types in the Carpathian basin: Steps towards a bottom-up typology. Fund. Appl.
Limnol. 184, 23–34. https ://doi.org/10.1127/1863-9135/2014/0518 (2014).
49. Borics, G., Abonyi, A., Várbíró, G., Padisák, J. &T-Krasznai, E. Lake stratification in the Carpathian basin and its interesting biological consequences. Inland Waters 5, 173–186, https ://doi.org/10.5268/IW-5.2.702 (2015).
50. Utermöhl, H. Zur Vervollkommnung der quantitative Phytolankton-Methodik. Mitt. Int. Verein. Limnol. 9, 1–38. https ://doi.
org/10.1080/05384 680.1958.11904 091 (1958).
51. Török, P. et al. Functional diversity supports the biomass–Diversity humped-back relationship in phytoplankton assemblages.
Funct. Ecol. 30, 1593–1602. https ://doi.org/10.1111/1365-2435.12631 (2016).
52. Hillebrand, H., Dürselen, C. D., Kirschtel, D., Pollingher, U. & Zohary, T. Biovolume calculation for pelagic and benthic microalgae.
J. Phycol. 35, 403–424. https ://doi.org/10.1046/j.1529-8817.1999.35204 03.x (1999).
53. MSZ ISO 10260:1993. Water Quality. Measurement of Biochemical Parameters. Spectrometric Determination of the Chlorophyll-a Concentration.
54. MSZ EN ISO 6878:2004. Water Quality. Determination of Phosphorus. Ammonium Molybdate Spectrometric Method.
55. ISO 11905-1:1997. Water Quality. Determination of Nitrogen. Part 1: Method Using Oxidative Digestion with Peroxodisulfate.
56. MSZ ISO 6060:1991.Water Quality. Determination of the Chemical Oxygen Demand.
57. Botta-Dukát, Z. Cautionary note on calculating standardized effect size (SES) in randomization test. Commun. Ecol. 19, 77–83, https ://doi.org/10.1556/168.2018.19.1.8 (2018).
58. Botta-Dukát, Z. Rao’s quadratic entropy as a measure of functional diversity based on multiple traits. J. Veg. Sci. 16, 533–540. https ://doi.org/10.1111/j.1654-1103.2005.tb023 93.x (2005).
59. Legendre, P. & Legendre, L.F. Numerical Ecology Vol. 24. (Elsevier, 2012).
60. Götzenberger, L. et al. Which randomizations detect convergence and divergence in trait‐based community assembly? A test of commonly used null models. J. Veg. Sci. 27, https ://doi.org/10.1111/jvs.12452 , 1275–1287.
61. Botta-Dukát, Z. & Czúcz, B. Testing the ability of functional diversity indices to detect trait convergence and divergence using individual-based simulation. Methods Ecol. Evol. 7, 114–126. https ://doi.org/10.1111/2041-210X.12450 (2016).
62. Garnier E. et al. Plant functional markers capture ecosystem properties during secondary succession. Ecology 85, e2630–2637, https ://doi.org/10.1890/03-0799.
63. Dray, S. & Dufour, A.B. The ade4 package: Implementing the duality diagram for ecologists. J. Stat. Softw. 22, 1–20, https ://doi.
org/10.18637 /jss.v022.i04.
64. Oksanen J. et al. Package ‘vegan’. Community Ecology Package, Version, 2(9) (2013).
65. Team R. Core (2017) R: A Language and Environment for Statistical Computing (R Foundation for Statistical Computing, Vienna, 2017).
Acknowledgements
Authors were financially supported by the NKFIH OTKA K-132150 and by OTKA FK-127939 grant. We are grateful for the data provided by the Hungarian, Croatian and Romanian water quality monitoring network.
Author contributions
G.B., G.V. and Z.B.D. conceived the ideas and designed methodology; G.V., T.K.E. and V.B.B. collected the data; G.V. and Z.B.D. analysed the data; G.B., V.B.B., I.B., B.A.L. led the writing of the manuscript. All authors contributed critically to the drafts and gave final approval for publication.
Competing interests
The authors declare no competing interests.
Additional information
Supplementary information is available for this paper at https ://doi.org/10.1038/s4159 8-020-76645 -7.
Correspondence and requests for materials should be addressed to G.V.
Reprints and permissions information is available at www.nature.com/reprints.
Publisher’s note Springer Nature remains neutral with regard to jurisdictional claims in published maps and institutional affiliations.
Open Access This article is licensed under a Creative Commons Attribution 4.0 International License, which permits use, sharing, adaptation, distribution and reproduction in any medium or format, as long as you give appropriate credit to the original author(s) and the source, provide a link to the Creative Commons licence, and indicate if changes were made. The images or other third party material in this article are included in the article’s Creative Commons licence, unless indicated otherwise in a credit line to the material. If material is not included in the article’s Creative Commons licence and your intended use is not permitted by statutory regulation or exceeds the permitted use, you will need to obtain permission directly from the copyright holder. To view a copy of this licence, visit http://creat iveco mmons .org/licen ses/by/4.0/.
© The Author(s) 2020