74.
1
Expanding the trait-based concept of benthic diatoms: development of 2
trait- and species-based indices for conductivity as the master variable of 3
ecological status in continental saline lakes 4
5
Csilla Stenger-Kovács1, Kitti Körmendi1,Edina Lengyel2, András Abonyi3, Éva Hajnal4, 6
Beáta Szabó2, Krisztina Buczkó5, Judit Padisák1,2 7
8
Contact: stenger@almos.uni-pannon.hu 9
10
1 University of Pannonia, Department of Limnology, Egyetem u. 10, H-8200, Veszprém, 11
Hungary 12
2 MTA-PE Limnoecology Research Group of the Hungarian Academy of Sciences, Egyetem 13
u. 10, H-8200, Veszprém, Hungary 14
3 Institute of Ecology and Botany, MTA Centre for Ecological Research, Alkotmány u. 2-4, 15
H-2163, Vácrátót, Hungary 16
4 Óbuda University, Alba Regia Technical Faculty, Budai str. 45, Székesfehérvár H-8000, 17
Hungary 18
5 Department of Botany, Hungarian Natural History Museum, Könyves Kálmán krt. 40, 19
Budapest H-1087 Hungary 20
21
Keywords: Carpathian basin, functional approaches, index, morphological traits, soda pans, 22
Water Framework Directive 23
24 25
74.
26
Abstract 27
28
Shallow, saline inland lakes occur over large areas in Central-Europe and they bear 29
exceptionally high biological conservation values. Climate change and anthropogenic 30
activities threaten their natural conditions, or even their existence. These aquatic ecosystems 31
are exposed to multiple stress like naturally high conductivity, pH and nutrient load with very 32
low transparency for light. As they are subjects of criteria set by the EC Water Framework 33
Directive and biological conservation managment, there is an urgent need for developing a 34
suitable quality index for their ecological status assessment. As one major Biological Quality 35
Element, benthic diatoms may provide a reliable basis for their ecological status indication.
36
Here, in a large data set covering the soda lakes of the Carpathian basin, we developed a 37
species- and a trait-based diatom ecological status index. First, based on the weighted average 38
method, we developed a type specific, species-based diatom index (DISP = Diatom Index for 39
Soda Pans) using conductivity as master variable of environmental constrains; and therefore 40
the ecological status in soda lakes. Furthermore, by adapting and improving further the 41
widely-used diatom ecological guild concept, we also developed an alternative trait-based 42
index, which helps avoiding some limitations arising from the obvious complexity of the 43
taxonomy-based approach. Our DISP index covered a significantly larger species pool for 44
index calculation, and responded to conductivity in a more reliable way compared to other 45
available indices. In the trait-based index (TBI) motility, small cell size, and less roundish, 46
more elongated shape as functional and morphological traits indicated pristine ecological 47
conditions (i.e high conductivity) of the soda pans. Planktic life form, high and low ecological 48
guild profiles, as well as the large cell size indicated worse ecological conditions (e.g. lower 49
conductivity). Our study highlights that benthic diatoms provide a reliable basis for ecological 50
status assessment in soda lakes. While both the taxonomic and the functional trait approaches 51
performed well in our analysis, the success of the trait-based approach may enable the use of 52
our TBI index in biomonitoring and conservation management of soda lakes outside of the 53
Carpahian basin, independently of the geographic location.
54 55 56
74.
Introduction 57
58
Inland saline waters occur at each continent (Williams, 2005). On a European scale, extended 59
saline lake districts are found e.g. in France, Spain, Serbia and Germany. In Hungary, the 60
western margin of the Eurasian steppe zone, saline lakes are found on large areas (1,000,000 61
ha; Szabó, 1997) in two major hydrological basins: in the Duna-Tisza Interfluve, and in the 62
sourrounding area of Neusiedlersee. The general, limnological explanation of development of 63
such lake districts argues that in endorheic drainage basins precipitation and evaporation 64
coequal in the long term, resulting in alkalization on the carbonaceous bedrock (Kalff, 2002).
65
Besides precipitation, saline inland lakes in the Carpathian basin are fed by saline water from 66
deep-layer aquifers (Mádl-Szőnyi and Tóth, 2009). These lakes are gems of the Earth’s lake 67
diversity and they serve as important refugia for biodiversity (e.g. Pálffy et al., 2014; Tóth et 68
al., 2014). From an ecological point of view, these habitats with their extreme environmental 69
characteristics (Boros et al., 2017) impose multiple stress on their biota. Most dries out 70
completely by late summers; others dry out according to ~10-12 year mesoclimatic cycle 71
(Padisák, 1998). Permanent water cover is more of exception than rule. When their basin is 72
filled with water they are alkaline (pH: ~9-10), saline (conductivity may range from ~3,000 to 73
~60,000 µS cm-1) and inorganically very turbid (Secchi transparency is measurable as few 74
centimeters) (Boros et al., 2017). Since they serve as resting places of migratory birds (some 75
species are also nesting), phosphorus load by the waterfowl can result in permanently high TP 76
values (Stenger-Kovács et al., 2014). Such habitats allow only for low-diversity communities 77
(Padisák et al., 2006; Horváth et al., 2014; Stenger-Kovács et al., 2016) due to pronounced 78
environmental selectivity of best adapted taxa to multiple stress conditions. The role of biotic 79
interactions in shaping community structure under such conditions has only minor 80
importance; biotic communities are predominantly controlled by the physical environment 81
(García et al., 1997).
82
Diatoms are abundant and widely distributed from freshwaters to marine ecosystems. The 83
community composition of diatoms is well applicable in ecological status indication due to 84
their high sensitivity to the physical and chemical constraints set by different kinds of natural 85
and human impacts. The use of diatoms as ecological indicators can date back to the 86
beginning of the 20th century (Kolkwitz and Marson, 1908). A number of paleoecological and 87
ecological studies evidenced that diatom species composition indicated well past and current 88
changes in the environment (Stoermer and Smol, 2010). Conductivity and pH are the most 89
74.
important variables determining diatom compositions (Soininen, 2007), and the variability of 90
these parameters changes substantially not only on local but also on continental scale 91
(Soininen et al. 2016).
92
A number of species-based diatom indices have been offered for ecological status 93
assessment. Most of them were developed and tested for river phytobenthos and were 94
included in the software “OMNIDIA” (e.g. IPS, IBD, EPI-D; Coste in Cemagref, 1982-91;
95
Lenoir and Coste, 1996; Prygel and Coste, 2000; Dell’Uomo, 2004). Some of the indicies 96
have been implemented into the ecological status assessment of lakes (Kelly and Whitton, 97
1995, Blanco, 2004, Bolla et al., 2010, Kelly et al., 2006, 2014) according to the requirements 98
of the European Water Framework Directive (EC, 2000). However, diatom indices for lakes 99
are less common and have only been published recently (Jüttner et al., 2010). In Europe, first 100
the trophic diatom index (TI) was developed for German lakes based on alkalinity and trophic 101
status (Hofmann, 1999), and was implemented according to the WFD in Germany 102
(Schaumburg et al., 2004). In Hungary, the trophic diatom index (TDIL) was developed for 103
shallow and freshwater lakes (Stenger-Kovács et al., 2007). Recently, an increasing number 104
of diatom-based ecological analyses appeared for lakes (Crossetti et al., 2013; Kahlert and 105
Gottschalk, 2014; Rimet et al., 2016), but with focus mainly on freshwater and brackish 106
habitats (e.g. Wang et al. 2006., Gell et al. 2002, Della Bella et al. 2007). These indices, 107
however, are „trained” to indicate high salinity levels as a result of human pollution due to 108
e.g. sewage or industrial load, winter de-icing. The same applies for the Halobienindex of 109
Ziemman et al. (1999), which approach has recently been implemented in Hungary applying 110
an inverse scaling (Ács et al., 2015), but without a well-documented testing and details.
111
Furthermore, the reliability of this index is highly questionable based on its poor species pool 112
regarding soda lakes. When any of the aforementioned indices are applied in naturally highly 113
saline habitats such as soda pans, they consistently report intolerable or bad ecological status 114
(Stenger-Kovács et al., 2007). However, paradoxically, the most important harm on such 115
lakes is the artificial freshwater input from alien watersheds, which results in decreasing 116
salinity and in „improved” ecological status indicated by former diatom indices. In this 117
context, the Sodic Conductivity Index for Lakes (SCIL; Ács, 2007) represented a great step 118
forward, since it was able to assess the status of shallow, large, slightly alkaline lakes in a 119
reliable way. Nevertheless, from an ecological and nature conservation point of view, there 120
has been a compelling demand to develop a reliable diatom index for small, high salinity 121
74.
lakes (Stenger-Kovács et al., 2014, Lengyel et al., 2016; Bolgovics et al., 2017) as 122
characteristic landscape components of the Carpathian region (Boros et al., 2013).
123
Based on similar physiologies and functional characteristics of taxa, functional (e.g.
124
guilds) and morphological traits may provide a reliable approach (Stevenson et al., 2010) to 125
complete the traditional ecological indication based on taxonomic approach (Lange et al., 126
2011). On a global scale, diatom species composition may vary significantly among regions, 127
but the guild composition may overlap in a more considerable way. Accordingly, functional 128
approaches may enable us to compare diatom communities with different taxonomical 129
compositions. Diatom guild composition has been found to highly relate to the environment, 130
which approach therefore may enable expressing functional responses of the communities to 131
global environmental changes (Soininen et al. 2016). Following the spread of trait-based 132
approaches in phytoplankton ecology (e.g. Salmaso and Padisák, 2007, Kruk et al., 2010), 133
trait-based ecological status assessments have also been developed for benthic diatoms (e.g.
134
Tapolczai et al., 2017; B-Béres et al., 2017). At present, the diatom trait-based approach is 135
applied principally in running waters (Lange et al., 2016, Trábert et al., 2017, Novais et al., 136
2014), whereas authors mainly related trait-based ecological groups of diatom to major 137
environmental constraints such as nutrients, organic pollution, grazing, shear stress (e.g.
138
Berthon et al., 2011, Lange et al., 2016, Soininen et al., 2016, Tapolczai et al., 2017). As to 139
lakes, the trait-based approach of benthic diatoms has only been applied in very few cases 140
(Gottschalk and Kahlert, 2012; Rimet el al., 2016; Riato et al., 2017; Zorzal-Almeida et al., 141
2017).
142
Our aim was (i) to develop a species-based benthic diatom index for small, shallow, 143
naturally highly saline, alkaline lakes; (ii) adapt and further refine the widely-applied diatom 144
ecological guild concept for diatoms of soda lakes in order to identify relevant traits (e.g.
145
morphological) with clear ecological functions; and finally (iii) to develop a trait-based 146
diatom index, which may substitute the taxonomy-based approach with its some obvious 147
limitations. Here, we use the gradient of conductivity as the main proxy of environmental 148
constraints in soda pans along which changes in the species and functional trait compositions 149
may reflect relevant autecological adaptations and therefore indicate ecological functions.
150
Our hypotheses are that (i) our species-based diatom index performs better than the SCIL 151
index developed for slightly saline lakes; (ii) functional characteristics (e.g. morphological 152
traits, ecological guilds) of diatom taxa alter considerably with conductivity, as proxy for 153
74.
natural vs. degraded conditions; (iii) the trait-based diatom index performs as well or even 154
outperforms our species-based diatom index.
155 156
Material and methods 157
158
Sampling sites, design and laboratory analyses 159
160
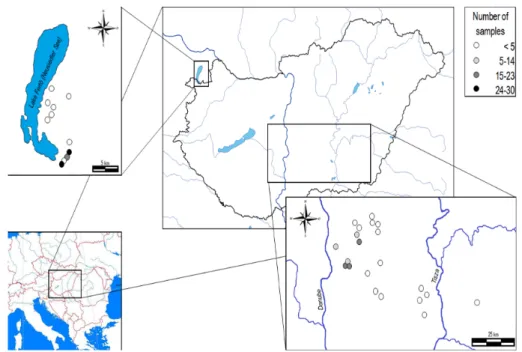
Altogether 338 parallel samples were collected for phytobenthos and water chemical analyses 161
between 2006 and 2015 from 33 soda pans of the Carpathian basin. The sampling time and its 162
frequency depended on the water supply of the lakes (Fig. 1). Diatom samples were collected 163
each time from the characteristic substrates (macrophytes or mud) at the water depth of 5-10 164
cm in the littoral region of the pans. Epiphytic diatoms were collected by toothbrush, while 165
epipelic diatoms by pipetting of ~10 cm3 of superficial layer of the panbed (Cochero et al., 166
2013). Sample collection followed the recommendations of King et al. (2006) and Kelly et al.
167
(2009). Diatom samples were preserved with ethanol and the samples were kept at pH ~7-8 168
by concentrated HCl to avoid the dissolution of the silica walls. For preparation of the 169
samples, the hot hydrogen-peroxid method was applied (Battarbee, 1986), and then diatom 170
valves were embedded in Pleurax®. Permanent slides were analyzed with light (Zeiss 171
Axiovert A1, plan-apochromat lense with DIC) and electron microscopy (Hitachi S-2600N).
172
A minimum of 400 valves were identified to species or even lower taxonomic levels in each 173
sample (Stenger-Kovács and Lengyel, 2015). We used an updated nomenclature for diatoms 174
according to AlgaeBase (Guiry and Guiry 2018). Water chemical parameters such as 175
conductivity, dissolved oxygen, oxygen saturation and pH were measured in situ with a Hach 176
Lange HQD40 multimeter. Soluble reactive silica (SRSi), nitrogen and phosphorus forms, and 177
bicarbonate were determined in laboratory according to international standards (APHA, 1998;
178
Wetzel and Likens, 2000).
179 180
Species-based community analyses 181
182
In a first step of developing a species-based diatom index, transfer function was applied to 183
determine the optimum and tolerance values of the diatom species (Birks, 2010) with >3% in 184
their relative abundance in each sample. Here, to get the best correlation, we used the 185
weighted average method with inverse regression for deshrinking. The model development 186
74.
was based on 187 randomly chosen samples, and then tested on 151 samples using the 187
program C2 version 1.5 (Juggins, 2007). Root mean squared error of the prediction (RMSEP) 188
was calculated directly from the calibration data set. Based on the optimum and tolerance of 189
species, indicator (1-6) and sensitivity values (1-3) were defined (if the species were present 190
at least in 3 samples) following the next scheme:
191
Indicator values: 1: conductivity optima of species ≤ 1999 µS cm-1; 2: 2000 - 2999 µS 192
cm-1; 3: 3000 -3999 µS cm-1; 4: 4000 -4999 µS cm-1; 5: 5000 - 5999 µS cm-1; 6: ≥ 6000 µS 193
cm-1. 194
Sensitivity values: 1 (sensitive): if the tolerance of species for conductivity was ≤ 499 195
µS cm-1; 2 (less sensitive) 500 - 999 µS cm-1; 3 (tolerant): ≥ 1000 µS cm-1. 196
197
For the development of the species-based Diatom Index for Soda Pans (DISP) the 198
Zelinka and Marvan equation (1961) was applied, where ai= relative abundance of the taxon i, 199
si= sensitivity value of the taxon i, and vi= indicator value of the taxon i.
200
𝐷𝐼𝑆𝑃 = *'+,𝑎'𝑠'𝑣' 𝑎'𝑣'
*'
201
The values of the DISP range between 1 and 6 where the higher the values, the better 202
the ecological status.
203
Diatom indices (SCIL = Sodic Conductivity Index [Ács, 2007] and DISP) were 204
calculated with the DilStore software (Hajnal et al., 2009). The relationship between diatom 205
index values and conductivity was assessed by Pearson correlation.
206 207
Ttrait-based community analyses 208
209
Each species was classified into four diatom ecological guilds according to Passy (2007a) and 210
Rimet and Bouchez (2012b) (Table 1). Furthermore, we classified all diatom taxa along two 211
morphological traits based on categories: (i) biovolume according to Rimet and Bouchez 212
(2012), and (ii) length/width ratio (L/W) (Table 1). Dimensions of diatom cells (length, width, 213
thickness) were taken from our own datasets (see. Stenger-Kovács and Lengyel, 2015), where 214
~20 valves of each individual taxon have formerly been measured. Based on average values 215
of length, width and thickness, biovolume was calculated according to Hillebrand et al.
216
(1999). We tested the data for significant differences of L/W categories by ANOVA and post- 217
hoc Tukey multiple comparisons at the level of significance p= 0.05 (Supplement 1).
218
74.
Non-metric multidimensional scaling (NMDS) was conducted using Bray-Curtis 219
dissimilarity index in order to ordinate 15 diatom functional and morphological traits (Table 220
1). By NMDS, we therefore visualized whether samples form ecological groups; i.e. with 221
similar functional characteristics (traits) and therefore with similar ecosystem functions. To 222
this end, a species x samples (n=338) data matrix was converted to binary form of trait x 223
samples data matrix.
224
After Hellinger transformation of the diatom relative abundance data, redundancy analysis 225
(RDA) was run to discover the relationship between environmental factors and the ecological 226
groups defined (G) based on 187 randomly choosen samples. A further RDA analyses was run 227
using the trait composition of the most relevant ecological group characterising soda pans 228
from the first RDA, in order to identify the most important traits of diatoms that can indicate 229
high conductivity ranges, and therefore excellent or good ecological status. The identified 230
traits were then tested along the conductivity gradient using generalised additive models 231
(GAMs) with Gaussian distribution and identity function. GAMs is well-suited for analysing 232
ecological data (Austin, 1987), and they give the relevant responses of the ecological 233
groups/traits to the explanatory variables (conductivity) (Suarez-Seoane et al., 2002).
234
Statistical analyses were carried out in R (R.3.1.2. R Development Core Team, 2014) using 235
the ’vegan’ (Oksanen et al., 2017) and ’mgcv’ (Wood, 2017) packages.
236
Similarly to the Nygaard’s (1956) and the ACID (Acidity index of Diatoms) index 237
(Andrén and Jarlman, 2008), our trait-based index (TBI) was developed using the selected 238
traits in the second RDA and GAMs.
239 240
TBI = log,3 𝑇, + 𝑇6+ ⋯ + 𝑇* + 0.003
𝑇;+ 𝑇<+ ⋯ + 𝑇=+ 0.003 + 4.5 241
242
where T1, T2, … Tn – relative abundance of diatoms under specific traits with strong positive 243
relationship with conductivity. Such traits indicate the good or excellent ecological condition 244
of soda pans; Ta, Tb, … Tm – relative abundance of diatoms under specific traits with strong 245
negative relationship with conductivity. These traits indicate the non-characteristic, degraded 246
ecological status of soda pans.
247
If the denominator is zero, it must be changed to 1 in order to avoid zero logarithm.
248
The index values range between 0 and 9; the higher the values, the better the ecological status 249
indicated.
250
74.
251
Results 252
253
Species-based analyses 254
255
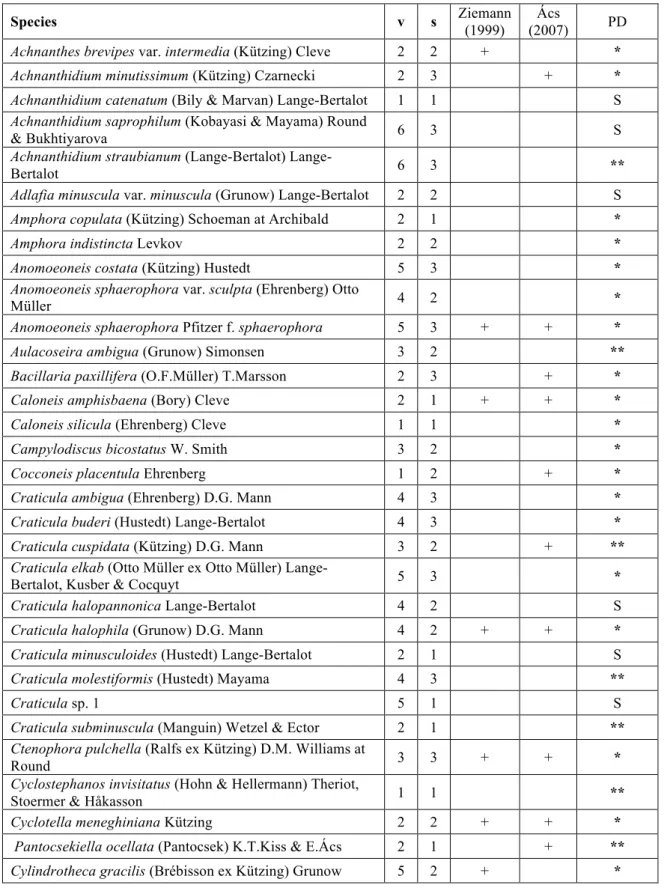
In the conductivity model of soda pans, the correlation was high between the diatom inferred 256
and observed conductivity (r=0.78; RMSEP= 2376 µS cm-1; n=187) (Fig. 2.). The correlation 257
in the test set was close to that observed in the model (r=0.73; n=151). The conductivity 258
optima and tolerance as well as the indicator and sensitivity values were determined for 143 259
dominant species (>3%) of the 194 total species number (Table 2.). Inter alia Surirella 260
hoefleri and Nitzschia bergii indicated extreme high conductivity levels. However, Nitzschia 261
austriaca, Craticula elkab and Cylindrotheca gracilis were also good indicators of high 262
conductivity values. On the other side of the gradient, Entomoneis paludosa var. subsalina, 263
Navicula radiosa, Gomphonema clavatum and some centric diatoms (e.g. Stephanodiscus 264
parvus) were rather associated with freshwater characteristics. After calculation of the two 265
indices (DISP and SCIL) in the test set, the reliability of the indices was obvious. Regarding 266
the SCIL index, the used species number corresponded to 10% and 70% (mean = 37%) of the 267
total available species number, while it was between 77% and 100% (mean = 93%) in the 268
case of DISP. The correlation between these indices and conductivity was significant in both 269
cases, however, the coefficient of determination was higher based on the DISP index than 270
based on the SCIL (Pearson cor.; rDISP-conductivity = 0.69, p< 0.001; rSCIL-conductivity =0.25, 271
p=0.001) (Fig. 3. a, b).
272 273
Trait-based analyses 274
275
The NMDS based on the 15 different traits indicated that some of the traits were highly 276
related to each other. Seven different ecological groups with similar diatom trait 277
characteristics could be distinguished. (Fig. 4a). Group 1 was the planktic guild, Group 2 and 278
3 contained species with the two extreme categories of the L/W ratio (LW1, LW6). Group 4 279
included diatoms from the high profile guild containing LW5 species, which type of species 280
could only be found in this guild. Group 5 involved species from the S4 size class. Group 6 281
represented taxa from the low profile ecological guild. Group 7 was quite diversified 282
74.
including taxa with different traits like: S1, S2, S3, S5, LW2, LW3, LW4 and the motile 283
ecological guild (Fig. 4a).
284
As the result of the RDA analysis of the seven ecological groups (Fig. 4b), Group 7 285
separated clearly and was connected to those features, which are typical for the naturally state 286
of soda pans (like elevated conductivity, pH, bicarbonate and nutrient concentration). Other 287
groups located on the opposite side of the RDA triplot indicated less saline conditions (Fig.
288
4b). Among seven different traits inside Group 7, in a subsequent RDA (Fig. 4c) showed, that 289
the motile ecological guild with three characteristic morphological traits (S1, LW2, LW3) as 290
Subgroup 1 were connected to the basically pristine features of our soda pans (Fig. 4c).
291
For the seven ecological groups defined by NMDS, and for the Subgroup 1 separated in 292
the RDA (Table 3), the GAMs revealed that the conductivity had significant negative effect 293
on the Groups 1, 4, 5, and 6; however, the explained variance was higher (17.3%) and p-value 294
was lower (p< 0.001) when these groups were merged (Table 3., Fig. 5a). There was no 295
significant relationship between the Group 2, 3 and conductivity. On the other hand, the 296
conductivity had a significant positive effect on Group 7, however, the explained variance 297
was higher (23.1%) in the case of the Subgroup 1 (Table 3., Fig. 5b).
298
Trait-based index was developed based on the results of the GAMs:
299 300
TBI = log,3 𝑆𝐺1 + 0.003
𝐺1 + 𝐺5 + 𝐺4 + 𝐺6 + 0.003 + 4.5 301
302
with the substitution of the different traits, the equation is the next:
303 304
TBI = log,3 𝑀𝑆1 + 𝑀𝐿𝑊2 + 𝑀𝐿𝑊3 + 0.003
𝑃 + 𝑆4 + 𝐻 + 𝐿 + 0.003 + 4.5 305
306
where, in the numerator:
307
MS1: relative abundance of motile diatom species with biovolume < 100 µm3 308
MLW2: relative abundance of motile diatom species with LW2 ratio (2 ≤ Length/Width < 4) 309
MLW3: relative abundance of motile diatom species with LW3 ratio (4 ≤ Length/Width < 6) 310
in the denominator (in settling order!):
311
P: relative abundance of diatoms under the planktic ecological guild 312
S4: relative abundance of diatom species with biovolume between 600 µm3 and 1500 µm3) 313
independently of their ecological guild classification 314
74.
H: relative abundance of diatoms under the high profile ecological guild 315
L: relative abundance of diatoms under the low profile ecological guild 316
In the test set, the TBI index showed significant postive correlation with conductivity 317
(Pearson cor., rTBI-conductivity=0.64, p<0.001) (Fig. 3c). Its correlation was almost similar to the 318
correlation between the DISP index and conductivity (Pearson cor., rDISP-conductivity=0.69, 319
p<0.001) (Fig. 3b). The two indices (species-based [DISP] and trait-based index [TBI]) 320
correlated positively and significantly with each other (Pearson cor., rDISP-TBI=0.75, p<0.001) 321
(Fig. 3d).
322 323 324
Discussion 325
326
Traditional, species-based method (DISP index) 327
328
Inland saline lakes represent a challenge for scientific research, nature conservation and 329
management on international level (Timms, 2005). In the Carpathian basin, they are unique 330
(Padisák et al., 2006) and strictly protected in terms of legislation. Most of them are subject of 331
ecological status assessment by recommendations of Biological Quality Elements (BQE) of 332
the EC Water Freamework Directive. Harmonization of conservation request and those of the 333
WFD called for the development of specific indicator/sensitivity values of diatoms 334
characteristic in these environments. On the basis of conductivity model, optima and 335
tolerances were defined for 143 diatom species of these special, low diversity ecosystems 336
(Stenger-Kovács et al., 2016); and now applied in the newly developed species-based index 337
(DISP). The advantages of the DISP index is that it is type specific (applicable in lowland, 338
high salinity, <10 km2, shallow [<3m depth] lakes with astatic water regime), and able to 339
reflect the naturally high conductivity as a positive ecological characteristic of these lakes.
340
The species pool of DISP is significantly larger than of the potentially available former 341
indices (Ziemman et al., 1999, Ács, 2007). The usability of the Ziemann system by an 342
inversed scaling — which has recently been implemented in Hungary (Ács et al., 2015) — as 343
well as the SCIL index (Ács, 2007) is highly limited: species pool of these indices hardly 344
overlap with those of the soda pans (24 in the Ziemann system, 63 in the SCIL index). This 345
highlights clearly that ecological status based on former indices could not be evaluated in a 346
reliable way. Moreover, the relationship of our DISP index with conductivity as a master 347
74.
variable of ecological status of soda lakes appeared also to be much stronger. Furthermore, a 348
complete photo documentation about all species involved in our index is also available (see 349
Stenger-Kovács et al., 2015; Lengyel, 2017; supplementary of the present study [Supplement 350
2]) for the “analysts” (biologists, assistants).
351
The usefulness of the traditional taxonomy-based indices with refined taxonomic 352
resolutions cannot be questioned (Rimet and Bouchez, 2012a). However, they require time 353
and expansive expertise with obvious limitations, disadvantages and uncertainties. These may 354
include misidentification, availability of the continuously changing and exhaustive taxonomic 355
literature, the elimination of rare species from statistical analyses, different expertise among 356
labs, and different species compositions among ecoregions (Kahlert et al., 2012; Tapolczai et 357
al., 2016, 2017). This huge effort taken, however, might be further constrained in ecological 358
status assessments (Kelly, 2013). On the other hand, common DNA-based approaches 359
develop fast in precision (Zimmermann et al., 2015; Leese et al., 2016). However, the 360
ecological context for DNA-based approaches still remains to be explored. Accordingly, trait- 361
based approaches may provide a “bridge” as potential solution for such difficulties.
362 363
Application of functional approaches (TBI index), and the ecological meaning of the trait 364
community composition 365
366
The use of trait-based measures in ecological status assessments might potentially be 367
favoured since they are related to functional properties of the biological elements of 368
ecosystems directly (Larras et al., 2017). Initially, trait-based approaches have been suggested 369
complementary (Bayona et al., 2014, Trábert et al., 2017, Algarte et al., 2017) since they are 370
relatively rapid and simple (Algarte et al., 2017). Functional approaches may also enhance our 371
ability in predicting the community composition from the environment (Mc Gill et al., 2006, 372
Abonyi et al., 2018); also in context of ecological indication. Developing trait-based 373
approaches in freshwater (e.g. Schwaderer et al., 2011), marine (e.g. Edwards et al., 2013) and 374
terrestrial (e.g. Diaz et al., 2013) ecosystems is a recent trend in ecology. The number of 375
studies using trait-based approaches in benthic algal communities has been rapidly increasing 376
(e.g. Gottschalk and Kahlert, 2012, Rimet et al., 2016, Riato et al., 2017, Zorzal-Almeida et 377
al., 2017). The first multimetric trait-based indices of benthic diatoms were developed without 378
the geographical extension to Europe (Potapova and Carlisle, 2011; Tapolczai et al., 2017).
379
By applying functional systems, uncertainties in species-based approaches may be avoided 380
74.
completely (Tapolczai et al., 2017) and the differences of taxonomic expertise of investigators 381
or the change in investigator do not have crucial consequences on ecological status 382
assessments (Hajnal and Padisák, 2008; Salmaso et al., 2015). Some useful traits, e.g.
383
morphological ones can be measured relatively easily (B.-Béres et al. 2017); whereas the trait- 384
based ecological classifications (e.g. ecological guilds, functional groups) may further 385
simplify the understanding of mechanisms underlying community compositions (Salmaso et 386
al., 2015).
387
Trait-based assessments ideally contain multiple traits, not only e.g. growth forms to 388
understand main variables in determining the community composition (Lange et al., 2016).
389
The application of small number of ecological guilds (e.g. in Passy, 2007a) may not be 390
sensitive enough to follow all relevant changes of the environment (B.-Béres et al., 2014). In 391
phytoplankton research, multiple morphological, physiological and behavioral traits have also 392
been identified as key factors regulating success in the community composition (see Litchman 393
et al., 2007). In benthic algal research, the first similar approach was the application of eco- 394
morphological functional groups (combination of diatom ecological guilds and cell sizes; in 395
B.-Béres et al., 2016). Combined ecological groups of diatoms provided strong relationships 396
with environmental variables in multiple cases (B.-Béres et al., 2016, Tapolczai, 2017, Wang 397
et al., 2018). One weakness of the existing trait-based classifications is that their data sets are 398
based only on few sampling sites (B.-Béres et al., 2016), or on limited number of taxa (Lange 399
et al., 2016; B.-Béres et al., 2016). In developing our trait-based diatom index, these 400
disadventages were avoided. Here we used a multiple trait approach (15 functional and 401
morphological traits), while former studies applyed simple trait combinations (B.-Béres et al., 402
2016; Tapolczai et al., 2016). Traits ideally represent specific environmental drivers (Petchey 403
and Gaston, 2006); therefore, we identified traits responding to the main environmental 404
drivers collectively. In saline ecosystems, conductivity is the master environmental variable 405
representing an overall ecological status (Stenger-Kovács et al., 2014). The ecological groups 406
associated with high conductivity and therefore the “pristine” ecological status may consist of 407
motile diatom species with small cell size (MS1) and less roundish, more elongated shapes 408
(MLW2, MLW3). Nitzschia austriaca, N. aurariae, Craticula elkab, Halamphora dominici 409
are some examples for the representatives of MS1. MLW2 species were e.g. Anomoeoneis 410
sphaerophora, Craticula ambigua and Staurophora wislouchii. In contrast Halamphora kevei, 411
Nitzschia salinarum and Navicula wiesneri dominated among other species in MLW3. Our 412
examples also confirm that for a given functional trait, examples from both phylogenetically 413
74.
close and distant species can be found (Tapolczai et al., 2016). Accordingly, the functional 414
role identified may potentially be independent from the taxonomic position of diatom taxa.
415
On a global scale, the motile diatom guild is the most species rich group. Its richness 416
may show a strong positive relationship with the concentration of nutrients (Soininen et al.
417
2016), organic matter and turbidity (Tapolczai et al., 2017). Species belonging to this guild 418
are good competitors in resource-rich habitats (Van der Grinten et al., 2004, Lange et al., 419
2011) with stable nutrient availability (Soininen, 2007) without marked seasonality (Trábert et 420
al., 2017). Motility of diatoms represents an important function in habitats with fine 421
sediments, and an applicable indicator of siltation and land use of running waters (Stevenson 422
et al., 2010; Smucker and Vis, 2010). They are characteristic in lakes under stable 423
hydrodynamic conditions (Algarte et al., 2017); and in parallel with water abstraction, their 424
relative abundance increases at high farm intensity (Lange et al., 2011). Therefore, besides the 425
high salinity, all characteristic features of the soda pans such as high nutrient content, 426
turbidity, the decreasing water level, or the temporary drying phases support the dominance of 427
diatoms with characteristic functional traits in this guild. However, one single trait alone can 428
also be in strong correlation with salinity and conductivity (Kókai et al., 2015). Our finding 429
therefore may show that functional and morphological traits can respond to conductivity in a 430
highly inter-connected way, supporting a multi-trait functional approach in diatom research.
431
However, the question remains that what is the meaning of characteristic 432
morphological traits of motile diatom species. Beside of the wide range covered by algal 433
biovolumes (Tapolczai et al., 2017), the size is the easiest measurable feature of diatom 434
species with several possible ecological meanings (Tapolczai et al., 2016). Body size 435
influences the distribution of diatoms (Heino and Soininen, 2006; Passy, 2008), since small 436
species have higher dispersal rates (Passy, 2012). Large species are rather sensitive for 437
physical disturbances, in contrast to smaller ones with greater resilience (Passy, 2007b).
438
Diatoms may also respond to environmental factors differently based on their cell sizes. The 439
salinity has unequivocally significant effect on the size and surface area of the cell (Snoeijs et 440
al., 2002, Neustupa et al., 2013). High conductivity soda pans impose high osmotic stress on 441
algal cells; therefore, small size may be a physiological adaptation similar to the reduction of 442
the surface area and pore size of the diatom valves under elevated salinity levels (Leterme et 443
al., 2010). The function of this morphological trait can also be linked to other characteristics 444
of the pans. Large species may have competitive advantage under higher light availability 445
(Lange et al., 2011), while e.g. in afforested streams, small species may dominate with a more 446
74.
simple community structure (Cibils-Martina et al., 2017); similarly to communities of soda 447
pans. Motile species with small cell size (S1) might hide easily among inorganic particles of 448
mud in the drying period of lakes; similarly to cases observed in sedimanteted, drying streams 449
(Lange et al. 2016).
450
Until now, elongated taxa with small L/W ratio were reported only from polluted 451
habitats under high shear stress (Tapolczai et al., 2017). However, the shape of MLW2, 452
MLW3 (less roundish, more elongated) indicated well the level of conductivity. A study on 453
the photosynthetic activity of a Nitzschia species as one representative of this group showed 454
outstandingly high conductivity optima (8599 µS cm-1; Lengyel et al., 2015). Furthermore, 455
this less roundish, more elongated shape similarly to small cell size may facilitate hiding 456
among mud particles, or to move among sediment particles. Another potential mechanism 457
underlying such functional characteristic in turbid environments is that elongated cells might 458
serve as antenna/lighttrap in light-limited habitats.
459
In our study, S4 size as individual morphological trait appeared to indicate the worse 460
ecological condition of the pans. In the low conductivity range (more freshwater habitats), the 461
S4 size was connected to functional traits within the high, low, and motile ecological guilds.
462
The abundance of diatoms under the LS4 and HS4 groups increased with decreasing 463
conductivity, and the amount of LS4 and MS4 taxa were higher under higher pH (B.-Béres et 464
al., 2016, 2017). Consequently, it seems that size S4 has alone ecological meaning 465
independently of its ecological guild classification. Diatom species of size S4 may therefore 466
prefer waters with low conductivity and high pH, which conditions in soda pans may 467
characterize deteriorated ecological conditions.
468
The motile diatom ecological guild with special morphological features was 469
representative for the excellent or good ecological status of the soda pans. However, other, 470
well-known functional traits (planktic life form, high and low profile ecological guilds) may 471
indicate lower conductivity values, similarly to S4 size. Trábert et al. (2017) showed already 472
that the relative abundance of diatom taxa under the high profile and motile guilds correlated 473
with each other negatively in lotic systems. The abundance of diatoms belonging to the high 474
profile guild is not directly related to the nutrient level, rather to other habitat factors 475
(Soininen et al. 2016) like high light intensity (Trábert et al., 2017). The dominance of low 476
profile diatom taxa is characteristic in temporary and permanent water courses with frequent 477
disturbance events and low nutrient content (Novais et al., 2014). Our analyses also showed 478
74.
that the separation of planktic taxa into an individual ecological guild has relevant ecological 479
meaning; as suggested formerly by Rimet and Bouchez (2012b) and B.-Béres et al. (2017).
480 481
Summary 482
483
Naturally saline soda lakes are unique habitats in the Carpathian basin, and also in other 484
regions. Their ecology-based management requires the development of ‘easy to use’, but 485
reliable indices for local specialists, stakeholders, and policy makers. We showed that 486
community composition of benthic diatoms enabled the development of such indices based 487
both on the taxonomic and functional approaches.
488
The reliable identification of ecological funtions is the basis of functional approaches, 489
which then may successfully be used in applied fields like ecological status assessment. Our 490
study adapted and further improved a widely-used functional approach, the diatom ecological 491
guild concept to naturally shallow, saline ecosytems. Our refined functional classification 492
made possible to identify relevant functional characteristics, indicating natural (high salinity) 493
vs. degraded (low salinity) ecological conditions in a meaningful way.
494
While both taxonomy and functional characteristics of benthic diatoms performed well 495
in ecological status indication in our case, the trait-based approach based on simple 496
morphological characteristics - ‘easy to use’ - may better fulfill cost and time efficiency, a 497
feature highly required in biomonitoring. Therefore, the successful application of our trait- 498
based benthic diatom index may not be restricted to the Carpathian basin, rather can be 499
applied in biomonitoring and conservation management of soda lakes independently of the 500
geographic location.
501 502
Acknowledgement 503
504
We thank Attila Pellinger, Dr. András Ambrus, Gábor Takács, Péter Kugler (Fertő-Hanság 505
National Park), Tamás Sápi, Dr. Csaba Pigniczki, Sándor Kovács (Kiskunság National Park) 506
for their help in the field. We acknowledge the contribution of colleagues of Department of 507
Limnology, University of Pannonia for their technical assistance in the laboratory analyses of 508
environmental variables. This study was financed by the National Scientific Research 509
Foundation (OTKA K81599), the National Research Development and Innovation Office 510
(NKFIH K120595 and NKFIH K119208), the Széchenyi 2020 under the EFOP-3.6.1-16- 511
74.
2016-00015 and the European Regional Development Fund (GINOP-2.3.2-15-2016-00019).
512
András Abonyi was supported by the National Research, Development and Innovation Office 513
(NKFIH PD 124681).
514 515 516
References 517
Abonyi, A., Horváth, Z., Ptacnik, R., 2018. Functional richness outperforms taxonomic 518
richness in predicting ecosystem functioning in natural phytoplankton communities.
519
Freshwater Biol. 63(2), 178–186.
520
Algarte, V.M., Pavan, G., Ferrari, F., Ludwig, T.A.V., 2017. Biological straits of diatoms in 521
the characterisation of a reservoir and stream in a subtropical region. Braz. J. Bot. 40, 522
137-144.
523
Andrén, C., Jarlman, A., 2008. Benthic diatoms as indicators of acidity in streams. Fundam.
524
Appl. Limnol. 173, 237-253.
525
[APHA] American Public Health Association., 1998. Standard methods for the examination 526
of water and wastewater. Baltimore (MD): United Book Press.
527
Austin, M.P., 1987. Models for the analysis of species response to environmentalgradients.
528
Vegetatio. 69, 35–45.
529
Ács, É., 2007. A Velencei-tó bevonatlakó algáinak tér- és időbeli változása, kapcsolata a tó 530
ökológiai állapotával. Acta Biol. Debr. Oecol. Hung. 17, 9-111.
531
Ács, É., Borics, G., Boda, P., Csányi, B., Duleba, M., Englone,r A., Erős, T., Földi, A., 532
Grigorszky, I., György, Á.I., Kiss, K. T., Szilágyi, E., Lukács, B.A., Nagy-László, Zs., 533
Pozderka, V., Sály, P., Szalóky, Z., Szekeres, J., Trábert, Zs., Várbíró, G., 2015.
534
Magyarország felszíni vizeinek ökológiai állapotértékelő módszerei. Magyar Kémikusok 535
Lapja. 70, 374-380.
536
Battarbee, R. W., 1986. Diatom analysis. In Berglund, BE (ed) Handbook of Holocene 537
palaeoecology and palaeohydrology, Chichester: Wiley, pp. 527-570.
538
Bayona, Y., Roucaute, M., Cailleaud, K., Lagadic, L., Basseres A., Caquet, T., 2014.
539
Structural and biologiacal trait responses of diatom assembalges to organic chemical in 540
outdoor flow-through mesocosms. Environ. Pollut. 192, 186-195.
541
74.
B.-Béres, V, Török, P., Kókai, Z., Krasznai, E. T., Tóthmérész, B., Bácsi, I., 2014. Ecological 542
diatom guilds are useful but not sensitive enough as indicators of extremely changing 543
water regimes. Hydrobiologia. 738, 191-204.
544
B.-Béres V., Lukács, Á., Török, P., Kókai, Z., Novák, Z., Enikő, T., Bácsi, I., 2016.
545
Combined eco-morphological functional groups are reliable indicators of colonisation 546
processes of benthic diatom assemblages in a lowland stream. Ecol. Indic, 64, 31-38.
547
B.-Béres, V.,Török, P., Kókai, Z., Lukács, Á., Enikő, T., Tóthmérész, B., Bácsi, I., 2017.
548
Ecological background of diatom functional groups: Comparability of classification 549
systems. Ecol. Indic. 82, 183-188.
550
Berthon, V., Bouchez, A, Rimet, F., 2011. Using diatom lifeforms and ecological guilds to 551
assess organic pollution and trophic leveli n rivers: a case study of rivers in soth eastern 552
France. Hydrobiologia. 673, 259-271.
553
Birks, H. J. B., 2010. Numerical methods for the analysis of diatom assemblage data. The 554
diatoms: applications for the environmental and earth sciences, 2nd edn. Cambridge 555
University Press, Cambridge, pp. 23-54.
556
Blanco, S., Ector, L., Bécares, E., 2004. Epiphytic diatoms as water quality indicators in 557
Spanish shallow lakes. Vie Milieu. 54, 71-80.
558
Bolgovics, Á; Ács, É; Várbíró, G., Görgényi, J.; Kiss, K.T.; Földi, A.; Nagy-László, Zs., 559
Trábert, Zs.; Borics, G., 2017. Benthic diatom-based lake types in Hungary. Fundam.
560
Appl. Limnol. 189, 105-116.
561
Bolla, B., Borics, G., Kiss, K. T., Reskóné, N.M., Várbíró, G., Ács, É., 2010.
562
Recommendations for ecological status assessment of Lake Balaton (largest shallow 291 563
lake of Central Europe), based on benthic diatom communities. Vie Milieu. 60,197-208.
564
Boros, E., Ecsedi, Z., Oláh, J., 2013. Ecology and management of soda pans in the Carptahian 565
basin. Hortobágy Environmental Association, Balmazújváros, pp 551.
566
Boros, E., V-Balogh, K., Vörös, L., Horváth ,Zs., 2017. Multiple extreme environmental 567
conditions of intermittent soda pans in the Carpathian Basin (Central Europe).
568
Limnologica. 62, 38-46.
569
74.
Cemagref, 1982-1991. Etude des méthodes biologiques quantitative d’appréciation de la 570
qualité des eaux. Rapport Q.E. Lyon-A.F. Bassin Rhone-Méditerranée-Corse, Lyon, 571
France.
572
Cibils-Martina, L., Principe, R. E., Márquez, J.A, Gari, E.N., Albariño, R.J., 2017. Succession 573
of algal communities in headwaters: a comparison of pine afforested and natural 574
grassland streams. Ecol. Res. 32, 423-734.
575
Cochero, J., Romaní, A. M., Gómez, N. 2013. Delayed response of microbial epipelic biofilm 576
to nutrient addition in a Pampean stream. Aquat. Microb. Ecol. 69, 145-155.
577
Crossetti, O. L., Stenger-Kovács, C., Padisák, J., 2013. Coherence of phytoplankton and 578
attached diatom-based ecological status assessment in Lake Balaton. Hydrobiologia. 716, 579
87–101.
580
Díaz, S., Purvis, A., Cornelissen, J. H., Mace, G. M., Donoghue, M. J., Ewers, R. M. Pearse, 581
W. D., 2013. Functional traits, the phylogeny of function, and ecosystem service 582
vulnerability. Ecol. Evol. 3, 2958-2975.
583
Della Bella, V., Puccinelli, C., Marcheggiani, S., Mancini, L., 2007. Benthic diatom 584
communities and their relationship to water chemistry in wetlands of Central Italy. Ann.
585
Limnol. Int. J. Lim. 43: 89-99.
586
Dell’Uomo, A., 2004. L’indice diatomico di eutrofizzazione/polluzione (EPI-D) nel 587
monitoraggio delle acque correnti. Linee guida.
588
EC Parliament and Council, 2000. Directive of the European Parliament and of the Council 589
2000/60/EC establishing a framework for community action in the field of water policy.
590
European Commission PE-CONS 3639/1/100 Rev 1, Luxembourg.
591
Edwards, K.F., Litchman, E., Klausmeier, C.A., 2013. Functional traits explain phytoplankton 592
community structure and seasonal dynamics in a marine ecosystem. Ecol. Lett. 16, 56-63.
593
García, C. M., R. García-Ruiz, M. Rendón, F. X. Niel, L, Lucena, J., 1997. Hydrological 594
cycle and interannual variability of aquatic community in a temporary saline lake (Fuente 595
de Piedra, Southern Spain). Hydrobiologia. 345, 131-141.
596
Gell, P., Sluiter, I.R., Fluin, J., 2002. Seasonal and interannual variations in diatom 597
assembalges in Murray River connected wetlands in north-west Victoria, Australia. Mar.
598
Freshw. Res. 53, 981-992.
599
74.
Gottschalk, S., Kahlert, M.. 2012. Shift sin taxonomical and guild composition of littoral 600
diatom assemblages along environmental gradients. Hydrobiologia. 694, 41-56.
601
Guiry, M.D., Guiry, G.M., 2018. AlgaeBase. World-wide electronic publication, National 602
University of Ireland, Galway. http://www.algaebase.org; searched on 09 February 2018.
603
Hajnal, É., Padisák, J., 2008. Analysis of long-term ecological status of Lake Balaton based 604
on the ALMOBAL phytoplankton database. Hydrobiologia. 599, 227-237.
605
Hajnal, É., Stenger-Kovács, C., Ács, É., Padisák, J., 2009. DILSTORE software for ecological 606
status assessment of lakes based on benthic diatoms. Fottea. 9, 351-354.
607
Heino, J., Soininen, J., 2006. Regional occupancy in unicellular eukaryotes: a reflection of 608
niche breadt, habitat availability, or size-related dispersal capacity? Freshwater Biol. 51, 609
672-685.
610
Hillebrand, H., Durselen, C. D., Kirschtel, D., Pollingher, U., Zohary T., 1999. Biovolume 611
calculation for pelagic and benthic microalgae. J. Phycol., 35, 403–424.
612
Hofmann, G., 1999. Trophiebewertung von Seen anhand von Aufwuchsdiatomeen. In:
613
Tümpling, W. Von and Friedrich, G. (eds) Biologische Gewasseruntersuchung 2, pp.
614
319-333.
615
Horváth, Z., Vad, C. F., Tóth, A., Zsuga, K., Boros, E., Vörös, L., Ptacnik, R., 2014.
616
Opposing patterns of zooplankton diversity and functioning along a natural stress 617
gradient: when the going gets tough, the tough get going. Oikos. 123, 461-471.
618
Juggins, S., 2007. C2 user guide. Software for ecological and paleoecological data analysis 619
and visualisation. User guide version 1.5. University of New Castle, UK., pp. 73.
620
Jüttner, I., Chimonides, P. J., Ormerod, S. J., 2010. Using diatoms as quality indicators for a 621
newly-formed urban lake and its catchment. Environ. monit. assess. 162, 47-65.
622
Kahlert, M., Gottschalk, S., 2014. Differences in benthic diatom assemblages between 623
streams and lakes in Sweden and implications for ecological assessment. Freshwater Sci.
624
33, 655-669.
625
Kahlert, M., Kelly, M., Albert, R. L., Almeida, S. F., Bešta, T., Blanco, S., Coste, M., Denys, 626
L., Ector, L., Fránková, M., Hlúbiková, D., Ivanov, P., Kennedy, B., Marvan, P., 627
Mertens, A., Miettinen, J., Picinska-Fałtynowicz, J., Rosebery, J., Tornés, E., Vilbaste, S., 628
74.
Vogel, A. Hlúbiková, D., 2012. Identification versus counting protocols as sources of 629
uncertainty in diatom-based ecological status assessments. Hydrobiologia. 695, 109-124.
630
Kalff, J., 2002. Limnology. Inland Water Ecosystems. Prentice Hall, Upper Saddle River, 631
New Jersey, pp. 592.
632
Kelly, M., 2013. Data rich, information poor? Phytobenthos assessment and the Water 633
Framework Directive. Eur. J. Phycol. 48, 437-450.
634
Kelly, M. G., Bennion, H., Burgess, A., Ellis, J., Juggins, S., Guthrie, R., Jamieson, J., 635
Adriaenssens, V., Yallop, M., 2009. Uncertainty in ecological status assessments of lakes 636
and rivers using diatoms. Hydrobiologia. 633, 5-15.
637
Kelly, M. G., Juggins, S., Bennion, H., Burgess, A., Yallop, M., Hirst, H., King, J., Jamieson, 638
J., Guthrie, R., Rippey, B.. 2006. Use of diatoms for evaluating ecological status in UK 639
freshwaters. Environment Agency, Bristol.
640
Kelly, M. G., Whitton, B.A. 1995. The trophic diatom index: a new index for monitoring 641
eutrophication in rivers. J. Appl. Phycol. 7, 433-444.
642
Kelly, M., Urbanic, G., Acs, E., Bennion, H., Bertrin, V., Burgess, A., Kennedy, B., 2014.
643
Comparing aspirations: intercalibration of ecological status concepts across European 644
lakes for littoral diatoms. Hydrobiologia. 734, 125-141.
645
King, L., Clarke, G., Bennion, H., Kelly, M., Yallop, M., 2006. Recommendations for 646
sampling littoral diatoms in lakes for ecological status assessments. J. Appl. Phycol. 18, 647
15-25.
648
Kolkwitz, R., Marsson, M.. 1908. Ökologie der pflanzlichen Saprobien. Ber. Dtsch. Bot. Ges.
649
26, 505-519.
650
Kókai, Zs., Bácsi, I., Török, P., Buczkó, K., T-Krasznai, E., Balogh, Cs., Tóthmérész, B, B- 651
Béres, V., 2015. Halophilic diatom taxa are sensitive indicators of even short term 652
changes in lowland lotic systems. Acta Bot. Croat.74, 287-302.
653
Kruk, C., Huszar, V. L., Peeters, E. T., Bonilla, S., Costa, L., Lürling, M., Scheffer, M., 2010.
654
A morphological classification capturing functional variation in phytoplankton.
655
Freshwater Biol. 55, 614-627.
656
74.
Lange, K., Liess, A., Piggott, J.J., Townsend, C.R., Matthaei, C.D., 2011. Light, nutrients and 657
grazing ineract to determine stream diatom community composition and functional group 658
structure. Freshwater Biol. 56, 264-278.
659
Lange, K., Townsend, C. R., Matthaei, C. D., 2016. A trait-based framework for stream algal 660
communities. Ecol. evol. 6, 23-36.
661
Larras, F., Coulaud, R., Gautreau, E., Billoir, E., Rosebery, J., Usseglio-Polatera, P., 2017.
662
Assessing anthropoghenic pressures on streams: A random forest approach based on 663
benthic diatom communities. Sci. Total. Environ. 586, 1101-1112.
664
Lengyel, E., 2017. Stress and disturbance in benthic diatom assemblages. PhD dissertation.
665
University of Pannonia, Veszprém, Hungary. 123 pp. http://konyvtar.uni- 666
pannon.hu/doktori/2016/Lengyel_Edina_dissertation.pdf (16.02.2018) 667
Lengyel, E., Kovács, W. A., Padisák, J., Stenger-Kovács, C., 2015. Photosynthetic 668
characteristics of the benthic diatom species Nitzschia frustulum (Kützing) Grunow 669
isolated from a soda pan along temperature-, sulfate- and chloride gradients. Aquat. Ecol.
670
49, 401-416.
671
Lengyel, E., Padisák, J., Hajnal, É., Szabó, B., Pellinger, A., Stenger-Kovács, C., 2016.
672
Application of benthic diatoms to assess efficiency of conservation management: a case 673
study on the example of three reconstructed soda pans, Hungary. Hydrobiologia. 777, 95- 674
110.
675
Lenoir, A., Coste, M., 1996. Development of a practical diatomic index of overall water 676
quality applicable to the French National Water Board Network. In: Rott, E. (ed.) 2nd 677
Workshop on Algae for Monitoring Rivers, Innsbruck 18-19 Sept. 95, Studia Student.
678
G.m.b.H., Innsbruck.
679
Leese, F., Altermatt, F., Bouchez, A., Ekrem, T., Hering, D., Meissner, K., Mergen, P., 680
Pawlowski, J., Piggott, J.J., Rimet, F. et. al., 2016. DNAqua-Net: Developing new 681
genetic tools for bioassessment and monitoring of aquatic ecosystems in Europe. Res.
682
Ideas Outcomes pp. 24. doi: 10.3897/rio.2.e11321 683
Leterme, S.C., Ellis, A.V., Mitchell, J.G., Buscot, M.J., Pollet, T., Schapira, M., Seuront, L., 684
2010. Morphological flexibility of Cocconeis placentula (Bacillariophyceae) 685
nanostructure to changing salinity levels. J. Phycol. 46,715–719.
686
74.
Litchman, E., Klausmeier, C.A., Schofield, O.M., Falkowski, P.G., 2007. The role of 687
functional traits and trade-offs in structuring phytoplankton communities: scaling from 688
cellular to ecosystem level. Ecol. Lett. 10, 1170-1181 689
Litchman, E., Klausmeier, C.A., 2008. Trait-based community ecology of phytoplankton.
690
Annu Rev Ecol Evol. 39, 615-639.
691
Mádl-Szőnyi, J., Tóth, J., 2009. A hydrogeological type section for the Duna-Tisza Interfluve, 692
Hungary. Hydrogeol J. 17, 961-980.
693
McGill , N.J., Enquist, B.J., Weither, E., Westoby, M., 2006. Rebuilding community ecology 694
from functional traits. Trends Ecol. Evol. 21, 178-185.
695
Neustupa, J., Veselá, J., Št’astný, J., 2013. Differential cell size structure of desmids and 696
diatoms in the phytobenthos of peatlands. Hydrobiologia. 709, 159-171.
697
Novais, M. H., Morais, M. M., Rosado, J., Dlas, L S., Hoffmann, H., Ector L., 2014. Diatoms 698
of temporary and permanent watercourses in Southern Europe (Portugal). River Res.
699
App. 30, 1216-1232.
700
Nygaard, G., 1956. Ancient and recent flora of diatoms and Chrysophyceae in Lake 701
Gribsö. Studies on the humic acid Lake Gribsö. Folia Limnol. Scand. 8, 32-94.
702
Oksanen, J., F. Blanchet, G., Friendly, M., Kindt, R., Legendre, P., McGlinn, D., Minchin,P.
703
R., O'Hara, R. B., Gavin, L. Simpson, Solymos, P., M. Stevens, H. H., Szoecs, E., 704
Wagner, H., 2017. Package vegan. The community ecology package. https://cran.r- 705
project.org/package=vegan 706
Padisák, J., 1998. Sudden and gradual responses of phytoplankton to global climate change:
707
case studies from two large, shallow lakes (Balaton, Hungary and the Neusiedlersee 708
Austria/Hungary). In D. G. George, J. G. Jones, P. Puncochar, C. S. Reynolds and D. W.
709
Sutcliffe (eds.), Management of lakes and reservoirs during global change., Kluwer Acad.
710
Publ., Dordrecht, Boston. London, pp. 111-125.
711
Padisák, J., Ács, É., Borics, G., Buczkó, K., Grigorszky, I., Kovács, C., Mádl-Szőnyi, J., 712
Soróczki-Pintér, É., 2006. A Víz Keretirányelv és a vízi habitatdiverzitás konzerváció 713
biológiai vonatkozásai. M. Tud. 167, 663-669.
714
74.
Pálffy, K., Felföldi, T., Mentes, A., Horváth, H., Márialigeti, K., Boros, E., Vörös, L., B.
715
Somogyi, B., 2014. Unique picoeukaryotic algal community under multiple 716
environmental stress conditions in a shallow, alkaline pan. Extremophiles. 18, 111–119.
717
Passy, S. I., 2007a. Diatom ecological guilds display distinct and predictable behavior along 718
nutrient and disturbance gradients in running waters. Aquat. Bot. 86, 171-178.
719
Passy, S. I., 2007b. Differential cell size optimization strategies produce distinct diatom 720
richness–body size relationships in stream benthos and plankton. J. Ecol. 95, 745-754.
721
Passy, S. I. 2008. Species size and distribution jointly and differentially determine diatom 722
densities in U.S. Streams. Ecol. 89, 475-484.
723
Passy, S. I. 2012. A hierarchical theory of macroecology. Ecol. Lett. 15, 923-934.
724
Petchey, O.L., Gaston, K. J., 2006. Functional diversity: Back to basics and looking forward.
725
Ecol. Lett. 9, 741-758.
726
Potapova, M., Carlisle, D., 2011. Development and application of indicies to assess the 727
condition of benthicalgal communities in U.S. streams and rivers. U.S. Geological Survey 728
Open File Report 2011.
729
Prygiel, J., Coste, M., 2000. Guide Méthodologique pour la mise en oeuvre de l'Indice 730
Biologique Diatomées. NF T 90-354. Etude Agences de l’Eau-Cemagref Bordeaux, 731
March 2000, Agences de l’Eau. 134 pp.
732
R Development Core Team, 2014. R Languagae and Environment for statsistical 733
computering. R foundation for statistical computing, Vienna, Austria.
734
Riato, L., Della Bella, V., Leira, M., Taylor, J. C., Oberholster, P. J., 2017. A diatom 735
functional-based approach to assess changing environmental conditions in temporary 736
depressional wetlands. Ecol. Indic. 78, 205-213.
737
Rimet, F., Bouchez, A., 2012. Biomonitoring river diatoms: implications of taxonomic 738
resolution. Ecol. Indic. 15, 92-99.
739
Rimet, F., Bouchez, A., 2012b. Life-forms, cell-sizes and ecological guilds of diatoms in 740
European rivers. Knowl. Manag. Aquat. Ec. 406, 01.
741
Rimet, F., Bouchez, A., Tapolczai, K. 2016. Spatial heterogeneity of littoral benthic diatoms 742
in a large lake: monitoring implications. Hydrobiologia. 771, 179-193.
743
74.
Salmaso, N., Padisák, J., 2007. Morpho-functional groups and phytoplankton development in 744
two deep lakes (Lake Garda, Italy and Lake Stechlin, Germany). Hydrobiologia. 578, 97- 745
112.
746
Salmaso, N., Naselli-Flores, L., Padisák, J., 2015. Functional classifications and their 747
application in phytoplankton ecology. Freshwater Biol. 60, 603-619.
748
Schaumburg, J., Schranz, C., Hofmann, G., Stelzer, D., Schneider, S., Schmedtje, U., 2004.
749
Macrophytes and phytobenthos as indicators of ecological status in German lakes - a 750
contribution to the implementation of the Water Framework Directive. Limnologica. 34, 751
302-314.
752
Schwaderer, A. S., Yoshiyama, K., de Tezanos Pinto, P., Swenson, N. G., Klausmeier, C. A., 753
Litchman, E., 2011. Eco-evolutionary differences in light utilization traits and 754
distributions of freshwater phytoplankton. Limnol Oceanogr. 56, 589-598.
755
Smucker, N. J., Vis, M. L., 2010. Using diatoms to assess human impacts on streams benefits 756
from multiple-habitat sampling. Hydrobiologia. 654, 93-109.
757
Snoeijs, P., Busse, S., Potapova, M., 2002. The importance of diatom cell size in community 758
analysis 1. J. Phycol. 38: 265-281.
759
Soininen, J., 2007. Environmental and spatial control of freshwater diatoms- a review. Diatom 760
Res. 22, 473-490.
761
Soininen, J., Jamoneau, A., Rosebery, J., Passy, S. I., 2016. Global patterns and drivers of 762
species and trait composition in diatoms. Glob. Ecol. Biogeogr. 25: 940-950.
763
Suarez-Seoane, S., Osborne, P.E., Aloneso, J.C., 2002. Large-scale habitat selectionby 764
agricultural steppe birds in Spain: identifying species—habitat responsesusing 765
generalized additive models. J. Appl. Ecol. 39, 755–771.
766
Stenger-Kovács, C., Buczkó, K., Hajnal, É., Padisák, J., 2007. Epiphytic, littoral diatoms as 767
bioindicators of shallow lake trophic status: Trophic Diatom Index for Lakes (TDIL) 768
developed in Hungary. Hydrobiologia. 589, 141-154.
769
Stenger-Kovács, C., Lengyel, E., Buczkó, K., Tóth, M. F., Crossetti, O. L., Pellinger, A., 770
Zámbóné Doma, Zs., Padisák, J., 2014. Vanishing world: alkaline, saline lakes in Central 771
Europe and their diatom assemblages. Inland Waters. 4, 383-396.
772
![Fig. 3 Relationship between the conductivity and (a) SCIL [r=0.25, p=0.0024], (b) DISP 836](https://thumb-eu.123doks.com/thumbv2/9dokorg/1424250.120699/29.892.107.604.155.620/fig-relationship-conductivity-scil-r-p-b-disp.webp)