Identification of New Donors for Spot Blotch Resistance in Cultivated Wheat Germplasm
J. Kumari1,*, S. Kumar1, N. SiNgh1, S.S. VaiSh2, S. DaS3, a. gupta4 and J.C. raNa5
1ICAR-National Bureau of Plant Genetic Resources, New Delhi-110012, India
2Institute of Agricultural Sciences, Banaras Hindu University, Varanasi-221005, India
3Uttar Banga Krishi Viswavidyalaya, Pundibari, CoochBeahar, West Bengal-736165, India
4ICAR-Indian Institute of Wheat and Barley Research, Karnal-132001, India
5Bioversity International, New Delhi-110012, India (Received 10 October 2017; Accepted 2 March 2018;
Communicated by X.F. Zhang)
One thousand four hundred and eighty three spring wheat germplasm (Triticum aestivum L.) lines comprising Indian as well as exotic lines were screened for resistance to spot blotch disease during winter 2014-15 at hot spot locations i.e., Banaras Hindu University, Varanasi and Uttar Banga Krishi Vishwavidyalaya, Cooch Behar. Severity of the disease at different stages beginning from tillering to dough stage was recorded. Location Severity Index (LSI) of Varanasi was higher than Cooch Behar. Twenty eight accessions were resistant or highly resistant at both locations. These 28 accessions were validated during the winter season (2015–2016). These germplasm were also evaluated at four environments for agronomic traits. Out of 28 accessions, seven (IC564121, IC529684, IC443669, IC443652, IC529962, IC548325 and EC178071-331) were highly resistant across the locations and over the years of study. These accessions comprised one exotic and six indigenous accessions belonging to Uttarakhand and Haryana. Two lines (IC529962 and IC443652) had higher yield than the best check at all the locations. These lines showing highly resistant reaction alongwith wider adaptability can be expedited for direct cultivation or for the development of high yielding and disease resistant cultivars. These lines can also be used for identification of novel resistance gene using allele mining tools and their deployment for the development of spot blotch resistant cultivars.
Keywords: wheat, spot blotch, germplasm, stability
Introduction
Spot blotch disease leads to significant yield losses ranging from 18 to 50% in warmer and humid regions of the world such as Eastern India, Bangladesh, the Terai of Nepal, Latin America, China and Africa (Saari 1998; Singh et al. 2007; Gurung et al. 2014).
Besides, losses in grain yield, leaf blight causes seed discoloration, shrivelled seeds and loss in seed viability. Climatic changes in temperature and humidity are the major factors behind occurrence of this disease (Singh et al. 2007; Joshi et al. 2007a; Joshi et al. 2007b).
*Corresponding author; E-mail: jj.gene@gmail.com
During last 2–3 decades, foliar leaf blight popularly known as spot blotch caused by Bipolaris sorokiniana (Sacc.) Shoemaker [stat. anam.] has emerged as one of the major threats to wheat production in India. Spot blotch is affecting nearly 9 million hectares of the warm North-Eastern Plain Zone of India where millions of resource-poor farmers grow wheat after rice. This serious biotic threat has been first reported in India in 1914 (Joshi et al. 1986) and thereafter several research programs have been conducted (Chau- rasia et al. 1999; Joshi et al. 2002; Joshi et al. 2004a; Joshi et al. 2004b; Joshi et al. 2007a;
Chand et al. 2003; Khan and Chowdhury 2011). Spot blotch of wheat has become major pathogen at national level and the frequency is highest in North Eastern Plains Zone due to prevalence of hot and humid weather conditions. However due to climate change and crop intensification, this disease is also gaining attention in north western, peninsular zone and central zone of India, posing new challenges to farmers. Current Indian wheat cultivars do not possess a robust resistance to spot blotch (Kumar et al. 2009; Joshi et al.
2007b). A significant jump of wheat yield in India is expected if germplasm with robust resistance to spot blotch pathogens are developed and deployed (Joshi et al. 2007a). So far, only few lines have been registered as resistant to spot blotch genetic stock with Na- tional Bureau of Plant Genetic Resources. Thus, the identification of donor lines resistant to spot blotch remains a continuing challenge (Joshi et al. 2007b). Multi-location evalua- tion of genebank wheat collections at hotspots were performed to identify new donor germplasm with novel genes and genetic combinations that can be used as a source of resistance in breeding programs.
Materials and Methods Plant material
Wheat germplasm comprising 1308 indigenous and 175 exotic collections were investi- gated for spot blotch resistance in the present study. The screening was conducted at hot spot locations of north eastern plain zone of India, viz. Banaras Hindu University, Vara- nasi, India, (25°N and 83°E, altitude 82 m AMSL, with an average annual rainfall of 998 mm) and Uttar Banga Krishi Vishwavidyalaya, Cooch Behar, West Bengal, India (26°N and 89°E, altitude 42 m AMSL, with an average annual rainfall of 3201 mm) against all the prevailing virulent isolates of spot blotch during winter 2014–15. Each accession was sown in two rows of 3 m length with 25 cm row spacing with a susceptible check (Sona- lika) and resistant check (DBW39) after every 20 accessions. Agronomic practices rec- ommended for normal fertility (120N: 80P: 60K) and irrigated conditions (Singh 1986) were followed. Lines showing highly resistant reaction were identified and re-evaluated during winter 2015–2016 in randomized block design with three replications with suscep- tible check Sonalika, to evaluate the stability of resistance through area under disease progress curve (AUDPC). These lines were also grown at Punjab Agricultural University (PAU), Ludhiana; Banaras Hindu University(BHU), Varanasi; Agharkar Research Insti- tute (ARI), Pune and Uttar Banga Krishi Viswavidyalaya (UBKV), Cooch Behar for ag- ronomic evaluation.
Creation of epiphytotics and disease evaluation
To create epiphytotic conditions in the field, wheat lines were inoculated artificially with a pure culture of local isolate (pathotype T-79) of B. sorokiniana which was multiplied on sorghum grains, and the spores were harvested in water. A spore suspension of 104 co- nidia/ml was uniformly sprayed during evening hours at tillering, flag leaf emergence and anthesis stages of the crop (Chaurasia et al. 1999). In addition, susceptible line Sonalika was grown after every 20 lines and also in alley across the bed just to ensure the proper inoculums in the field. The field was heavily fertilized and frequently irrigated to provide a suitable environment for the disease development. Field was irrigated after spraying in order to maintain high relative humidity (RH).
The recording of disease was done on a new 0–9 double digit scoring method (Singh et al. 2005a) based on percent leaf area covered due to blight in case of flag and penulti- mate leaf to flag leaf (F-1) at different growth stages (GS) viz., anthesis (GS63), milk (GS73), dough (GS83) and late dough (GS87) stages on Zadoks scale (Zadoks et al.
1974) to observe response of each entry against leaf blight. The left side digit indicates the score of blight on flag leaf (F) and right side digit of score represents the percent blighted area of flag-1 leaf (F-1). Based on the disease score values obtained at different stages at an interval of 7–10 days (between anthesis to late dough stage), the genotypes were categorized as immune or no blight (00), resistant (HLB score 01–23), moderately resistant (34–45), moderately susceptible (56–68), susceptible (78–89) and highly sus- ceptible (89–99). Amongst four stages, blight record at late dough stage was most distinct in terms of providing clear comparison between resistant and susceptible stages and therefore data at late dough stage was used for final categorization of resistance. The categorization of resistance against spot blotch was done after taking the average and highest score over locations each year and later a mean of average and highest scores. The average was calculated by taking both digits separately and value >0.5 was counted as one score. In case of average and highest score for categorization, the maximum score was used to categorize the resistance as per method of Singh et al. (2016).
Area under disease progress curve (AUDPC) based on disease severity over time (Van der Plank 1963) was estimated. For proper comparison among the germplasm acces- sions, AUDPC values were standardized by maturity recorded for each genotype at each location to make it as AUDPC percent days (Reynold and Neher 1997). The observations were also recorded for grain yield per meter length, 1000 grain yield and days to maturity.
GGE biplot software (Yan 2001) was used to study stability of grain yield and 1000-grain weight for promising resistant lines by generating GGE biplot graphs.
Results Weather condition
Weather parameters (temperature, rainfall and relative humidity) were recorded during 2014–2015 and 2015–2016 at both the hot spot locations (Varanasi and Cooch Behar).
Temperature variation was observed as (6 –37) °C and (8 –33) °C during year 2014–2015
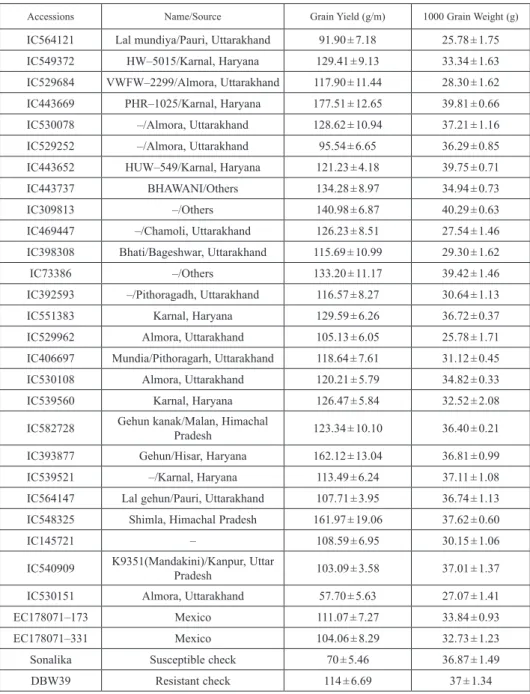
Table 1. Superior wheat accessions for spot blotch resistance alongwith their disease reaction, maturity and yield
Accessions Name/Source Grain Yield (g/m) 1000 Grain Weight (g)
IC564121 Lal mundiya/Pauri, Uttarakhand 91.90 ± 7.18 25.78 ± 1.75
IC549372 HW–5015/Karnal, Haryana 129.41 ± 9.13 33.34 ± 1.63
IC529684 VWFW–2299/Almora, Uttarakhand 117.90 ± 11.44 28.30 ± 1.62
IC443669 PHR–1025/Karnal, Haryana 177.51 ± 12.65 39.81 ± 0.66
IC530078 –/Almora, Uttarakhand 128.62 ± 10.94 37.21 ± 1.16
IC529252 –/Almora, Uttarakhand 95.54 ± 6.65 36.29 ± 0.85
IC443652 HUW–549/Karnal, Haryana 121.23 ± 4.18 39.75 ± 0.71
IC443737 BHAWANI/Others 134.28 ± 8.97 34.94 ± 0.73
IC309813 –/Others 140.98 ± 6.87 40.29 ± 0.63
IC469447 –/Chamoli, Uttarakhand 126.23 ± 8.51 27.54 ± 1.46
IC398308 Bhati/Bageshwar, Uttarakhand 115.69 ± 10.99 29.30 ± 1.62
IC73386 –/Others 133.20 ± 11.17 39.42 ± 1.46
IC392593 –/Pithoragadh, Uttarakhand 116.57 ± 8.27 30.64 ± 1.13
IC551383 Karnal, Haryana 129.59 ± 6.26 36.72 ± 0.37
IC529962 Almora, Uttarakhand 105.13 ± 6.05 25.78 ± 1.71
IC406697 Mundia/Pithoragarh, Uttarakhand 118.64 ± 7.61 31.12 ± 0.45
IC530108 Almora, Uttarakhand 120.21 ± 5.79 34.82 ± 0.33
IC539560 Karnal, Haryana 126.47 ± 5.84 32.52 ± 2.08
IC582728 Gehun kanak/Malan, Himachal
Pradesh 123.34 ± 10.10 36.40 ± 0.21
IC393877 Gehun/Hisar, Haryana 162.12 ± 13.04 36.81 ± 0.99
IC539521 –/Karnal, Haryana 113.49 ± 6.24 37.11 ± 1.08
IC564147 Lal gehun/Pauri, Uttarakhand 107.71 ± 3.95 36.74 ± 1.13
IC548325 Shimla, Himachal Pradesh 161.97 ± 19.06 37.62 ± 0.60
IC145721 – 108.59 ± 6.95 30.15 ± 1.06
IC540909 K9351(Mandakini)/Kanpur, Uttar
Pradesh 103.09 ± 3.58 37.01 ± 1.37
IC530151 Almora, Uttarakhand 57.70 ± 5.63 27.07 ± 1.41
EC178071–173 Mexico 111.07 ± 7.27 33.84 ± 0.93
EC178071–331 Mexico 104.06 ± 8.29 32.73 ± 1.23
Sonalika Susceptible check 70 ± 5.46 36.87 ± 1.49
DBW39 Resistant check 114 ± 6.69 37 ± 1.34
a(AUDPC/days to maturity) × 100; DS: Disease score at hard dough stage.
Table 1. (cont.)
Days to Maturity Mean AUDPC AUDPC %daysa DS (Highest) DS (Average) Category
122 362 ± 13 302 ± 16 24 13 Highly resistant
117 432 ± 19 451 ± 42 35 24 Resistant
127 79 ± 17 59 ± 13 23 12 Highly resistant
119 88 ± 19 65 ± 14 23 12 Highly resistant
129 111 ± 26 73 ± 16 34 23 Resistant
117 201 ± 1 171 ± 2 34 23 Resistant
117 77 ± 16 62 ± 13 24 13 Highly resistant
115 316 ± 22 419 ± 3 45 35 Resistant
107 928 ± 148 902 ± 159 69 47 Moderately resistant
116 535 ± 49 463 ± 50 36 35 Resistant
118 713 ± 50 737 ± 9 56 56 Moderately resistant
113 577 ± 77 509 ± 74 46 34 Resistant
117 708 ± 2 673 ± 19 67 57 Moderately resistant
111 915 ± 173 869 ± 178 67 46 Moderately resistant
121 92 ± 20 74 ± 17 12 12 Highly resistant
113 570 ± 9 526 ± 11 24 24 Resistant
109 434 ± 71 384 ± 65 35 34 Resistant
108 1126 ± 153 1028 ± 154 68 56 Moderately susceptible
117 418 ± 32 416 ± 23 24 23 Resistant
110 967 ± 156 915 ± 157 68 45 Moderately resistant
107 442 ± 12 387 ± 7 34 34 Resistant
104 600 ± 31 563 ± 39 36 24 Resistant
109 174 ± 42 148 ± 36 23 12 Highly resistant
110 861 ± 141 792 ± 138 58 36 Moderately resistant
113 605 ± 110 539 ± 103 46 34 Resistant
128 535 ± 44 417 ± 34 35 35 Resistant
111 1139 ± 111 1022 ± 122 68 57 Moderately resistant
114 325 ± 19 273 ± 20 24 13 Highly resistant
123 2630 ± 22 2103 ± 21 69 59 Susceptible
125 583 ± 12 469 ± 14 35 24 Resistant
and (7 –41) °C and (10 –34) °C during year 2015–2016 at Varanasi and Cooch Behar, respectively. Total rainfall received during 2014–2015 and 2015–2016 was 41 and 159 mm respectively at Cooch Behar whereas at Varanasi 131 mm and 46 mm rainfall was received during 2014–2015 and 2015–2016. Thus rainfall was recorded higher in Vara- nasi during year 2014–2015 and in Cooch Behar during year 2015–2016. Relative humid- ity was observed as 74%–84% (2014–2015) and 71%–83% (2015–2016) at Cooch Behar and 54%–82% (2014–2015) and 44%–75% (2015–2016) at Varanasi (Fig S1*).
Screening of germplasm
One thousand four hundred and eighty three wheat lines were screened against prevailing virulent isolates of B. sorokiniana at the hot spot locations, Cooch Behar and Varanasi.
Wide variability in wheat germplasm was observed for disease reactions against spot blotch. Location severity index was high for BHU, Varanasi (5.04) compared to Cooch Behar (2.54) during winter season 2014–2015 whereas during 2015–2016 it was 4.7 and 5.4 for BHU, Varanasi and Cooch Behar, respectively. The check Sonalika showed sus- ceptibility with mean value of 68 and 42 and resistant check, DBW39 showed value of 16 and 24 at Varanasi and Cooch Behar, respectively. This indicates that season and environ- ment were compatible for disease screening. Cooch Behar had normal distribution of disease response with majority of germplasm having moderately resistant reaction where- as Varanasi had positively skewed distribution with majority of germplasm showing high- ly susceptible reaction. At Cooch Behar, 58 accessions including 46 indigenous lines were highly resistant and 522 including 424 indigenous lines were resistant. At Varanasi, 41 were highly resistant that included 33 Indian material and, 133 including 121 indige- nous accessions were found resistant (Fig S2). 11.73% of the total wheat accessions were resistant or highly resistant at Varanasi, whereas 39.11% were found resistant at Cooch Behar. The entries classified as resistant had double digit score ranging from 1, 2 to 2, 3.
Twenty eight germplasm lines (IC564121, IC549372, IC529684, IC443669, IC530078, IC529252, IC443652, IC443737, IC309813, IC469447, IC398308, IC73386, IC392593, IC551383, IC529962, IC406697, IC530108, IC539560, IC582728, IC393877, IC539521, IC564147, IC548325, IC145721, IC540909, IC530151, EC178071-173 and EC178071- 331) showed either resistant or highly resistant reaction at both locations. Out of 28 spot blotch tolerant accessions, 12 were named landraces as Lal Mundia, Bhati and Mundia grown in Pauri, Almora, Chamoli, Bageshwar and Pithoragadh districts of Uttarakhand state in Himalayan mountaineous regions. Seven accessions belonged to Haryana and others from Uttar Pradesh and Himachal Pradesh. Two accessions were introduced from Mexico (Table 1).
Validation and identification of promising lines
Accessions showing resistance during first year at both locations were validated under artificially epiphytotic condition during second year evaluation (2015–2016 winter sea-
*Further details about the Electronic Supplementary Material (ESM) can be found at the end of the article.
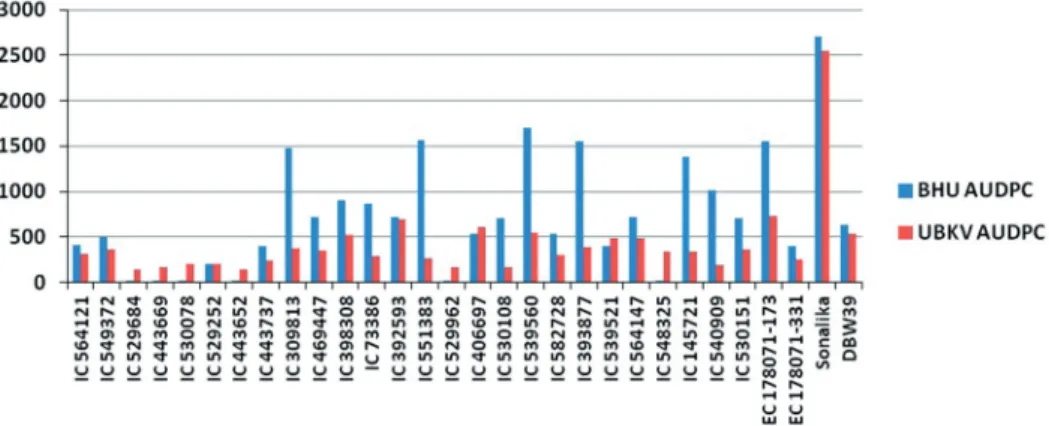
son). All the accessions were resistant at anthesis and milky stage at both locations. How- ever, disease appearance was found on some accessions during dough stage. These lines were also analyzed for mean AUDPC value and AUDPC %days. AUDPC takes into ac- count all the different growth stages for evaluating wheat germplasm against foliar blight, and thus, was taken into consideration for searching resistance sources. The AUDPC value for all the tested entries ranged from 15 to 1699 at Varanasi and 138 to 879 at Cooch Behar (Fig. 1). The AUDPC %days values varied from 12 to 1603 at Varanasi and 106 to 745 at Cooch Behar. Based on disease severity score at dough stage, ten accessions (IC564121, IC529684, IC443669, IC530078, IC529252, IC443652, IC529962, IC539521, IC548325, EC178071-331) at Varanasi and thirteen accessions (IC564121, IC549372, IC529684, IC443669, IC443652, IC469447, IC73386, IC529962, IC530108, IC548325, IC540909, IC530151, EC178071-331) at Cooch Behar were resistant or highly resistant with disease severity score less than 23. These lines also had mean AUDPC value and AUDPC %days around 600 (Table 1).
Based on average and highest disease score at late dough stage across the locations, seven accessions IC564121, IC529684, IC443669, IC443652, IC529962, IC548325 and EC178071-331 were highly resistant and thirteen lines (IC549372, IC530078, IC529252, IC443737, IC469447, IC73386, IC406697, IC530108, IC582728, IC539521, IC564147, IC540909 and IC530151) were resistant, seven lines (IC309813, IC398308, IC392593, IC551383, IC393877, IC145721 and EC178071-173) were moderately resistant and one accession, viz. IC 309813 was moderately susceptible (Table 1).
Stability of Spot blotch tolerant lines for grain yield and 1000 grain weight
The seven resistant lines were analyzed for stability of grain yield and 1000 grain weight based on agronomic evaluation at PAU, Ludhiana; BHU, Varanasi; ARI, Pune and UBKV, Cooch Behar. The graphical method, GGE biplot analysis was employed by using two PCs to investigate environmental variation and interpret the Genotype × Environment
Figure 1. Mean AUDPC of superior wheat germplasm at Coochbehar and Varanasi location
(G × E) interaction. Results of a combined analysis of variance (ANOVA) are presented in Table 2, which gives an overall picture of the relative magnitude of G, E, and GE vari- ance terms. The location (L) (P < 0.01) and genotype (G) (P < 0.01) effects were signifi- cant for 1000 grain weight, whereas for grain yield only location was significant (P < 0.01), the genotype (G) effect was not significant. The heritability was 0.83 for 1000 grain
Table 2. Analysis of variance and genetic parameters of stable tolerant lines for grain yield and 1000 grain weight
Source D.F. 1000 grain weight (g) Grain yield (g)
Location (A) 3 181.57** 4589.05*
Genotype (B) 6 189.34** 1849.84
A × B 18 30.33 2054.40
CV% 17.18 34.13
H = Vg/Vp 0.83 0.55
G/GGE% (SS) 66.61 42.68
% of GGE explained by PC1 68.4 59
% of GGE explained by PC2 26.7 28.4
*5% level of significance; **1% level of significance.
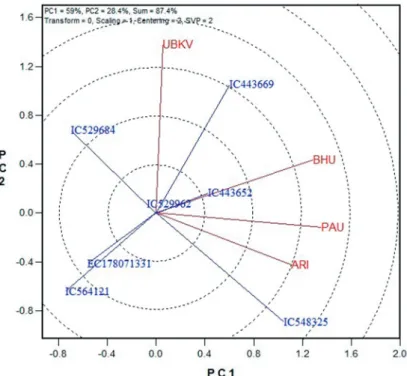
Figure 2. The GGE biplot showing stability pattern of seven tolerant lines for gain yield
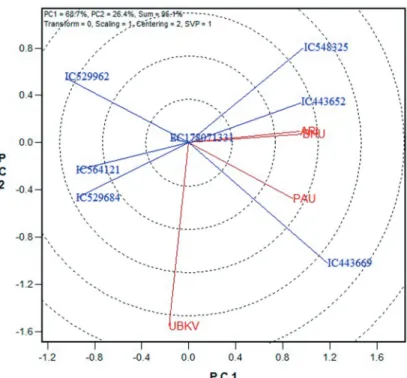
weight and 0.55 for grain yield. In GGE biplot analysis, the first two principal compo- nents (PC1 and PC2), derived by subjecting the environment-centred yield to singular value decomposition (SVD), were significant: PC1 accounted for 68.4% and PC2 for 26.7% of GGE variation for 1000 grain weight whereas for grain yield it was 59% for PC1 and 28.4% for PC2. The main effects of genotypes (G) plus the G × E effects for the seven wheat lines in four environments for grain yield were shown in Fig 2. The environ- ments that contributed most to the G and G × E variability are located further apart in the biplot and these were UBKV, Cooch Behar and ARI, Pune. ARI, Pune being closer to the center of the biplot, can be considered as more stable location that discriminated geno- types more similarly. Accessions IC529962, a local collection from Almora district of Uttarakhand, and IC443652, a cultivar (popularly known as HUW549) and EC178071- 331 from Mexico were widely adapted for grain yield as they were plotted near origin of the biplot. EC178071-331 was also stable for 1000 grain weight as placed near the origin (Fig. 3). The locations ARI, Pune and BHU, Varanasi had similar performance for 1000-grain weight in these genotypes. For 1000-grain weight also UBKV, Cooch Behar was more discriminating location.
Figure 3. The GGE biplot showing stability pattern of seven tolerant lines for thousand grain weight
Discussion
Genebank, the reservoir of entire gamut of diversity in the form of landraces, germplasm, elite breeding lines and wild relatives collected from different agro-ecological regions provide an opportunity to search for germplasm with unique traits. These genetic re- sources may carry novel traits and allele combination for resistance /tolerance to diseases, pests and harsh climatic conditions. Conservation of these genetic resources will become meaningful, once their potential value for use will be identified.
We screened 1483 wheat germplasm against spot blotch disease at hot spot locations under artificial epiphytotic condition to identify potentially new source of spot blotch diseases resistance. These germpalsm lines were also evaluated under different agro-eco- logical regions for yield traits so that spot blotch resistant genotypes with high and stable yield across the zones can be identified to directly promote at farmers’ field for cultiva- tion.
Evaluation of wheat germplasm at hot spot locations
The spot blotch disease is increasingly becoming a cause of concern particularly in the warm and humid environments of Indian sub-continent (Duveiller et al. 2005) where the mean temperature of the coolest month is higher than 17.5 °C (Dubin et al. 1998). Eastern parts of India have high temperature and humidity during the wheat growing period. The temperature in Varanasi was warmer than Coochbehar during post anthesis stage in both seasons that enhanced faster development of spot blotch disease. It was depicted in the graph through more susceptible response by genotypes and also by high LSI at Varanasi.
Total rainfall received during initial screening was higher at Varanasi that boosted in- crease in relative humidity and disease development. The climate change influence on temperature and relative humidity is playing a major role in the spread of diseases in the cooler, non-traditional irrigated rice-wheat growing areas (Duveiller and Gilchrist 1994;
Sharma et al. 2007). In Indian sub-continent, the yield reduction of wheat has already been caused by terminal heat stress. Increased spot blotch severity may aggravate further yield damage (Nagarajan 2005). Climate change not only increases the temperature but also the number of cloudy days during winter months. It reduced solar radiation and lengthened the duration of high relative humidity resulting in early establishment of spot blotch in wheat (Sharma et al. 2007). Therefore, we need to develop spot blotch resistant cultivars alongwith high temperature tolerance for broader areas other than traditional areas.
Spot blotch resistance is governed by the presence of at least two or more genes or QTLs (Kumar et al. 2007; Kumar et al. 2009; Kumar et al. 2010). Low level of resistance to spot blotch has been reported in most of the high yielding varieties of wheat in India (Joshi et al. 2007a). Recently, some resistant germplasm and genetic stocks have been identified through a recent CIMMYT-sponsored cross-country project, (CIMMYT 2013) and by Indian researchers (Chaurasia et al. 1999; Singh et al. 2005b; Chowdhury et al.
2013; Kumar et al. 2016; NBPGR website). Some synthetic hexaploid wheats were also
identified as important resistance source to spot blotch resistance (Sharma and Duveiller 2007). However, there is a further need to search for novel germplasm lines with spot blotch resistance alongwith high yield potential in the vast genepool of Indian genebank under multi-environmental trials. Germplasm screening against spot blotch under field condition is indispensable because studies under controlled conditions are not feasible (Duveiller and Sharma 2012). During initial screening of germplasm, normal distribution of disease response was observed at Coochbehar with majority of germplasm showing moderately resistant reaction whereas positively skewed distribution with majority of germplasm showing highly susceptible reaction was observed at Varanasi. High disease pressure and LSI was observed due to conducive weather condition at Varanasi for dis- ease spread. In this study significant variability for spot blotch resistance in terms of dis- ease severity, AUDPC value, AUDPC per cent days and agronomic traits were observed in the germplasm collection (Table 2), hence the genebank wheat accessions may be mined for the discovery of novel genes. Chaurasia et al. 1999 also found 43 lines as resist- ant in spring wheat lines belonging to Indian and CIMMYT gene pool. Spot blotch resist- ant germplasm lines identified in the present multi-environmental study could be used in wheat improvement programmes for enhancing resistance to this disease in the back- ground of robust yield potential lines for direct cultivation in the farmers’ field. Of the 28 promising lines showing spot blotch tolerance, twelve belonged to landraces of Uttara- khand and seven belonged to Haryana. This showed that primitive landraces have the gene/ gene combinations for disease resistance. These lines with wider genetic base will also bring sustainability in the wheat breeding programme. Consequently further explora- tion of landraces from unexplored areas of Uttrakhand and other regions imparting resist- ance to spot blotch has been suggested. Thirteen spot blotch resistant lines also had sig- nificantly higher grain yield than the resistant check, DBW39 (Table 1).We could also observe that out of seven spot blotch resistant lines, IC529962 and IC443652 were high yielding and widely adapted to different zones / locations. Germplasm showing high yield and highly resistant nature, IC548325, a collection from Shimla, Himachal Pradesh was specifically suited to ARI, Pune or southern zone and IC443669 was specifically adapted to UBKV, Cooch Behar. The resistant accession IC443652 is a breeding line, HUW-549 (PARULA/ATTILA//BOBWHITE-S) developed at BHU, Varanasi, hot spot for spot blotch. Similarly, EC178071-331 was widely adapted across the locations for 1000-grain weight as depicted by the GGE biplot. Germplasm lines which are showing highly resist- ant reaction alongwith wider adaptability for yield traits can be expedited for direct culti- vation or to develop high yielding disease resistant cultivars. These lines are available for research purpose globally following extant national legislation.
Acknowledgements
The authors are grateful to Indian Council of Agricultural Research, Government of India for funding this research under project CRP-Agrobiodiversity. The authors are thankful to Director, ICAR-NBPGR New Delhi; Director, IIWBR, Karnal and Collaborating centres
of CRP-Agrobiodiversity for providing the facilities and guidance in germplasm evalua- tion. The authors specifically thank collaborators involved in agronomic evaluation at PAU, Ludhiana and ARI, Pune centres.
References
Chand, R., Pandey, S.P., Singh, H.V., Kumar, S., Joshi, A.K. 2003. Variability and its probable cause in natural populations of spot blotch pathogen Bipolaris sorokiniana of wheat (T. aestivum L.) in India. J. Plant Dis.
Prot. 110:27–35.
Chaurasia, S., Joshi, A.K., Dhari, R., Chand, R. 1999. Resistance to foliar blight of wheat: A search. Genet. Res.
Crop Evol. 46:469–475.
Chowdhury, A.K., Singh, G., Tyagi, B.S., Ojha, A., Dhar, T., Bhattacharya, P.M. 2013. Spot blotch disease of wheat – a new thrust area for sustaining productivity. J. Wheat Res. 5(2):1–11.
CIMMYT: 2013. Research battles wheat spot blotch disease Informa No1851, CIMMYT Corporate Communications, Mexico.
Dubin, H.J., Arun, B., Begum, S.N., Bhatta, M., Dhari, R., Goel, L.B., Joshi, A.K., Khanna, B.M., Malaker, P.K., Pokhrel, D.R., Rahman, M.M., Saha, N.K., Shaheed, M.A., Sharma, R.C., Singh, A.K., Singh, R.M., Singh, R.V., Vergas, M., Verma, P.C. 1998. Result of South Asian regional Helminthosporium leaf blight and yield experiment 1993–1994. In: Duveiller, E., Dubin, H.J., Reeves, J., McNab, A. (eds). Proc. Int.
Workshop on Helminthosporium disease of Wheat: Spot Blotch and Tan Spot, pp. 182–187, CIMMYT, El Batan, Mexico.
Duveiller, E., Gilchrist, L.I. 1994. Production constraints due to Bipolaris sorokiniana in wheat: current situa- tion and future prospects In: Saunders, D.A., Hettel, G.P. (eds). Wheat in Heat-stressed Environments:
Irrigated, Dry Areas, and Rice-wheat Farming Systems, pp. 343–352, CIMMYT, Mexico.
Duveiller, E., Kandel, Y.R., Sharma, R.C., Shrestha, S.M. 2005. Epidemiology of foliar blights (spot blotch and tan spot) of wheat in the plains bordering the Himalayas. Phytopath. 95:248–256.
Duveiller, E., Sharma, R.C. 2012. In: Sharma I. editor. Disease resistance in wheat: Wheat resistance to spot blotch or foliar blight. CABI; pp. 120–135.
Gurung, S., Mamidi, S., Bonman, J.M., Xiong, M., Brown-Guedira, G., Adhikari, T.B. 2014. Genome-Wide Association Study Reveals Novel Quantitative Trait Loci Associated with Resistance to Multiple Leaf Spot Diseases of Spring Wheat. Xu, M. (ed.) PLoS ONE. 9(9):e108179. doi:10.1371/journal.pone.0108179.
Joshi, A.K., Chand, R. 2002. Variation and inheritance of leaf angle, and its association with spot blotch (Bipolaris sorokiniana) severity in wheat (Triticum aestivum). Euphytica 124:283–291.
Joshi, A.K., Chand, R., Kumar, S., Singh, R.P. 2004a. Leaf tip necrosis: a phenotypic marker associated with resistance to spot blotch disease in wheat. Crop Sci. 44:792–796.
Joshi, A.K., Ferrara, G.O., Crossa, J., Singh, G., Sharma, R.C., Chand, R., Parsad, R. 2007a. Combining supe- rior agronomic performance and terminal heat tolerance with resistance to spot blotch (Bipolaris sorokini- ana) of wheat in the warm humid Gangetic Plains of South Asia. Field Crops Res. 103:53–61.
Joshi, A.K., Kumar, S., Chand, R., Ortiz-Ferrara, G. 2004b. Inheritance of resistance to spot blotch caused by Bipolaris sorokiniana in spring wheat. Plant Breed. 123:213–219.
Joshi, A.K., Kumari, M., Singh, V.P., Reddy, C.M., Kumar, S., Chand, R. 2007b. Stay green trait: variation, inheritance and its association with spot blotch resistance in spring wheat (Triticum aestivum L.). Euphytica 153:59–71.
Joshi, L.M., Singh, D.V., Srivastava, K.D. 1986. Wheat and wheat diseases in India. In: Joshi, L.M., Singh, D.V., Srivastava, K.D. (eds) Problem and progress of wheat pathology in south Asia. Malhotra Publishing House, New Delhi, India pp. 1–19.
Khan, H., Chowdhury, S. 2011. Identification of resistance source in wheat germplasm against spot blotch disease caused by Bipolaris sorokiniana. Archives Phyto. Plant Prot. 44(9):840–844.
Kumar S., Prasad, L.C., Kumar, U., Tyagi, K., Arun, B., Joshi, A.K. 2007. Inheritance and allelic relationship of resistance genes to spot blotch of wheat caused by Bipolaris sorokiniana. In: Buck, H.T., Nisi, J.E.,
Salomón, N. (eds) Developments in plant breeding vol 12: wheat production in stressed environments.
Springer, The Netherlands, pp. 113–118.
Kumar, U., Joshi, A.K., Kumar, S., Chand, R., Roder, M.S. 2009. Mapping of resistance to spot blotch disease caused by Bipolaris sorokiniana in spring wheats. Theor. Appl. Genet. 118:783–792.
Kumar, U., Joshi, A.K., Kumar, S., Chand, R., Roder, M.S. 2010. Quantitative trait loci for resistance to spot blotch caused by Bipolaris sorokiniana in wheat (T. aestivum L.) lines ‘Ning 8201’ and ‘Chirya 3’. Mol.
Breed. 26:477–491.
Kumar, S., Archak, S., Tyagi, R.K. 2016. Evaluation of 19,460 wheat accessions conserved in the Indian national genebank to identify new sources of resistance to rust and spot blotch diseases. PLoS One 11:e0167702.
Nagarajan, S. 2005. Can India produce enough wheat even by 2020? Current Sci. 89:1467–1471.
Reynolds, K.L., Neher, D.A. 1997. Statistical comparison of epidemics. In: Francl, L.J., Neher, D.A. (eds), Exercises in Plant Disease Epidemiology. The American Phytopathological Society, St. Paul, MN, pp.
34–37.
Saari, E.E. 1998. Leaf blight diseases and associated soil borne fungal pathogens of wheat in south and south- east Asia. In: Duveiller, E., Dubin, H.J., Reeves, J., McNab, A. (eds), Helminthosporium Blights of Wheat:
Spot Blotch and Tan Spot. CIMMYT, Mexico, D. F. pp. 37–51.
Sharma, R.C., Duveiller, E., Ortiz-Ferrara, G. 2007. Progress and challenge towards reducing wheat spot blotch threat in the Eastern Gangetic Plains of South Asia: Is climate change already taking its toll? Field Crops Res. 113:109–118.
Sharma, R.C., Duveiller, E. 2007. Advancement toward new spot blotch resistant wheats in South Asia. Crop Sci. 47:961–968.
Singh, D., Singh, R.V., Singh, A.K., Singh, R.N. 2005a. Sources of resistance against foliar blight of wheat caused by Helminthosporium sativum. Indian Phytopath. 58:111–113.
Singh, D.P., Kumar, P., Singh, S.K. 2005b. Resistance in wheat genotypes against leaf blight caused by Bipolaris sorokiniana at seedling along with adult plant stage. Indian Phytopath. 58:344.
Singh, D.P., Singh, S.K., Singh, I. 2016. Assessment and impact of spot blotch resistance grain discolouration in wheat. Indian Phytopath. 69:363–367.
Singh, G., Singh, D.P., Chatrath, R., Tyagi, B.S., Singh, G.P., Singh, S.K., Shoran. J. 2007. Combating Helminthosporium leaf blight in wheat through resistance breeding. Indian J. Genet. 67(3):293–296.
Singh, R.P. 1986. Development of improved production technologies. In: Tandon, J.P., Sethi, A.P. (eds) Twenty- five years of Coordinated Wheat Research 1961–1986. Wheat Project Directorate, Indian Council of Agricultural Research, New Delhi, India, pp. 94–126.
Van der Plank, J.E. 1963. Plant Diseases: Epidemics and Control. New York, USA: Academic Press.
Yan, W. 2001. GGE biplot – a Windows application for graphical analysis of multi-environment trial data and other types of two-way data. Agron. J. 93:1111–1118.
Zadoks, J.C., Chang, T.T., Konzak, C.F. 1974. A decimal code the growth stages of cereals. Weed Res. 14:415–
421.
Electronic Supplementary Material (ESM)
Electronic Supplementary Material (ESM) associated with this article can be found at the website of CRC at https://akademiai.com/loi/0806
Figure S1. Weekly minimum and maximum temperature during cropping season of year 1 and 2 at Varanasi and Cooch Behar
Figure S2. Response of wheat germplasm against spot blotch (HR: Highly Resistant, R: Resistant, MR:
Moderately Resistant, S: Susceptible, HS: Highly Susceptible) at Coochbehar and Varanasi